 Jianfa Wu1
 Mingyang Wu
 Yintong Guo
 Jun Lu
94% of researchers rate our articles as excellent or good
Learn more about the work of our research integrity team to safeguard the quality of each article we publish.
Find out more
ORIGINAL RESEARCH article
Front. Energy Res., 05 January 2024
Sec. Advanced Clean Fuel Technologies
Volume 11 - 2023 | https://doi.org/10.3389/fenrg.2023.1339895
This article is part of the Research TopicAdvances in Geomechanics Research and Application for Deep Unconventional ReservoirsView all 35 articles
With the depletion of conventional reservoir development, reservoir fracturing under deep high geo-stress and high geo-stress difference conditions is receiving increasing attention. Deep reservoirs typically require multi-cluster fracturing to achieve efficient reservoir transformation and development. In this paper, considering the relevant geological parameters of a certain reservoir in the southwest, three-dimensional multi-cluster reservoir fracturing models were established based on cohesive element modeling. Then, the propagation law of artificial fractures in reservoirs under the influence of the different number of fracturing clusters, injection displacement, and Young’s modulus in different regions of the 60 m fracturing well section is analyzed, and the quantitative law of parameters such as fracture length, maximum fracture width, injection point fracture width, fracture area, and tensile failure ratio during multi-cluster fracturing construction, as well as the propagation law of fracture morphology are revealed. The simulation results show that using multi-cluster fracturing can significantly improve the effectiveness of reservoir reconstruction, but as the number of fracturing clusters increases, it is also easy to form some small opening artificial fractures. These small opening artificial fractures may not be conducive to the transportation of proppants and fluids. During single cluster fracturing, the interface stiffness and rock Young’s modulus have a significant impact on the propagation of artificial fractures in the reservoir. As the number of fracturing clusters increases, the competition between artificial main fractures expands significantly, which may reduce the impact of interface stiffness and rock Young’s modulus. The fluid injection rate has a significant impact on reservoir fracturing, and in the same area, using high displacement injection can significantly increase the volume of reservoir reconstruction. This study can provide some reference for multi-cluster fracturing construction in deep reservoirs.
With the decrease of shallow structural oil and gas resources, the development and utilization of deep unconventional oil and gas resources have become very important (Ma, et al., 2023). The deep shale reservoir is an important source of unconventional oil and gas resources (Liu et al., 2018a; Moghadasi et al., 2019; Wu et al., 2020a; Huang, et al., 2021). Unfortunately, the in-situ stress of deep shale reservoirs is greater than that of shallow shale reservoirs. As a result, the current conventional fracture propagation research methods of shale reservoirs are no longer effective and cannot provide accurate guidance for fracturing operations in deep shale reservoirs (Britt, et al., 1994; Casas, et al., 2006; Zhao, et al., 2018). Then, construction methods such as liquid nitrogen fracturing (Li et al., 2023; Yang et al., 2023a) and multi-cluster fracturing (Liu et al., 2018b; Yuan et al., 2018) have been proposed one after another. Considering that multi-cluster fracturing is currently widely used, the impact mechanism in deep high-ground stress differential reservoirs is still unclear. Therefore, it is necessary to study the influence of different construction parameters on the propagation behaviour of compression fractures under deep high geo-stress and high geo-stress difference conditions.
The research methods of reservoir fracture propagation mainly include the laboratory test method, theoretical derivation method, numerical simulation method, and field test method (Wei et al., 2015; Liu, et al., 2018a; Wu et al., 2018b; Luo et al., 2022). The current research on true triaxial fracturing experiments can already consider the influence of natural bedding in reservoirs and the propagation of multiple clusters of fractures. However, the current size of cube specimens in the laboratory is usually 100 mm × 100 mm × 100 mm or 300 mm × 300 mm × 300 mm, with few experimental specimens reaching the meter level in size, far smaller than the actual reservoir modification area (Shang et al., 2018; Liu et al., 2021; Qiu et al., 2023). Therefore, there are still significant size limitations in the physical simulation research of multi-cluster fracturing based on indoor experiments (Wang, et al., 2022; Yang et al., 2023b). Meanwhile, it is worth mentioning that conducting physical simulation research on the fracturing of meter-scale experimental specimens is usually very expensive, making it difficult to conduct a comprehensive analysis. Therefore, numerical simulation technology, as a research method that can simulate the heterogeneous characteristics of reservoirs, has a certain reference value and is easy to conduct comprehensive analysis, has been increasingly widely used. After years of development, numerical simulation technology has become more and more mature, which can better analyze the complex fracture propagation in the fracturing process (Bai et al., 2023). Three kinds of numerical methods are commonly used to simulate hydraulic fractures (Xiang et al., 2009; Ju et al., 2016; Yan et al., 2018; Rougier et al., 2019): extended finite element, boundary element, and discrete element. The Extended finite element method (XFEM) (Salimzadeh and Khalili, 2015; Shi et al., 2022) is a numerical method for solving discontinuous mechanics problems (Zou, et al., 2020). The characteristic of XFEM is that it does not need to re-divide the mesh when simulating fracture propagation, which overcomes the difficulty of high-density mesh generation in high-stress and deformation concentration areas such as the fracture tip. The boundary element method (BEM) divides the elements on the boundary of the domain and approximates the boundary conditions with functions satisfying the governing equations. The discrete element method (DEM), which divides the material into separate rigid elements in a discrete manner, describes the motion and interaction of each rigid element through contact connection based on Newton’s law of motion and allows fluid flow in the channel formed between discontinuous blocks or particles, which can well describe the expansion of hydraulic fractures (Huang et al., 2022). These methods can simulate the growth of complex fractures, but each has its advantages and disadvantages. For example, the discrete element method simulates fluid migration through the connected mesh between particles and the deformation and fracture characteristics of reservoir rocks through the contact fractures between particles (Huang et al., 2019; Huang et al., 2023). However, it is difficult to consider particle size and computational efficiency, so it is difficult to be used in reservoir fracturing research. The finite element discrete element method (FDEM), proposed by Dr. Munjiza (Munjiza, 2004), has been widely used in the simulation of ground stress, fluid migration, reservoir fracturing, etc., and its applicability has been proved. In fact, the FDEM method can be implemented through globally embedded cohesive elements and can also be used for multi-cluster fracturing simulation research in deep heterogeneous reservoirs. However, when using globally embedded cohesive elements to describe the fractured interface of a reservoir, simulation calculations are very slow (Sharafisafa et al., 2023). Therefore, when the model size is large, the number of grids is large, and there are many grid nodes, the method of locally embedded cohesive elements (Wang et al., 2023) for numerical simulation research can quickly obtain large-scale fracturing simulation results. That is, using the cohesive element to conduct multi-cluster fracturing simulation research on a deep reservoir scale will more efficiently reveal the influencing factors of multi-cluster fracture propagation in deep shale reservoirs. Therefore, it is necessary to conduct three-dimensional multi-cluster fracturing simulation research on deep shale reservoirs under the influence of high ground stress and high ground stress difference based on the cohesive element modelling method.
In this paper, considering the relevant geological parameters of a certain reservoir in the southwest, three dimensional (3D) multi-cluster reservoir fracturing models based on cohesive element modeling are established, and the propagation law of artificial fractures in deep shale reservoir under the conditions of high ground stress and high ground stress difference is analyzed. The simulation method, modeling process, and benchmark model parameters are presented in Section 2, and the fracture propagation law under the influence of the different number of fracturing clusters, injection displacement, and Young’s modulus are analyzed in Section 3. The conclusion is presented at the end.
To explore the influencing factors of deep shale multi-cluster fracturing construction process through numerical simulation research. The simulation methods related to fluid-solid coupling, cohesive element rupture, fluid flow, flow distribution, and other aspects of the cohesive element modeling used in this paper were introduced. Then, a method for embedding cohesive elements and establishing simulation models based on the natural fracture characteristics of the target block reservoir was described. Finally, based on on-site investigation and experimental testing results, the simulation parameters used in this simulation were determined.
Hydraulic fracturing is a typical multi-physical field coupling process that involves fluid distribution, pore pressure, stress, displacement, and other changes under the influence of fluid injection. Therefore, the stress equilibrium process under the influence of fluid-structure coupling can be described by the following equation (Wu et al., 2018b)
where
During fracturing, the fluid pressure and flow rate in the reservoir are controlled by multiple factors such as fluid density and matrix porosity ratio. At this point, the fluid continuity equation can be described as (Dahi Taleghani et al., 2018)
where
During fracturing, there is seepage flow inside the rock in the reservoir, which conforms to Darcy’s law (Li and Ghosh, 2006)
where
During fracturing simulation, the deformation and failure of the cohesive element are used to simulate the initiation and opening of fractures. Before the fracture occurs, the stress-strain relationship of the Cohesive element satisfies the linear elastic relationship (Wu et al., 2019)
where
where
When the stress and strain of the cohesive element used to simulate hydraulic fracture and the fracture propagation reach a certain level, the element will undergo damage and failure, resulting in further extension of the fracture and a decrease in fluid pressure inside the fracture. For the convenience of simulation, this article uses the maximum principal stress criterion to determine the failure situation of the cohesive element (Wang, 2019)
where
After being damaged, the cohesive element still has a certain degree of deformation resistance, so a damage factor is introduced to describe the attenuation process of the stiffness of the damaged cohesive element. The relevant formulas can be described as (Xavier et al., 2014; Wu et al., 2018a; Wu et al., 2019)
where
Damage factors could be calculated by
where
For multi-cluster fracturing (Figure 1), the total amount of injected fluid corresponds to the total flow rate of different clusters and perforations as follows.
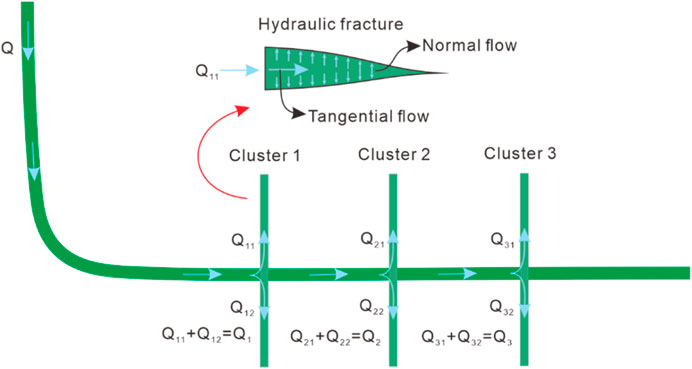
FIGURE 1. Schematic diagram of multi-cluster fracturing flow distribution.
Correspondingly, the fluid pressure drop can be expressed as
The roughness of a horizontal wellbore surface can induce pressure during fluid flow, and this pressure loss correlates with wellbore length. The relationship between frictional resistance and flow rate through the cluster can be accurately described by Bernoulli’s equation. In this study, proppant erosion on the cluster node is disregarded, allowing the utilization of Bernoulli’s equation for the perforation friction model.
where ΔP is the pressure difference at the node of the cluster, ΔZ is the elevation difference of the node, v is the fluid velocity in horizontal wellbore, ρ is the fluid density, G is the acceleration of gravity, CL is the loss coefficient, f is the friction force on the wellbore, L is the wellbore length, Ki is the loss term in fixed direction, Ks is the roughness of wellbore, Dh is the wellbore diameter, Re is the Reynolds number of the fluid in the wellbore.
In this study, the consideration of proppant erosion on the cluster node is omitted, enabling the utilization of the pressure drop model derived from Bernoulli’s equation for modeling perforation friction. (Cramer et al., 2019).
where n is the number of perforations in each cluster, in this paper, the value is 16, Dp is the perforation diameter, C is the coefficient affecting perforation flow, generally 0.56–0.9 (Modeland et al., 2011; Zhang et al., 2023), in this paper, the value is 0.6.
The initiation and expansion of fractures, simulated using cohesive elements in fracturing simulations, result in the tangential and vertical flow of fracturing fluid along these elements. Assuming the fluid behaves as an incompressible Newtonian fluid for tangential flow, we define the volume flow vector per tangential unit length.
where q represented the volume flow vector per tangential unit length; t was the thickness of a cohesive element, m; μ was the viscous coefficient of fracturing fluid in a cohesive element; p was the fluid pressure in a cohesive element, MPa.
Examining the normal flow of hydraulic fracturing fluid within fractures reveals the intricate interaction between fluid in fractures and fluid in rock blocks. This interaction can be effectively characterized by the filtration rate of fracturing fluid on both the upper and lower surfaces of the fractures. The methodology for calculating the filtration rate of fracturing fluid is
where
To conduct numerical simulation research on multi-cluster fracturing for a well in Southwest China, detailed on-site data of a well in Southwest China was consulted. The relevant description for constructing a multi-cluster fracturing simulation model is as follows: ① The reservoir near the fracturing well is divided into multiple layers, mainly consisting of gray-black shale and black shale. According to core observation statistics, there are significant natural fracture development characteristics in some layers, with a linear density of about 1.56 pieces/m and a main inclination angle of 10°–30°. Based on this, it is assumed that the research area is 60 m × 60 m, with a thickness of 3 m. ② On-site testing shows that the triaxial and triaxial principal stresses of the fractured well have a maximum horizontal stress value is about 96 MPa, a minimum horizontal stress value is about 86 MPa, and a vertical stress value is about 93 MPa. ③ According to the on-site data, triaxial compression tests were conducted. The main parameters include a temperature of 108°C, overlying rock pressure of 91.5 MPa, confining pressure of 77.8 MPa, and pore pressure of about 66.2 MPa. After experiments, the compressive strength of the fractured reservoir was obtained to be 435.3–570.71 MPa, with a Young’s modulus of 28.79–40.67 GPa and a Poisson’s ratio between 0.181 and 0.235. ④ In fact, the target block of this study is the well section that has undergone a fracturing transformation. The specific perforation segmentation is mainly as follows: during on-site construction, well sections with similar geological and engineering parameters are divided into the same fracturing section. The main length of the segmented section is designed to be 60 m, and the construction displacement is 14–18 m3/min. Regarding the perforation concept, the main body adopts 6 clusters for perforation. Due to significant construction equipment and conditions, perforation and fracturing clusters cannot be strictly controlled. Therefore, the cluster spacing should be set at 9–10 m while maintaining consistent cluster spacing as much as possible.
Based on the above on-site data description, the model settings of the constructed simulation model are as follows:
① The model size is 60 m × 60 m × 3 m, given the presence of random natural bedding in the target reservoir, and the fact that natural weakly cemented bedding is mainly present during shale reservoir fracturing. Considering that natural fractures in reservoirs usually have a certain degree of roughness, a rough discrete fracture network based on the rough discrete fracture network reconstruction method (Shi, et al., 2023) was established for natural fracture inclination angles between 10° and 30°. Subsequently, the rough discrete fracture network was imported into Abaqus software through Python scripts developed by us, and a fracturing simulation model containing a randomly distributed rough discrete fracture network was established. It is worth mentioning that on-site perforation is often limited by construction conditions and equipment, making it difficult to achieve uniform perforation. To simulate this randomness, the model directly constructed 38 perforation points based on a discrete fracture network (Table 1).
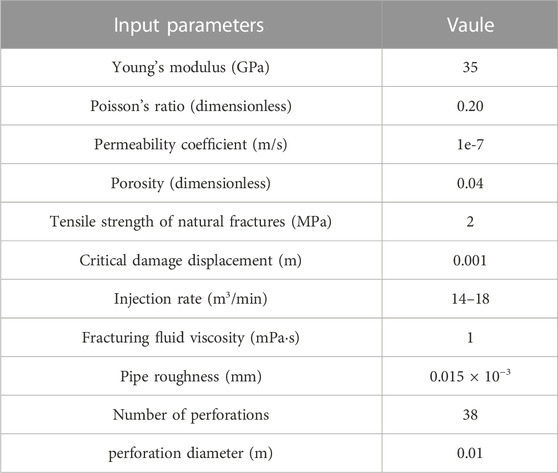
TABLE 1. Main parameters used in simulation models.
② The injected fluid flows into the reservoir after being diverted along the wellbore components. Therefore, the fp3d2 unit is used to set up a simulated wellbore located at the bottom of the reservoir area, and the fpc3d2 unit is used to simulate the friction before flowing into the reservoir. The interaction between fluid volume and fluid pressure in the simulation is achieved by binding the wellbore tip node and the reservoir interface unit node. Therefore, during single cluster fracturing, the injection point of the model is located at the endpoint of the wellbore. In addition, there is randomness in the actual on-site perforation spacing. To simulate perforation more realistically, the perforation of this model is randomly set, with a total of 38 perforation points (Figure 2B).
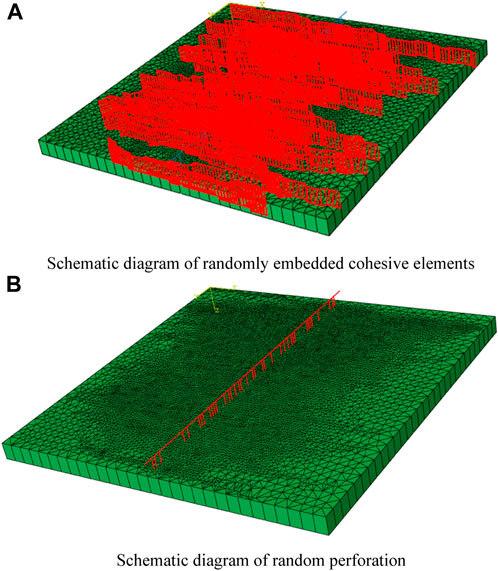
FIGURE 2. Schematic diagram of multi segment and multi-cluster fracturing model.
③ The conventional interface element method with global embedding has phenomena such as long computational time and severe local shear collapse of fractures. Therefore, the use of random modelling to form a discrete nonplanar sequence fracture network facilitates the development of multi-cluster fracturing.
④ The x direction is assumed to be the maximum horizontal principal stress direction, the z direction is assumed to be the vertical principal stress direction and the y direction is assumed to be the minimum horizontal principal stress direction. The outer boundary of the model is a fixed displacement and impermeable boundary condition, with upper and lower boundaries constraining displacement in the z direction and left and right boundaries constraining displacement in the x and y directions.
⑤ To reduce computational complexity, larger grid seeds were used for grid generation. After grid generation, the total grid size of the reservoir components was 17,105, including 13,305 rock block elements, 3,800 interface elements, and a total of 28,632 nodes. The total number of simulated wellbore elements is 115, including 38 fpc3d2 elements, 77 fp3d2 elements, and a total of 116 nodes.
Based on the geological and mechanical conditions of the target reservoir, mechanical experimental results, and on-site construction settings, the corresponding model parameters are selected. The benchmark calculation example is based on single cluster fracturing, assuming a reservoir thickness of 3 m, an injection displacement of 14 m3/min, and a total injection time of 3,600 s. Using a super hydrostatic pressure system for simulation, the stress boundary condition is effective stress. Meanwhile, the total geo-stress in the benchmark model is 96 MPa, 86 MPa, and 93 MPa, with a pore pressure of 66 MPa. Meanwhile, the constitutive parameters of cohesive units in the model refer to previous reservoir fracturing simulation studies that considered heterogeneity (Wu et al., 2022; Wu et al., 2023). In addition, the multi-cluster fracturing parameters are referenced from Zhang’s research (Zhang et al., 2023). The detailed information is shown in Table 1. Afterwards, corresponding simulation results can be obtained based on Eqs 1–14.
Compared to conventional shallow reservoir mining, deep shale reservoirs have a larger depth and therefore exist in high-stress environments. Affected by mineral distribution, there is a certain range of fluctuations in the elastic modulus of rocks in the reservoir. In addition, when using multi-cluster fracturing construction, the construction design displacement and the number of fracturing clusters usually also affect the morphological expansion of artificial fractures in the reservoir. Therefore, this section delves into the hydraulic fracture propagation law of the target block reservoir under multi-cluster fracturing construction conditions, injection rate changes, and reservoir rock Young’s modulus changes.
Referring to the calculation methods of conventional quantitative parameters in previous studies (Wu et al., 2020b; Wu et al., 2022), The conventional fracture morphology parameters (fracture area, fracture aperture at the injection point, maximum fracture aperture, fracture volume) are calculated based on the damaged cohesive element morphology, and the tensile failure ratio is obtained through MMIXDME and MMIXDMI field variables. Then, by adjusting the number of fracturing clusters to 1, 3, 6, 9, and 12, the fracturing results under different cluster and cluster spacing conditions are shown in Figure 3. From this figure, as the cluster spacing increases, the number of fracture elements and total fracture area in the simulation model show an increasing trend. It is worth mentioning that from 1 cluster fracturing to 3 clusters fracturing, the number of fracture elements and total fracture area increased significantly, followed by a smaller increase. Meanwhile, as the distance between clusters increases and the number of clusters increases, the volume of fractures in the model decreases, and the proportion of tensile failure significantly increases. This should be because single cluster fracturing is more difficult to form large-scale fractures, and the injected fluid is mainly used for fracture opening.
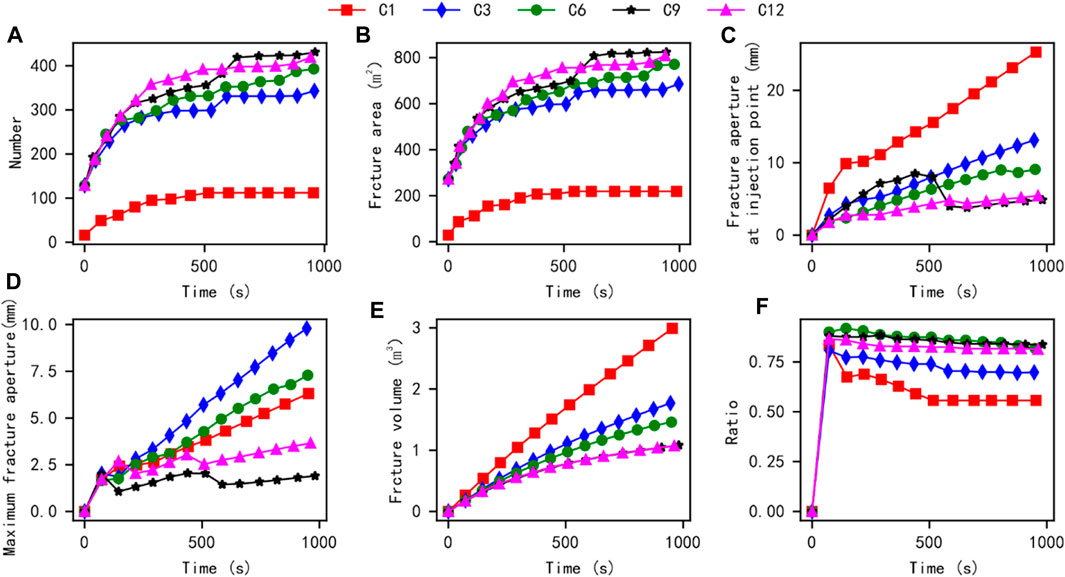
FIGURE 3. Comparison results of conventional quantization parameters under the influence of different clusters.
The statistics of the values of a certain stage in the simulation results are shown in Figure 4. In this model, as the number of clusters increases, the cluster spacing decreases. The total area of fracture fractures in the model increases, the width of injection point fractures decreases, and the total volume of visible fractures decreases. These phenomena indicate that in this simulation model, as the number of clusters increases and the spacing between clusters decreases, the model is more likely to form many fractures with small openings, resulting in an increase in the total area of fractures and a decrease in the visible fracture volume.
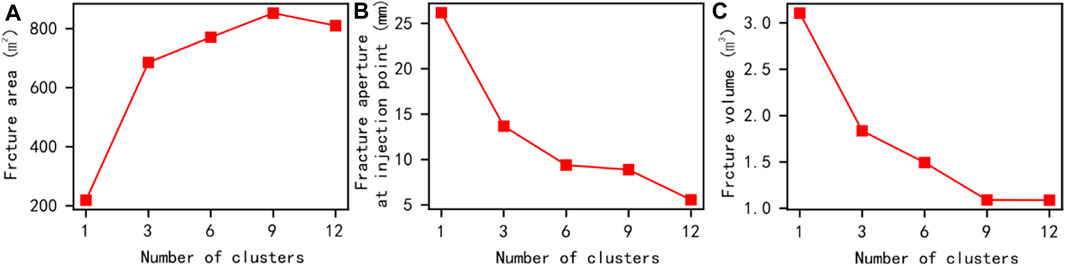
FIGURE 4. Comparison results of conventional quantization parameters under the influence of different clusters at 1000s.
The morphological evolution process of artificial fractures during single cluster and three cluster fracturing is shown in Figure 5 and Figure 6. Please note that since the width of artificial fractures is much smaller than the reservoir scale, to highlight the results of artificial fracture morphology, a 10-fold deformation scaling factor was used in both the top view and the 3D view. Under the conditions set in this model, single cluster fracturing is mainly used to form a single main fracture, and the phenomenon of fracture initiation near the wellbore is not significant. As the number of clusters increased to 3, three main slots expanded in the model, and there were both single wing and double wing expansion phenomena in the main slots. This indicates that increasing the number of fracturing clusters may be beneficial for the initiation of fractures near the wellbore, as well as for the expansion of multiple main fractures.

FIGURE 5. The process of fracture morphology changes during single cluster fracturing.

FIGURE 6. The process of fracture morphology changes during three cluster fracturing.
The artificial fracture propagation process under six and nine-cluster fracturing construction conditions is shown in Figure 7 and Figure 8. When using the construction process of 6 cluster fracturing, multiple fractures appeared near the wellbore, and 5 main fractures developed simultaneously. When using the nine-cluster fracturing construction process, there is also a phenomenon of multiple fracture initiation near the wellbore, with nearly ten main fractures developed. It is worth mentioning that the fracture morphology in the simulation results has been magnified by ten times the deformation to ensure that most of the fractured fractures can be seen. However, when using six-cluster fracturing, the main fracture path of the artificial fracture is significant. When using nine-cluster fracturing construction, the main fracture path of some artificial fractures is not continuous, indicating that there are many locally small opening fractures in the main fractures of some artificial fractures. These small opening fractures are obviously not conducive to the transportation of proppant in the reservoir and therefore are not conducive to subsequent mining.
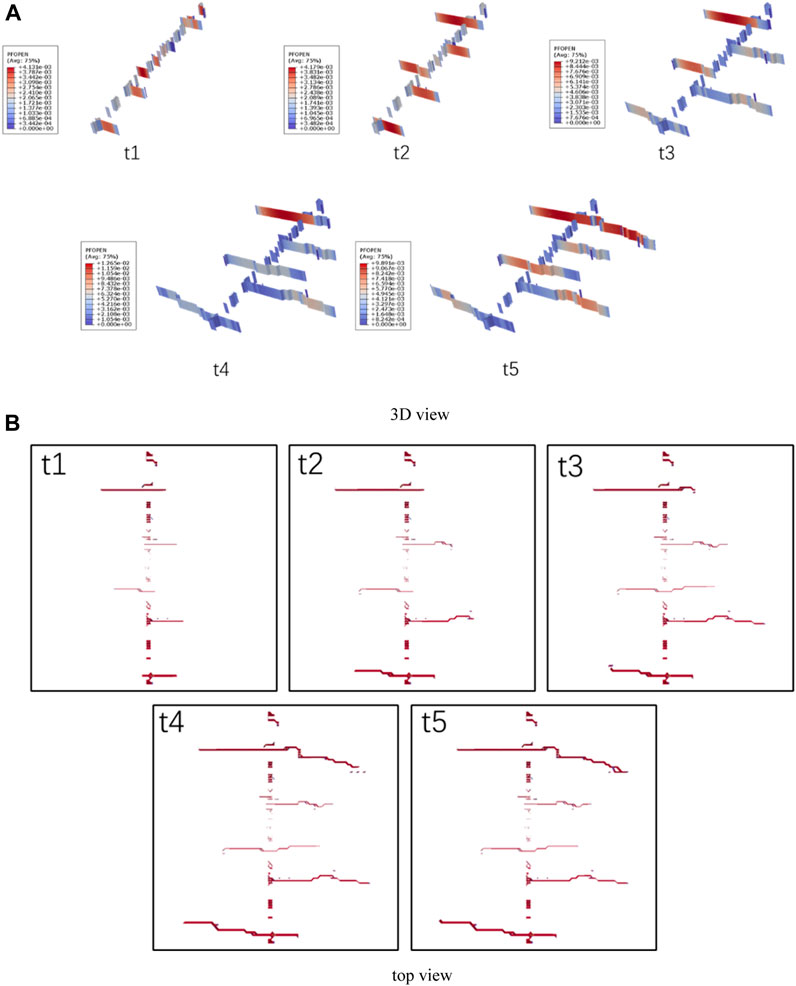
FIGURE 7. The process of fracture morphology changes during six cluster fracturing.
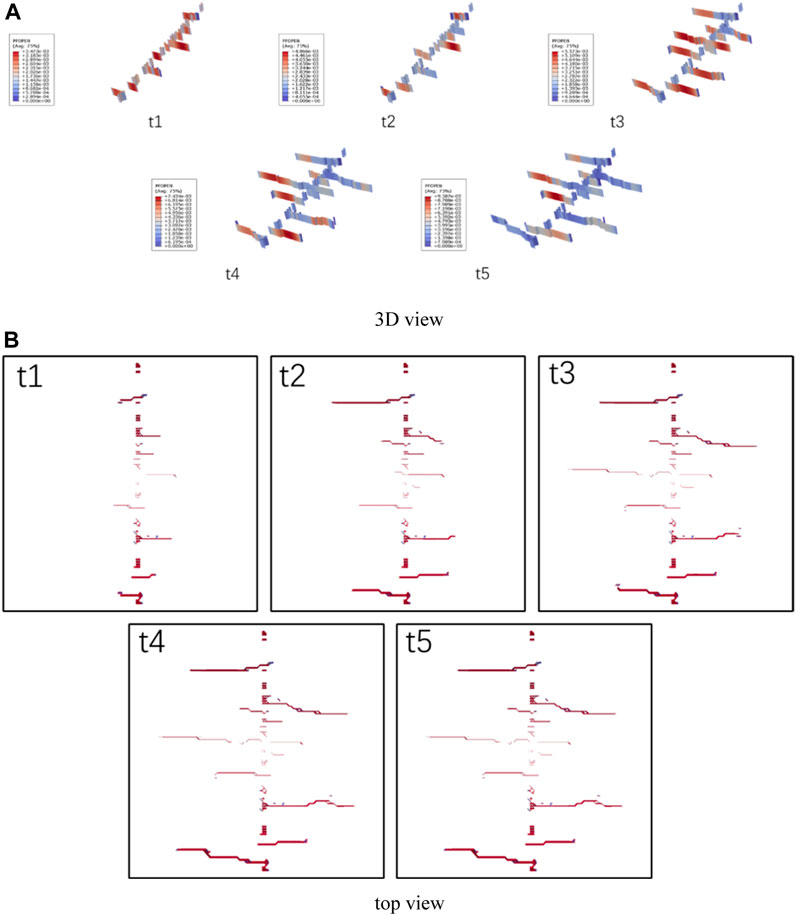
FIGURE 8. The process of fracture morphology changes during nine cluster fracturing.
The result of the twelve-cluster fracturing is shown in Figure 9. Obviously, more than twelve artificial fractures sprouted near the wellbore in the early stage of the twelve -cluster fracturing model. As the fracturing continues, there is a competitive expansion of budding fractures within each cluster in the model, resulting in some budding fractures not further opening, while others further opening. Therefore, as the fracturing continues, the number of main extended fractures in the reservoir gradually decreases, ultimately leading to the phenomenon of ten main fractures expanding one after another. Unfortunately, we can observe the fracture morphology of almost all the main fractures in the 3D view, while only some of the main fractures can be observed in the top view (five main fractures appear in the top view). These results indicate that under the conditions set in this model, the number of main fractures that are beneficial for proppant transport and later development may not increase with the increase of cluster numbers. Therefore, in the evaluation process of fracture propagation results, not only the total area of artificial fractures needs to be considered, but also factors such as the number and area of effective support fractures under the influence of the proppant ceramic particle size should be further considered.
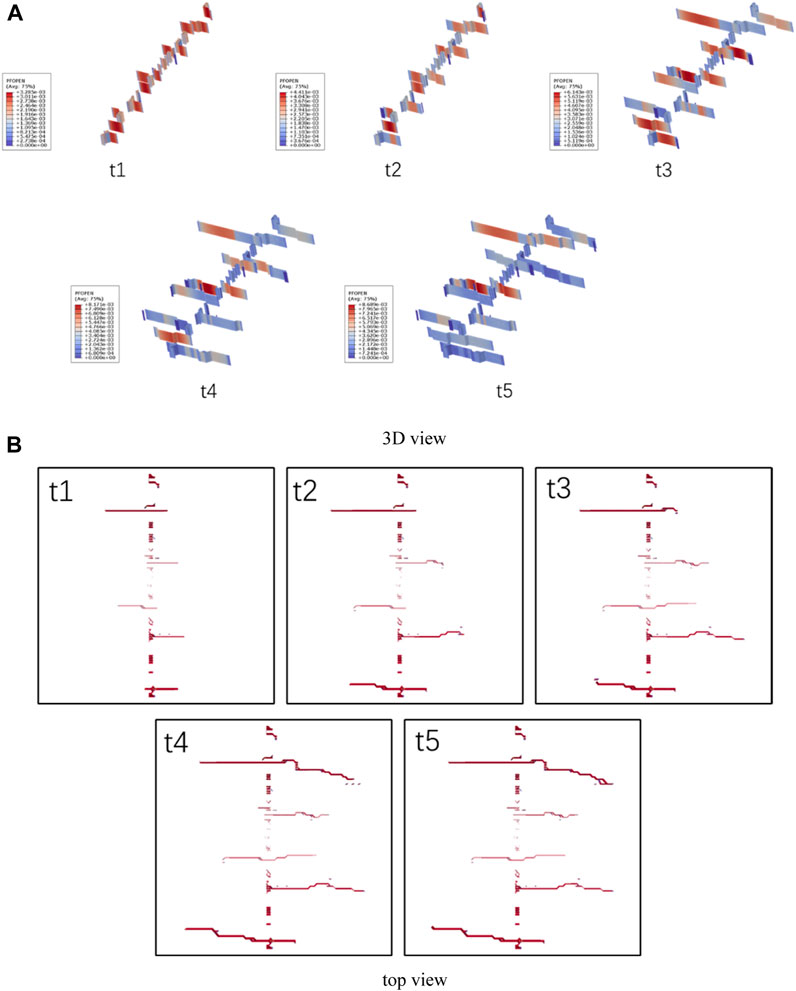
FIGURE 9. The process of fracture morphology changes during twelve cluster fracturing.
During multi-group fracturing construction, the expansion of artificial fractures is not only affected by the setting of the compression fracture group but also by the injection rate. Given that the number of fracturing clusters has a significant impact on the simulation results, this section selected single cluster and 12 cluster fracturing simulation models and obtained corresponding numerical simulation results by setting the injection rate to 14–18 m3/min.
The model parameter results under the influence of different injection rates during single cluster fracturing are shown in Figure 10. As the injection flow rate increases, the number of rupture elements in the model increases more rapidly, and the overall number of rupture elements and total rupture area in the model show an increasing trend. Meanwhile, the total volume of fractures in the model decreases, while the proportion of tensile shear failure exhibits a certain degree of dispersion. Firstly, the decrease in the total volume of fractures indicates an increase in small opening fractures, so the total volume change cannot be calculated under the resolution of model data extraction. The discreteness of the tensile shear failure ratio in the model should be due to the comprehensive influence of factors such as natural interface paths and in-situ stress during the reservoir fracturing process (Zheng et al., 2022).
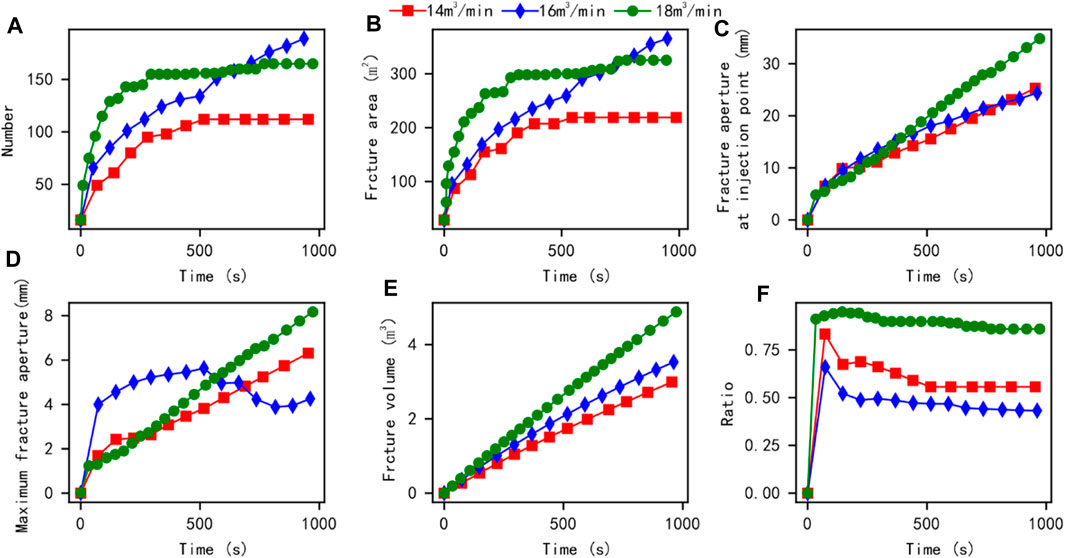
FIGURE 10. Comparison results of conventional quantitative parameters under different displacement effects during single cluster fracturing.
To analyse the influencing factors of the model, we further extracted the parameter results of the model at 1000s (Figure 11). Basically, as the displacement increases, the total area of fractures and the proportion of tensile failure in the model show a certain fluctuation, while the total volume of artificial fractures shows an increasing trend. Under the same reservoir conditions, increasing injection rate is beneficial for increasing the volume of artificial fractures. This may be to promote the expansion of the artificial main seam or to increase the opening of the main seam.
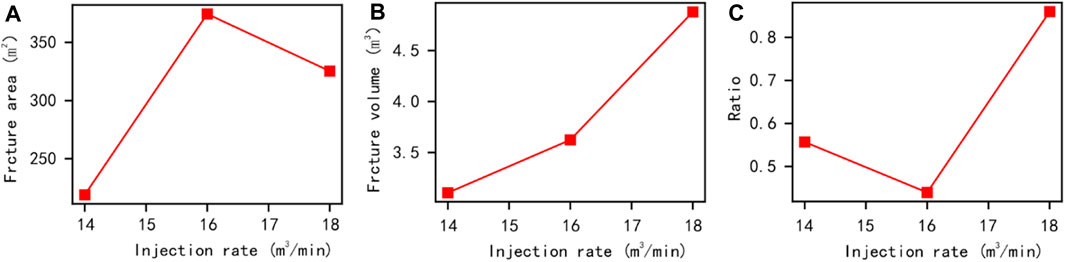
FIGURE 11. Comparison results of conventional quantitative parameters under different displacement effects (single cluster fracturing at 1000s).
To further analyse the differences in fracture morphology in the model, Figure 12 shows the development process of artificial fractures at injection rates of 16 m3/min and 18 m3/min. Given the difficulty in observing the influence of artificial fracture width in 3D views, while the overall complexity of artificial fractures is difficult to observe in 2D top views. Therefore, both a 3D view and a 2D top view are drawn in the following figure. From the following figure, when the injection rate is 16 m3/min, the fracture initiation phenomenon near the wellbore can be seen in the three-dimensional view, while it is difficult to see in the two-dimensional top view. This phenomenon indicates that under high injection fluid conditions, it may be easier to form small opening fractures, which makes it difficult to predict the initiation of fractures near the wellbore area at the extracted resolution. Meanwhile, when the injection displacement is 16 m3/min, a total of three main fractures were developed in the initial stage. As the fracturing continues, the expansion of the large main fracture is formed first, followed by the gradual expansion of the secondary main fracture, and finally, a total of two large and three small fracture expansion forms are formed, including two main fractures and three immature fractures with insufficient extension. Under this condition, using temporary plugging and repeated fracturing to further open the other three budding fractures will help further improve the effectiveness of reservoir reconstruction.
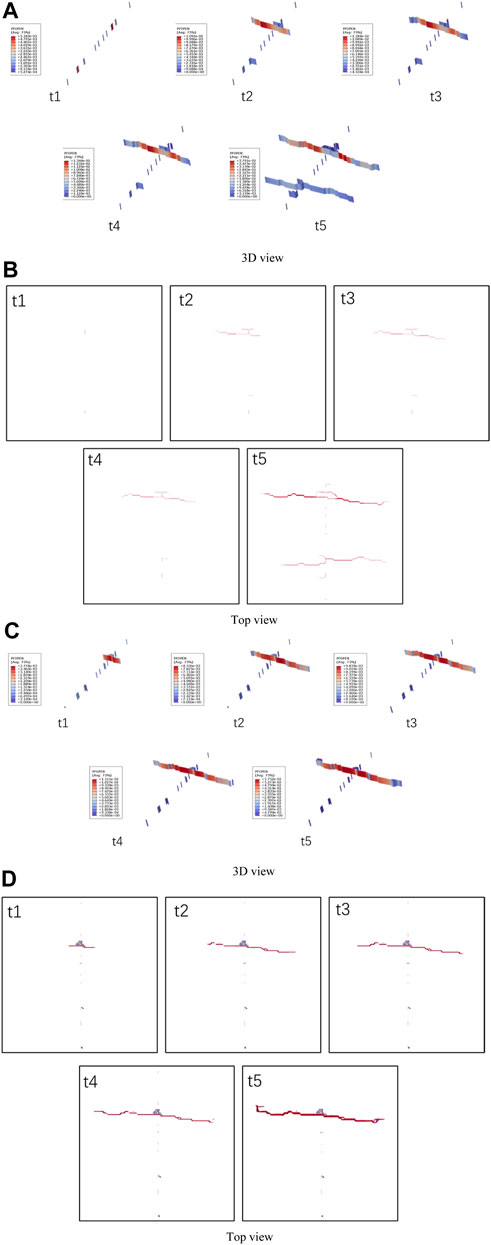
FIGURE 12. The results of fracture morphology under different displacement effects during single cluster fracturing (injection displacement of (A,B) is 16 m3/min, and injection displacement of (C,D) d is 18 m3/min).
Like the simulation results when the injection rate is 16 m3/min, the fracture initiation phenomenon near the wellbore can be seen in the 3D view, while it is difficult to see in the 2D top view. This phenomenon indicates that under high injection fluid conditions, it may be easier to form small opening fractures, which makes it difficult to predict the initiation of fractures near the wellbore area at the extracted resolution. At the same time, under the conditions of this model, when the injection rate is 18m3/min, one main fracture developed initially, and local collapse and fracture phenomenon occurred near the main fracture. As the fracturing continued, this one main fracture further extended, while no other initiation fractures were observed. This phenomenon indicates that during reservoir fracturing, if there is a dense rupture of micro seismic data near a certain perforation, it may be necessary to temporarily block the area near the perforation after the fracturing to fully fracture other areas and improve the effectiveness of reservoir reconstruction.
Further extraction of model parameter results under the influence of different injection displacement during twelve-clusters of fracturing was conducted to significantly compare the differences in the effects of different displacement, as shown in Figures 13, 14. From this figure, as the injection flow rate increases, the number of rupture elements in the model increases more rapidly, and the overall number of rupture elements and total rupture area in the model show an increasing trend. Meanwhile, the total volume of fractures in the model increases, while the proportion of tensile shear failure shows a decreasing trend. Compared to the simulation results of single cluster fracturing, the conventional quantitative parameters in the model have more regularity. The above phenomenon can indicate that with the development of multi-cluster fracturing, the qualitative and quantitative trend of displacement for artificial fracture fracturing in reservoirs will be more regular.

FIGURE 13. Comparison results of conventional quantitative parameters under the influence of different displacement during twelve-cluster fracturing.

FIGURE 14. Comparison results of conventional quantitative parameters under the influence of different displacement during twelve-cluster fracturing (1000s).
Figure 15 shows the development process of artificial fractures under twelve-cluster fracturing conditions with injection rates of 16 m3/min and 18 m3/min. When the injection rate is 16 m3/min, the 3D view shows the phenomenon of fracture initiation near the wellbore. Compared to the results of single cluster fracturing, the two-dimensional top view also more significantly shows the phenomenon of artificial fracture initiation near the wellbore of the reservoir. Meanwhile, when the injection displacement is 16 m3/min, many budding fractures develop in the initial stage. As the fracturing continues, the expansion of the large main fracture is formed first, followed by the gradual expansion of the secondary main fracture, and finally ten main fractures are formed. As the fluid injection displacement increases, the number of main fractures in the model increases to eleven.
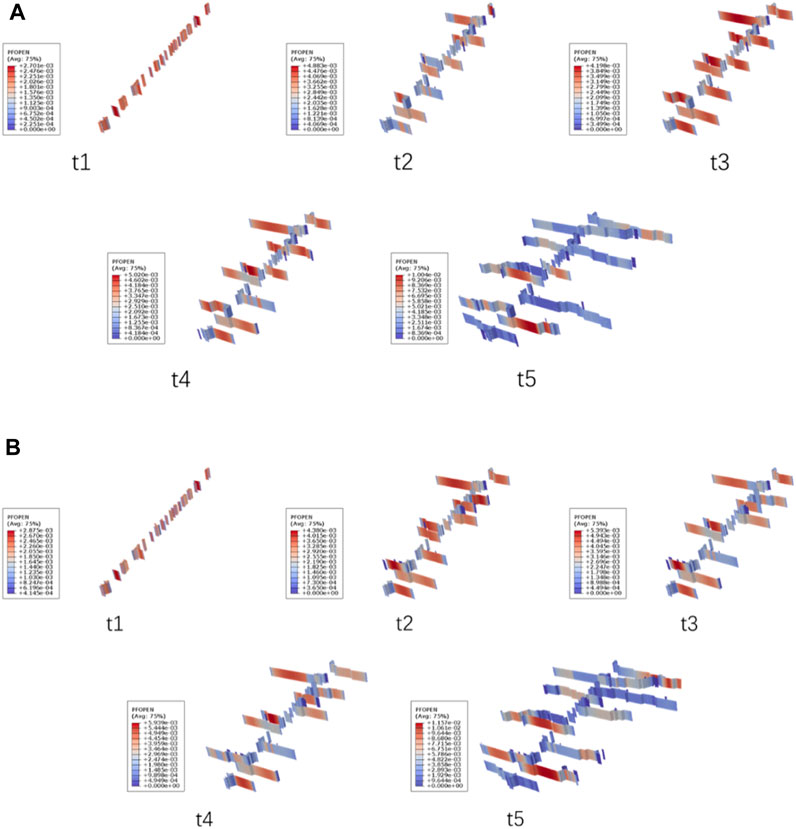
FIGURE 15. The results of fracture morphology under the influence of different displacement during twelve-cluster fracturing (injection displacement of a is 16 m3/min, and injection displacement of b is 18 m3/min).
Numerous studies have shown that Young’s modulus of rocks significantly affects the effectiveness of reservoir fracturing (Wu et al., 2020a; Wu et al., 2022), and on-site testing shows that the elastic modulus of the reservoir is about 30–40 GPa. Therefore, to explore the differences in fracturing transformation effects in different Young’s modulus areas of the target block using multi-cluster fracturing construction. By adjusting Young’s modulus to 30, 35, and 40 GPa, different simulation results of twelve cluster fracturing models were obtained, and the corresponding changes in conventional quantitative parameters are shown in Figure 16 and Figure 17. The number of interface unit fractures in the simulation model and the fracture area of artificial fractures in the reservoir show certain fluctuations under the influence of Young’s modulus, and the difference in influence is limited. Meanwhile, when Young’s modulus of reservoir rock decreases, the fracture width at the injection point in the centre of the model and the artificial fracture width generated by the overall model may show an increasing trend, while the total volume of the fracture may show a certain decreasing trend, resulting in a decrease in the proportion of artificial fractures caused by tensile failure. This phenomenon indicates that the change in Young’s modulus in the area near the fracturing well affects the effectiveness of reservoir reconstruction but is not significantly affected by the constraints of the target area’s geo-stress and multi-cluster fracturing construction.
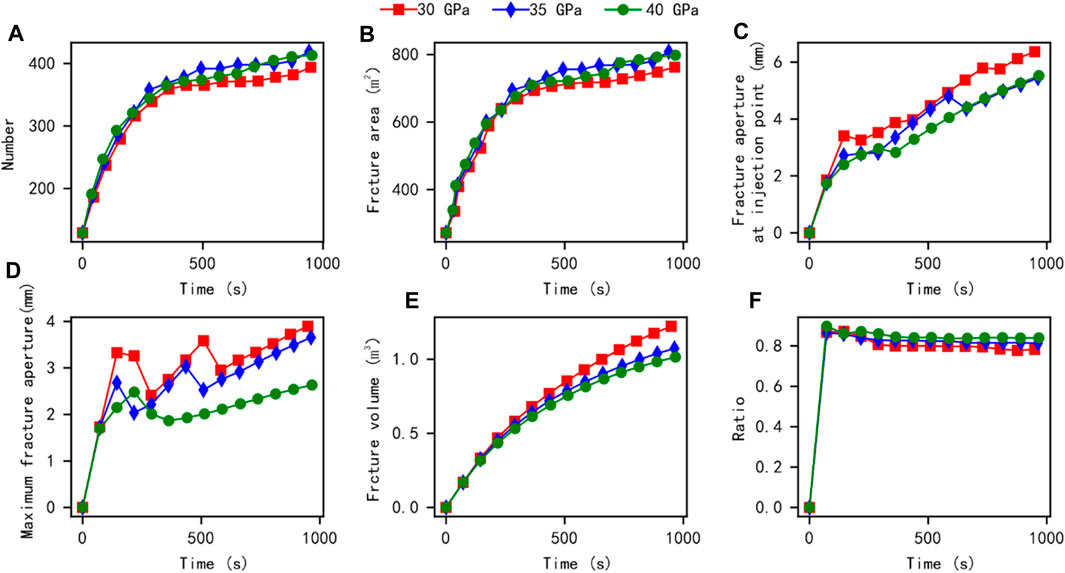
FIGURE 16. Comparison results of conventional quantitative parameters under different displacement effects during twelve cluster fracturing.
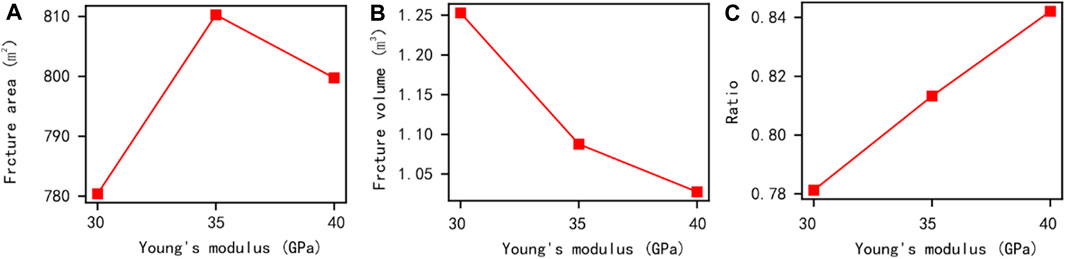
FIGURE 17. Comparison results of conventional quantitative parameters under different displacement effects during twelve cluster fracturing (1000s).
The results of artificial fracture morphology changes when Young’s modulus is 30GPa and 40 GPa are shown in Figure 18. Figures 18A–C show that as Young’s modulus of reservoir rocks changes, the artificial fractures in the reservoir are still mainly extended by multiple clusters of main fractures due to the influence of high ground stress difference, and the extended main fractures are mainly in a single wing expansion mode. It is worth noting that under low Young’s modulus conditions, the fracture morphology is not significant in the top view of the model (Figure 18B), while under high Young’s modulus conditions, the artificial fracture morphology in the reservoir is more significant. This is because the width of the fractures formed in the reservoir is usually small, on the millimetres scale. Therefore, it is usually difficult to display relative to the reservoir. For this reason, the simulation results have magnified the deformation by ten times. Unfortunately, under low Young’s modulus conditions, it is still difficult to observe obvious artificial fractures from the top view, while under high Young’s modulus conditions, obvious artificial fractures can be observed from the top view. Therefore, fracturing in reservoirs with high Young’s modulus of rocks may be more conducive to the formation of large opening fractures, which is beneficial for proppant support and subsequent mining.
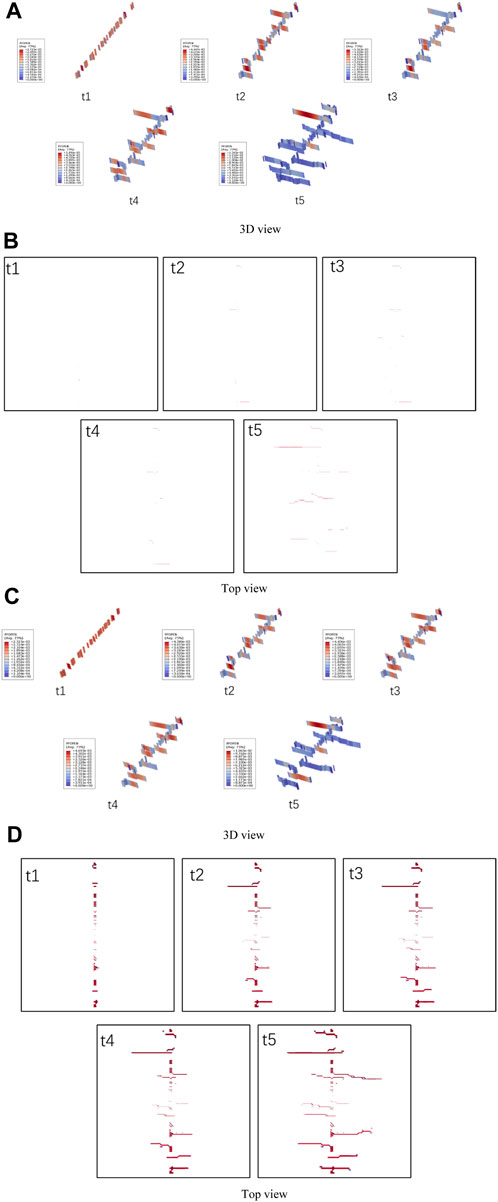
FIGURE 18. The results of fracture morphology under the influence of different Young’s moduli during twelve-cluster fracturing (the Young’s moduli of (A,B) are 30 GPa, and the Young’s moduli of (C,D) are 40 GPa).
Considering the relevant geological parameters of a certain reservoir in the southwest, this paper establishes a 3D multi-cluster reservoir fracturing model based on cohesive element modeling. Then, the propagation law of artificial fractures in reservoirs under the influence of the different number of fracturing clusters, injection displacement, and Young’s modulus in different regions of the 60 m fracturing well section is analyzed, and the quantitative law of parameters such as fracture length, maximum fracture width, injection point fracture width, fracture area, and tensile failure ratio during multi-cluster fracturing construction, as well as the propagation law of fracture morphology are revealed.
(1) As the number of clusters increases, the distance between clusters decreases. The total area of fracture fractures in the model increases (nearly 4 times), the width of injection point fractures decreases, and the total volume of visible fractures decreases. These phenomena indicate that in this simulation model, as the number of clusters increases and the spacing between clusters decreases, the model is more likely to form many fractures with small openings, resulting in an increase in the total area of fractures and a decrease in the visible fracture volume.
(2) During single cluster fracturing, as the injection flow rate increases, the number of fracture elements in both single cluster fracturing and multi-cluster fracturing models increases more rapidly, and the overall number of fracture elements and total fracture area in the model show an increasing trend ((nearly 1 time)). It is worth mentioning that the proportion of tensile shear failure in the single cluster model exhibits a certain degree of dispersion, while the conventional quantitative parameters in the multi-cluster fracturing model are more regular. The above phenomenon indicates that with the development of multi-cluster fracturing, the qualitative and quantitative trend of displacement for artificial fracture fracturing in reservoirs will be more regular.
(3) Under the influence of Young’s modulus, the number of damaged cohesive elements in the simulation model and the fracture area of artificial fractures in the reservoir exhibit certain fluctuations, and the difference is limited under the comprehensive influence of in-situ stress and other factors. Meanwhile, when Young’s modulus of reservoir rock decreases, the fracture width at the injection point in the center of the model and the artificial fracture width generated by the overall model may show an increasing trend, while the total volume of the fracture may show a certain decreasing trend, resulting in a decrease in the proportion of artificial fractures caused by tensile failure.
The raw data supporting the conclusions of this article will be made available by the authors, without undue reservation.
JW: Conceptualization, Investigation, Project administration, Supervision, Writing–review and editing. MW: Investigation, Methodology, Writing–original draft. YG: Investigation, Project administration, Writing–review and editing. HH: Conceptualization, Data curation, Investigation, Project administration, Resources, Supervision, Writing–review and editing. ZZ: Investigation, Supervision, Writing–review and editing. GZ: Resources, Supervision, Writing–review and editing. JG: Resources, Supervision, Writing–review and editing. JL: Funding acquisition, Investigation, Writing–review and editing.
The author(s) declare financial support was received for the research, authorship, and/or publication of this article. The authors gratefully acknowledge the financial support given by Open Research Fund of State Key Laboratory of Geomechanics and Geotechnical Engineering, Institute of Rock and Soil Mechanics, Chinese Academy of Sciences, Grant NO SKLGME022020, and Hubei Provincial Natural Science Foundation (Grant No. 2022CFB400).
Authors JW, HH, ZZ, GZ, and JG were employed by Shale Gas Research Institute of PetroChina Southwest Oil and Gas Field Company.
The remaining authors declare that the research was conducted in the absence of any commercial or financial relationships that could be construed as a potential conflict of interest.
All claims expressed in this article are solely those of the authors and do not necessarily represent those of their affiliated organizations, or those of the publisher, the editors and the reviewers. Any product that may be evaluated in this article, or claim that may be made by its manufacturer, is not guaranteed or endorsed by the publisher.
Bai, Y., Hu, Y., Liao, X., Tan, J., Zheng, Y., and Wang, W. (2023). Research on the influence of stress on the penetration behavior of hydraulic fracture: perspective from failure type of beddings. Front. Earth Sci. 11. doi:10.3389/feart.2023.1163295
Britt, L. K., Hager, C. J., and Thompson, J. W. (1994). “Hydraulic fracturing in a naturally fractured reservoir,” in International Petroleum Conference and Exhibition of Mexico.
Casas, L., Miskimins, J. L., Black, A., and Green, S. (2006). “Laboratory hydraulic fracturing test on a rock with artificial discontinuities, ” in Paper presented at the SPE Annual Technical Conference and Exhibition, San Antonio, TX, September 2006. doi:10.2118/103617-MS
Cramer, D., Friehauf, K., Roberts, G., and Whittaker, J. (2019). “Investigating near-wellbore diversion methods for refracturing horizontal wells,” in SPE Hydraulic Fracturing Technology Conference and Exhibition D031S007R001.
Dahi Taleghani, A., Gonzalez-Chavez, M., Yu, H., and Asala, H. (2018). Numerical simulation of hydraulic fracture propagation in naturally fractured formations using the cohesive zone model. J. Petroleum Sci. Eng. 165, 42–57. doi:10.1016/j.petrol.2018.01.063
Huang, L., Dontsov, E., Fu, H., Lei, Y., Weng, D., and Zhang, F. (2022). Hydraulic fracture height growth in layered rocks: perspective from DEM simulation of different propagation regimes. Int. J. Solids Struct. 238, 111395. doi:10.1016/j.ijsolstr.2021.111395
Huang, L., Liu, J., Zhang, F., Dontsov, E., and Damjanac, B. (2019). Exploring the influence of rock inherent heterogeneity and grain size on hydraulic fracturing using discrete element modeling. Int. J. Solids Struct. 176-177, 207–220. doi:10.1016/j.ijsolstr.2019.06.018
Huang, L., Tan, J., Fu, H., Liu, J., Chen, X., Liao, X., et al. (2023). The non-plane initiation and propagation mechanism of multiple hydraulic fractures in tight reservoirs considering stress shadow effects. Eng. Fract. Mech. 292, 109570. doi:10.1016/j.engfracmech.2023.109570
Huang, N., Liu, R., Jiang, Y., and Cheng, Y. (2021). Development and application of three-dimensional discrete fracture network modeling approach for fluid flow in fractured rock masses. J. Nat. Gas Sci. Eng. 91, 103957. doi:10.1016/j.jngse.2021.103957
Ju, Y., Liu, P., Chen, J., Yang, Y., and Ranjith, P. G. (2016). CDEM-based analysis of the 3D initiation and propagation of hydrofracturing cracks in heterogeneous glutenites. J. Nat. Gas Sci. Eng. 35, 614–623. doi:10.1016/j.jngse.2016.09.011
Li, S., Fan, Y., He, T., Yang, J., Li, J., and Wang, X. (2023). Research and performance optimization of carbon dioxide foam fracturing fluid suitable for shale reservoir. Front. Energy Res. 11. doi:10.3389/fenrg.2023.1217467
Li, S., and Ghosh, S. (2006). Multiple cohesive crack growth in brittle materials by the extended Voronoi cell finite element model. Int. J. Fract. 141 (3-4), 373–393. doi:10.1007/s10704-006-9000-2
Liu, C., Jin, X., Shi, F., Lu, D., Liu, H., and Wu, H. (2018a). Numerical investigation on the critical factors in successfully creating fracture network in heterogeneous shale reservoirs. J. Nat. Gas Sci. Eng. 59, 427–439. doi:10.1016/j.jngse.2018.09.019
Liu, C., Zhang, D., Zhao, H., Li, M., and Song, Z. (2021). Experimental study on hydraulic fracturing properties of elliptical boreholes. Bull. Eng. Geol. Environ. 81 (1), 18. doi:10.1007/s10064-021-02531-9
Liu, Q., Sun, L., Liu, P., and Chen, L. (2018b). Modeling simultaneous multiple fracturing using the combined finite-discrete element method. Geofluids, 1–20. doi:10.1155/2018/4252904
Luo, H., Xie, J., Huang, L., Wu, J., Shi, X., Bai, Y., et al. (2022). Multiscale sensitivity analysis of hydraulic fracturing parameters based on dimensionless analysis method. Lithosphere 2022 (12), 9708300. doi:10.2113/2022/9708300
Ma, Y., Wang, D., and Zheng, Y. (2023). Influence of the bedding plane on the propagation of multiple hydraulic fractures. Front. Earth Sci. 10. doi:10.3389/feart.2022.1077652
Modeland, N., Buller, D., and Chong, K. K. (2011). “Statistical analysis of the effect of completion methodology on production in the haynesville shale,” in North American Unconventional Gas Conference and Exhibition SPE-144120-MS.
Moghadasi, R., Rostami, A., and Hemmati-Sarapardeh, A. (2019). Application of nanofluids for treating fines migration during hydraulic fracturing: experimental study and mechanistic understanding. Adv. Geo-Energy Res. 3 (2), 198–206. doi:10.26804/ager.2019.02.09
Qiu, G., Chang, X., Li, J., Guo, Y., Wang, L., Ma, H., et al. (2023). Study on rock brittleness characteristics of deep volcanic reservoir under different confining pressures. J. Petroleum Explor. Prod. Technol. doi:10.1007/s13202-023-01717-z
Réthoré, J., de Borst, R., and Abellan, M.-A. (2008). A two-scale model for fluid flow in an unsaturated porous medium with cohesive cracks. Comput. Mech. 42 (2), 227–238. doi:10.1007/s00466-007-0178-6
Rougier, E., Munjiza, A., Lei, Z., Chau, V. T., Knight, E. E., Hunter, A., et al. (2019). The combined plastic and discrete fracture deformation framework for finite-discrete element methods. Int. J. Numer. Methods Eng. 121, 1020–1035. doi:10.1002/nme.6255
Salimzadeh, S., and Khalili, N. (2015). A three-phase XFEM model for hydraulic fracturing with cohesive crack propagation. Comput. Geotechnics 69, 82–92. doi:10.1016/j.compgeo.2015.05.001
Shang, D., Yin, G., Zhao, Y., Deng, B., Liu, C., Kang, X., et al. (2018). Local asymmetric fracturing to construct complex fracture network in tight porous reservoirs during subsurface coal mining: an experimental study. J. Nat. Gas Sci. Eng. 59, 343–353. doi:10.1016/j.jngse.2018.09.005
Sharafisafa, M., Aliabadian, Z., Sato, A., and Shen, L. (2023). Combined finite-discrete element modelling of hydraulic fracturing in reservoirs with filled joints. Geoenergy Sci. Eng. 228, 212025. doi:10.1016/j.geoen.2023.212025
Shi, D., Li, L., Guo, Y., Liu, J., Tang, J., Chang, X., et al. (2023). Estimation of rough fracture network permeability using fractal and topology theories. Gas Sci. Eng. 116, 205043. doi:10.1016/j.jgsce.2023.205043
Shi, F., Wang, D., and Li, H. (2022). An XFEM-based approach for 3D hydraulic fracturing simulation considering crack front segmentation. J. Petroleum Sci. Eng. 214, 110518. doi:10.1016/j.petrol.2022.110518
Wang, H. (2019). Hydraulic fracture propagation in naturally fractured reservoirs: complex fracture or fracture networks. J. Nat. Gas Sci. Eng. 68, 102911. doi:10.1016/j.jngse.2019.102911
Wang, L., Zhou, J., Guo, Y., Song, X., and Guo, W. (2022). Laboratory investigation and evaluation of the hydraulic fracturing of marine shale considering multiple geological and engineering factors. Front. Earth Sci. 10. doi:10.3389/feart.2022.952655
Wang, W., Zhao, P., Liao, Y., Zhang, Y., Peng, J., Xian, H., et al. (2023). Investigating fracture initiation and propagation in deep buried shale due to thermal shock: a numerical approach. Front. Energy Res. 11. doi:10.3389/fenrg.2023.1231958
Wei, W., Cai, J. C., Hu, X. Y., and Han, Q. (2015). An electrical conductivity model for fractal porous media. Geophys Res. Lett. 42 (12), 4833–4840. doi:10.1002/2015gl064460
Wu, M., Gao, K., Liu, J., Song, Z., and Huang, X. (2022). Influence of rock heterogeneity on hydraulic fracturing: a parametric study using the combined finite-discrete element method. Int. J. Solids Struct. 234-235, 111293. doi:10.1016/j.ijsolstr.2021.111293
Wu, M., Jiang, C., Song, R., Liu, J., Li, M., Liu, B., et al. (2023). Comparative study on hydraulic fracturing using different discrete fracture network modeling: insight from homogeneous to heterogeneity reservoirs. Eng. Fract. Mech. 284, 109274. doi:10.1016/j.engfracmech.2023.109274
Wu, M., Liu, J., Lv, X., Shi, D., and Zhu, Z. (2018a). A study on homogenization equations of fractal porous media. J. Geophys. Eng. 15 (6), 2388–2398. doi:10.1088/1742-2140/aac4c1
Wu, M., Wang, W., Zhang, D., Deng, B., Liu, S., Lu, J., et al. (2020a). The pixel crack reconstruction method: from fracture image to crack geological model for fracture evolution simulation. Constr. Build. Mater., 121733. doi:10.1016/j.conbuildmat.2020.121733
Wu, M. Y., Zhang, D. M., Wang, W. S., Li, M. H., Liu, S. M., Lu, J., et al. (2020b). Numerical simulation of hydraulic fracturing based on two-dimensional surface fracture morphology reconstruction and combined finite-discrete element method. J. Nat. Gas Sci. Eng. 82, 103479. doi:10.1016/j.jngse.2020.103479
Wu, Z., Sun, H., and Wong, L. N. Y. (2019). A cohesive element-based numerical manifold method for hydraulic fracturing modelling with voronoi grains. Rock Mech. Rock Eng. 52 (7), 2335–2359. doi:10.1007/s00603-018-1717-5
Wu, Z., Xu, X., Liu, Q., and Yang, Y. (2018b). A zero-thickness cohesive element-based numerical manifold method for rock mechanical behavior with micro-Voronoi grains. Eng. Analysis Bound. Elem. 96, 94–108. doi:10.1016/j.enganabound.2018.08.005
Xavier, J., Oliveira, M., Morais, J., and De Moura, M. (2014). Determining mode II cohesive law of Pinus pinaster by combining the end-notched flexure test with digital image correlation. Constr. Build. Mater. 71, 109–115. doi:10.1016/j.conbuildmat.2014.08.021
Xiang, J., Munjiza, A., Latham, J.-P., and Guises, R. (2009). On the validation of DEM and FEM/DEM models in 2D and 3D. Eng. Comput. 26 (6), 673–687. doi:10.1108/02644400910975469
Yan, C., Jiao, Y.-Y., and Zheng, H. (2018). A fully coupled three-dimensional hydro-mechanical finite discrete element approach with real porous seepage for simulating 3D hydraulic fracturing. Comput. Geotechnics 96, 73–89. doi:10.1016/j.compgeo.2017.10.008
Yang, H., Wang, L., Yang, C., Guo, W., Bi, Z., and Guo, Y. (2023a). Experimental investigation on different effects of fracturing fluids on mechanical properties and failure mechanism of continental shale. Int. J. Rock Mech. Min. 164, 105362. doi:10.1016/j.ijrmms.2023.105362
Yang, R., Wang, Y., Song, G., and Shi, Y. (2023b). Fracturing and thermal extraction optimization methods in enhanced geothermal systems. Adv. Geo-Energy Res. 9 (2), 136–140. doi:10.46690/ager.2023.08.07
Yuan, J., Jiang, R., and Zhang, W. (2018). The workflow to analyze hydraulic fracture effect on hydraulic fractured horizontal well production in composite formation system. Adv. Geo-Energy Res. 2 (3), 319–342. doi:10.26804/ager.2018.03.09
Zhang, H., Chen, J., Li, Z., Hu, H., and Mei, Y. (2023). Numerical simulation of multi-cluster fracturing using the triaxiality dependent cohesive zone model in a shale reservoir with mineral heterogeneity. Rock Mech. Rock Eng. doi:10.1007/s00603-023-03527-5
Zhao, L. H., Zhang, S. H., Huang, D. L., Zuo, S., and Li, D. J. (2018). Quantitative characterization of joint roughness based on semivariogram parameters. Int. J. Rock Mech. Min. 109, 1–8. doi:10.1016/j.ijrmms.2018.06.008
Zheng, Y., He, R., Huang, L., Bai, Y., Wang, C., Chen, W., et al. (2022). Exploring the effect of engineering parameters on the penetration of hydraulic fractures through bedding planes in different propagation regimes. Comput. Geotechnics 146, 104736. doi:10.1016/j.compgeo.2022.104736
Keywords: multi-cluster fracturing, deep shale, cohesive element modeling, high geo-stress, fracture propagation
Citation: Wu J, Wu M, Guo Y, Huang H, Zhang Z, Zhong G, Gui J and Lu J (2024) Study on multi-cluster fracturing simulation of deep reservoir based on cohesive element modeling. Front. Energy Res. 11:1339895. doi: 10.3389/fenrg.2023.1339895
Received: 17 November 2023; Accepted: 13 December 2023;
Published: 05 January 2024.
Edited by:
Liuke Huang, Southwest Petroleum University, ChinaReviewed by:
Xiaohua Wang, Tongji University, ChinaCopyright © 2024 Wu, Wu, Guo, Huang, Zhang, Zhong, Gui and Lu. This is an open-access article distributed under the terms of the Creative Commons Attribution License (CC BY). The use, distribution or reproduction in other forums is permitted, provided the original author(s) and the copyright owner(s) are credited and that the original publication in this journal is cited, in accordance with accepted academic practice. No use, distribution or reproduction is permitted which does not comply with these terms.
*Correspondence: Haoyong Huang, aHVhbmdfaHlAcGV0cm9jaGluYS5jb20uY24=
Disclaimer: All claims expressed in this article are solely those of the authors and do not necessarily represent those of their affiliated organizations, or those of the publisher, the editors and the reviewers. Any product that may be evaluated in this article or claim that may be made by its manufacturer is not guaranteed or endorsed by the publisher.
Research integrity at Frontiers
Learn more about the work of our research integrity team to safeguard the quality of each article we publish.