 Tao Lang
 Chen Ni
 Keqiang Chen
 Enxiang Xu
 Desheng Zhang
- Research Center of Fluid Machinery Engineering and Technology, Jiangsu University, Zhenjiang, China
The performance and operational stability of non-clogging pumps can be affected by cavitation. To accurately identify the cavitation state of the non-clogging pump and provide technical references for monitoring its operation, a study was conducted on the optimization of Elman neural networks for cavitation monitoring and identification using the Improved Lévy Flight Bat Algorithm (ILBA) on the basis of the traditional Bat Algorithm (BA). The ILBA employs multiple bats to interact and search for targets and utilizes the local search strategy of Lévy flight, effectively avoiding local minima by taking advantage of the non-uniform random walk characteristics of large jumps. The ILBA algorithm demonstrates superior performance compared to other traditional algorithms through simulation testing and comparative calculations with eight benchmark test functions. On this basis, the optimization of the weights and thresholds of the Elman neural network was carried out by the improved bat algorithm. This leads to an enhancement in the accuracy of the neural network for identifying and classifying cavitation data, and the establishment of the ILBA-Elman cavitation diagnosis model was achieved. Collect pressure pulsation signals at the tongue of the non-clogging pump volute through cavitation tests. Through the cavitation feature extraction method based on Variational Mode Decomposition (VMD) and Multi-scale Dispersion Entropy (MDE), the interference signal can be effectively suppressed and the complexity of the time series can be measured from multiple angles, thereby creating a cavitation feature data set. The improved cavitation diagnosis model (ILBA-Elman) can realize the effective identification of the cavitation characteristics of non-clogging pumps through a variety of algorithm comparison experiments.
1 Introduction
The centrifugal non-clogging pumps are essential components for offshore oil platform production and fire protection. Due to the high sediment content in seawater, ocean currents can also stir up sand, gravel, aquatic vegetation, and various suspended solids from the seabed. Single-blade centrifugal non-clogging pumps offer excellent passage capacity, wear resistance, and high efficiency. They provide reliable support for tasks on oil platforms, including seawater cleaning, well maintenance, fire sprinkler systems, and sewage treatment (Noon et al., 2021; Li et al., 2023; Quan et al., 2021). The non-clogging pump is characterized by strong conveying capacity, wear resistance, and high efficiency. In actual operation, the non-clogging pump may experience cavitation due to improper selection, harsh operating environments, and poor ability to resist cavitation (Kan et al., 2022). When the temperature remains constant in the hydraulic machinery, a significant drop in internal liquid pressure beyond a critical point leads to the formation of numerous vapor bubbles. These bubbles flow along with the liquid and continuously spread within the passage. Upon reaching the high-pressure region, the bubbles rapidly collapse under the high pressure. This collapse creates voids in the original bubble positions, and the surrounding water rushes in, generating a substantial impact force that damages the impeller and the wall (Siano and Panza, 2018; Rauf et al., 2020; Li et al., 2022; Lang et al., 2023). To prevent pump damage from cavitation, timely recognition and warning of cavitation states are crucial. Kumar et al. (2017) employed various analysis methods to extract feature values and used automated algorithms to adjust the support vector machine penalty factor, enhancing the accuracy of centrifugal pump cavitation recognition. Neill et al. (1997) used acoustic emission sensors to collect data signals from cavitation and normal pump operation, concluding that bubble collapse leads to higher amplitude and frequency in sound signals. Lu et al. (2022) defined a dimensionless parameter of power ratio r, which divides the vibration power in 1,200–1,400 Hz by the vibration power in 0–200 Hz, to judge the cavitation occurrence. Pressure pulsation and electrical measurements are methods that can detect the cavitation state, but each has advantages and disadvantages. Currently, researches are mainly focused on acoustic and pressure pulsation methods, which allow relatively convenient and intuitive state recognition using test instruments (Lang et al., 2022). The original test signal collected contains a lot of effective information that cannot be used directly. It is necessary to extract the features of the original signal through signal processing methods. The primary feature extraction methods include time-domain, frequency-domain, and time-frequency-domain methods. Azizi et al. (2017) used a hybrid feature selection technique involving empirical mode decomposition and generalized regression neural network to enhance cavitation recognition accuracy.
The Bat Algorithm (BA) was a metaheuristic algorithm created by Yang in 2010 based on swarm intelligence theory. This algorithm imitates bats in nature to search for prey through echolocation. It has the advantages of simple structure, few parameters, and strong stability. Therefore, it has been widely used in fields such as function optimization and pattern recognition (Yang and He, 2013). Eskandari and Seifaddini (2023) proposed a hybrid binary bat particle swarm optimization algorithm to improve the ability to converge to global optimal solutions. Cui et al. (2019) designed two new variants based on Principal Component Analysis, using the golden section method to determine correlation and generation thresholds, enhancing the effectiveness of a new strategy for bat population to find optimal solutions. Elman neural network, as a typical local regression network, is based on the basic structure of BP network. It adds a continuation layer to the hidden layer as a one-step delay operator to achieve the purpose of memory, thereby enabling the system to adapt to time-varying characteristics and enhancing the global stability of the network. It is commonly used to solve fast optimization problems and is widely used in the field of pattern classification and prediction (Alamgir et al., 2022).
This paper optimizes and improves the traditional bat algorithm to enhance its optimization capability and avoid premature entrapment in local optima. The improved bat algorithm is combined with the Elman neural network to form a cavitation recognition program (ILBA-Elman). Through the optimization of weights and thresholds in the Elman neural network using the improved bat algorithm, the accuracy of the neural network in identifying cavitation data features is improved. The research focuses on a single-blade centrifugal non-clogging pump, conducting cavitation experiments on the test pump and collecting pressure pulsation signals at the volute tongue. The paper analyzes the cavitation characteristics of the test pump, summarizes cavitation patterns, and uses Variational Mode Decomposition (VMD) and Multiscale Dispersion Entropy (MDE) to extract cavitation feature data samples. Finally, ILBA-Elman is applied to diagnose and classify the cavitation state of the test pump, providing a basis for cavitation identification and fault diagnosis during the operation of non-clogging pumps on offshore oil platforms.
2 Bat algorithm and its improvement method
2.1 Basic bat algorithm mechanism
Bats utilize echolocation techniques to communicate with each other, navigate in dark environments, avoid obstacles, and detect the location of prey. A bat colony emits loud sound waves and determines the position of prey by listening to the signals reflected back from surrounding objects (Bajaj et al., 2022). In the process of searching for prey, bats search for the optimal solution by changing the frequency, loudness, and emissivity of sound waves (Yang and Hossein, 2012). The bat sound wave frequency, velocity, and position updating process are represented by Eqs 1–3.
Where fi represents the bat sound wave frequency, rand is a random number in the range of [−1, 1] following a uniform distribution, vit and xit denote the bat individual flight velocity and position, respectively. xbest represents the global optimal position of the bat population.
After the global search phase, the algorithm proceeds to the local search phase where bat positions are updated according to Eq. 4.
Where γ and α represent the sound wave emission coefficient and sound wave loudness attenuation coefficient, respectively. Subsequently, the global best solution is updated, and the termination condition is checked. If the specified optimization accuracy or maximum number of iterations is reached, the optimal solution is outputted.
2.2 Improvement methods for the bat algorithm
The Bat Algorithm is highly effective in solving complex problems. However, like other metaheuristic algorithms, it has some limitations that hinder its success rate in optimization problem-solving. While the initial search mechanism of the Bat Algorithm allows the bat population to quickly and thoroughly search for prey, if the current best solution is not in the vicinity of the global optimum, the algorithm may prematurely converge to a local optimum (Bezdan et al., 2022). Additionally, the local search phase can result in a large number of bats congregating near the current best bat, reducing individual diversity and causing the algorithm to converge prematurely around a local extremum (Deotti et al., 2020).
To overcome these limitations, the Bat Algorithm (BA) is optimized and designed primarily in two aspects. Firstly, the improvement lies in the formulation of the new bat position, which is determined by Eq. 7.
Where xb1t, xb2t, xb3t, xb4t, xb5t, xb6t represent six randomly selected bats from the bat population, i.e., xb1t ≠ xb2t ≠ xb3t ≠ xb4t ≠ xb5t ≠ xb6t. This represents a diversification strategy, and if the newly generated position is better than the current position, the bat position is updated.
Secondly, a series of modifications have been made along the basic logic of the Bat Algorithm. Simplify the update procedure of the bat position, improve the efficiency of the bat approaching the prey effectively by not considering the velocity v in the original bat algorithm, the efficiency of bats effectively approaching prey is enhanced. The new position update is represented by Eq. 8.
Where x* represents the bat current best position, which is the position closest to the prey discovered by the bat population at the moment. This equation, as it disregards the influence of velocity on prey search, may lead to a decrease in diversity and insufficient local search capability in the later stages of the search.
Therefore, to address this limitation, a new mathematical formula based on Lévy flights is introduced. Lévy flight is a type of random walk where the step length is drawn from the Lévy distribution. Due to its variance characteristics, significant displacements can occur in this random walk, and the resulting trajectory often exhibits self-similarity, with long jumps interspersed with shorter jumps at all scales. Many metaheuristic algorithms adopt Lévy flights to escape local optima (Vashishtha and Kumar, 2021). It is a more effective randomization strategy than traditional uniform distribution, and some typical features of Lévy flights have been observed in the flight behaviors of various animals and insects in nature (Campeau et al., 2022). To prevent excessive random step lengths that may reduce search accuracy during the Lévy flight process, the Mantegna method is used to generate random step lengths that follow the Lévy distribution. The position update of Lévy flight is shown in Eq. 9.
Where represents the tensor product, β is the Lévy flight exponent, and it is set to 1 < β ≤ 3. ∂ represents the step size control amount. Where (x*-xit) approximates the current bat position to the location where the bat population has discovered the best solution and scales the Lévy flight accordingly to an appropriate magnitude for each position dimension. After generating the new position, the bat compares it with its current position rather than the current best position, effectively avoiding the neglect of high-quality solutions.
In practical application, in order to prevent the search accuracy from being too large, the Mantegna method is used to generate a random step that obeys the Lévy distribution. The step size s is realized by Eq. 10.
Where u and v are drawn from a normal distribution, i.e., u ∼ N (0, σu2) and v ∼ N (0, σv2). σu2 is generated using Eq. 11.
Where Γ is the gamma function, and σu2 = 1.
The algorithm resulting from all the modifications described above is referred to as the Improved Lévy Flight Bat Algorithm (ILBA), or simply ILBA. ILBA overcomes some of the limitations of the traditional BA. It promotes effective exploration of the search space during the global search phase using Eq. 7 and conducts a local search using Eqs 8, 11, enabling the algorithm to find the optimal solution and allowing the bat population to approach the prey as accurately as possible during the iteration process. As in the final stages of the iteration, bats in the population tend to converge towards each other, both equations ensure sufficient exploration of the search space around the best solution, greatly facilitating the ability of ILBA to escape local optima across different iterations. ILBA retains all the premises adopted by BA and further assumes: 1) Initially, each bat interacts with six other bats in the population to acquire crucial signals as feedback, aiming to approach the prey as quickly as possible. 2) After completing this operation, the current bat continues to approach the bat identified as closest to the prey, eventually being able to perform a Lévy flight around it to be the first to reach the prey.
The basic steps of the ILBA algorithm are as follows:
Step 1. Initialize algorithm parameters and define the evaluation function, define the auxiliary parameter for Lévy flight using Eq. 10.
Step 2. Bat population initialization, calculate the initial fitness value for each individual.
Step 3. Select six bats to interact with the current bat. Generate new solutions using Eq. 7, calculate the fitness of each bat, and identify the best individual.
Step 4. Determine the ultrasonic frequency fi of each bat based on Eq. 1. Update the flight positions of the bats using Eq. 8. Calculate the fitness of each bat using the evaluation function and identify the best individual.
Step 5. Perform local search. If rand > ri, generate a local solution using Lévy flight. Utilize Eqs 9, 11 to search for the best solution, update the flight positions of the bats, calculate the fitness of each bat using the evaluation function, and identify the best individual.
Step 6. Update the local new solution: Generate a random number rand_ Ati for each bat individual i. If rand_ Ai < Ati and f(xit) < f(xbest), accept the new solution.
Step 7. Adjust the pulse emission rate rit and loudness Ati of each bat according to Eqs 5, 6.
Step 8. Update the global best solution and check the termination condition.
3 Simulation experiments
3.1 Test functions
To validate the efficiency of the ILBA algorithm, multiple sets of test functions are selected in this study. The information of the test functions is presented in Table 1.
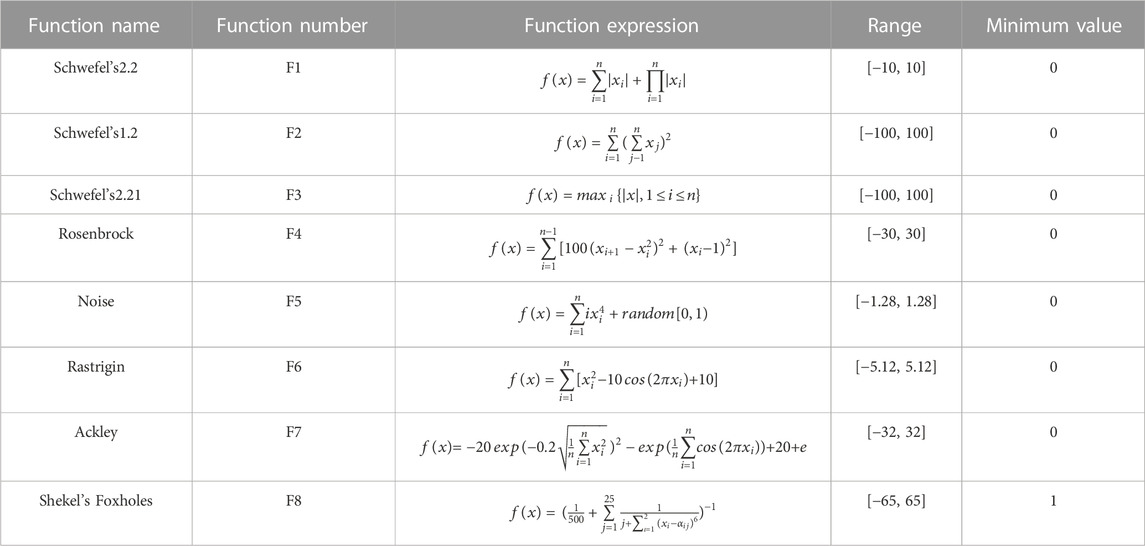
TABLE 1. Test function information.
The test functions include single-peak (F1, F2, F3, F4 and F5), multi-modal (F6 and F7), and fixed-dimension multi-modal (F8) benchmark functions, which effectively evaluate the performance of the algorithm. The range in the function information represents the boundaries of the search space, with the minimum value being the optimal solution for the function. The dimension space of the first seven functions is set to 30 dimensions, and the last fixed-dimensional multi-modal benchmark function is set to 2 dimensions, which puts forward higher requirements on the optimization calculation ability of the test algorithm.
Experimental comparisons are conducted between the proposed Improved Lévy Flight Bat Algorithm (ILBA), Bat Algorithm (BA), and Particle Swarm Optimization (PSO). All three algorithms belong to meta-heuristics, among which PSO is a search algorithm that simulates the foraging behavior of birds in groups. During the calculation, the particle swarm algorithm is initialized as a random group of particles, and in each iteration the particles update themselves by tracking two extreme values: one is the optimal solution found by the particle itself, and the other is the optimal solution found by the entire population. PSO, like other evolutionary algorithms, realizes the search for the optimal solution of complex space through cooperation and competition between individuals in the concepts of “population” and “evolution.” The software MATLAB R2021b is used for operation programming, and the basic parameters of each algorithm are shown in Table 2.
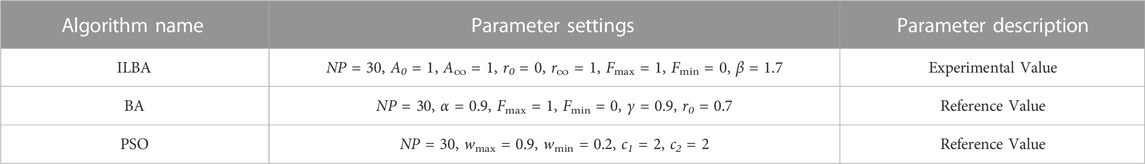
TABLE 2. Algorithm parameter setting.
3.2 Analysis of experimental results
Set the initial population of bats to 30, with 500 iterations. Repeat the experiments 30 times and record the average, maximum, minimum, and standard deviation values, synchronize the three algorithms for testing. The results are presented in Table 3.
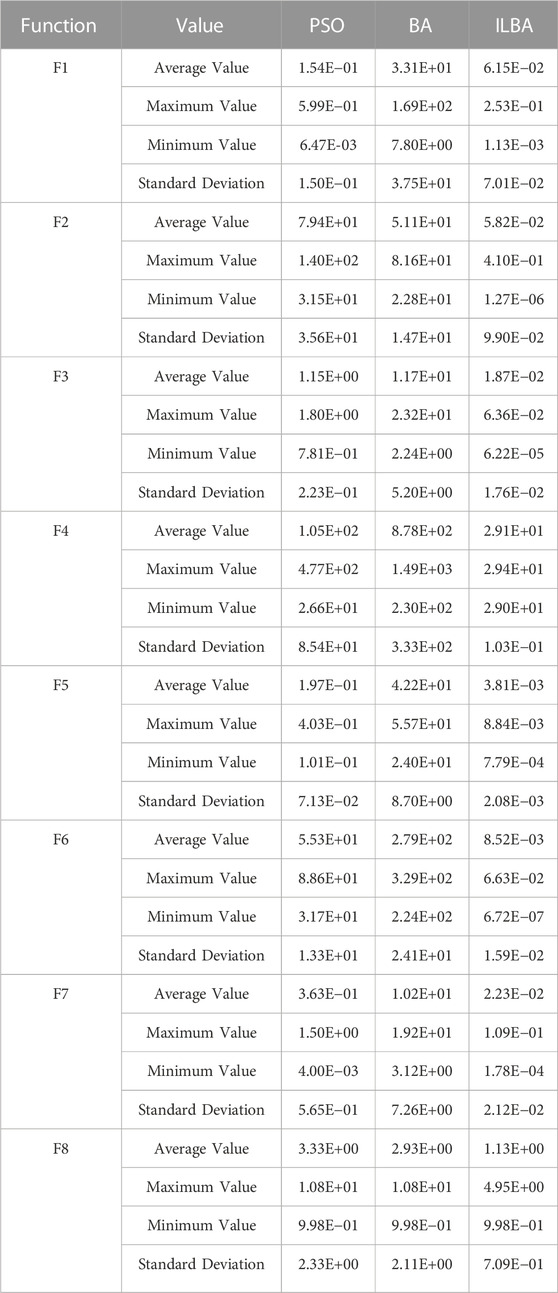
TABLE 3. Comparison of benchmark function results.
From the observations in Table 3, it can be seen that the ILBA algorithm shows significant improvement in convergence accuracy compared to the traditional BA and PSO algorithms. The traditional algorithms perform poorly in higher-dimensional solutions, making it difficult to reach near-optimal values. However, the ILBA algorithm demonstrates better accuracy and is able to overcome these challenges. The PSO algorithm shows higher convergence accuracy compared to the basic BA algorithm, but there is still a certain gap compared to ILBA. The ILBA algorithm consistently outperforms the other two algorithms and achieves better results in various complex function tests. This is due to the improvements in the global search equation and the introduction of Lévy flight strategy in the ILBA algorithm, enabling better search for the optimal solution.
3.3 Algorithm iteration process analysis
Figure 1 depicts the iteration process of the Particle Swarm Optimization (PSO) algorithm, Bat Algorithm (BA), and Improved Lévy Flight Bat Algorithm (ILBA) under eight different test functions. The left side of each graph shows a three-dimensional view of the test function, while the right side displays the convergence curves of the three algorithms. The x-axis represents the number of iterations, and the y-axis represents the minimum value reached by the algorithm during the iteration process.
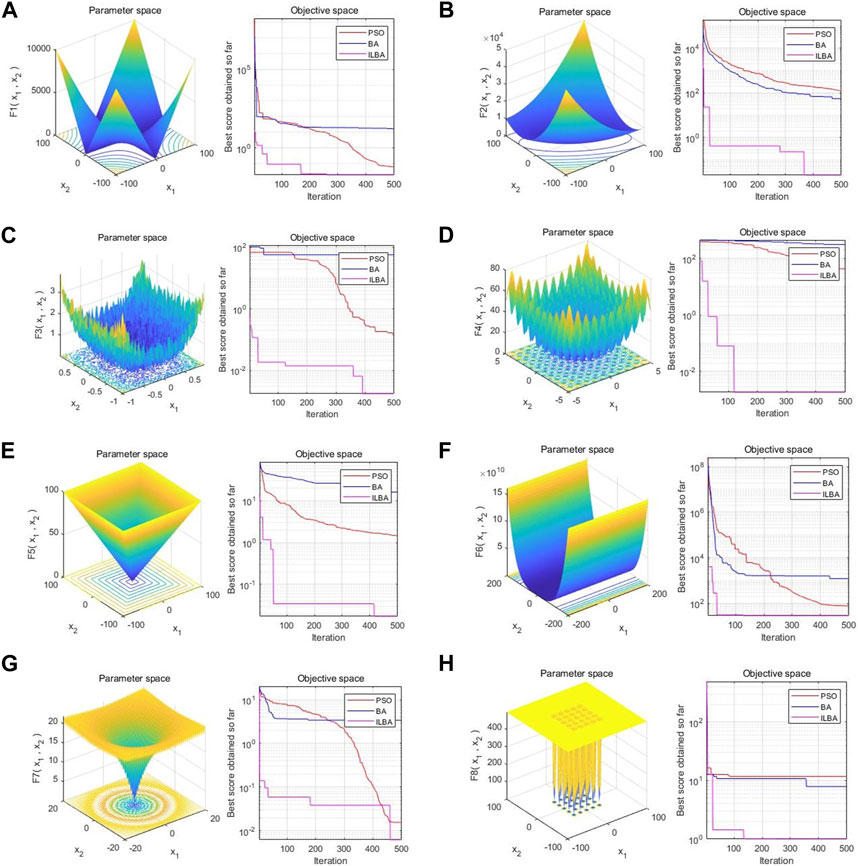
FIGURE 1. Change trend of algorithm iteration. (A) F1 Iteration Process. (B) F2 Iteration Process. (C) F3 Iteration Process. (D) F4 Iteration Process. (E) F5 Iteration Process. (F) F6 Iteration Process. (G) F7 Iteration Process. (H) F8 Iteration Process.
Overall, in different dimensions, the ILBA algorithm has higher accuracy and faster convergence speed than the BA algorithm and the PSO algorithm, and can quickly find the optimal solution in a shorter iteration step. The overall convergence performance of the BA algorithm is the worst, and the accuracy is low, it is easy to fall into the local optimal solution trap prematurely in the process of solving complex functions, resulting in large errors in calculation results. The BA algorithm can be faster than the PSO algorithm in only a small part of the lower convergence accuracy environment. This may be due to the search strategy based on acoustic emissivity and loudness in the early stage of the bat algorithm, which led to bat swarms gathering near the local optimal solution and unable to reach the global optimal solution. Although the PSO algorithm can achieve high convergence accuracy in most cases, its convergence speed is relatively slow, and it cannot converge to a smooth-running stage in time in a limited number of iteration steps. From a specific point of view, as shown in Figures 1A–E, the ILBA algorithm can converge to a higher accuracy under the high-dimensional single-mode benchmark function test; under the high-latitude multi-modal benchmark function test, as shown in Figure 1G, Although the accuracy of the ILBA algorithm and the PSO algorithm is close when the number of convergence steps is high, ILBA can improve the convergence accuracy again soon; Although the three algorithms all stop converging after a short number of steps, the ILBA algorithm obviously achieves higher convergence accuracy. In actual engineering, the efficiency of global optimization is particularly critical. Achieving higher accuracy within a shorter number of iterations is conducive to shortening the calculation cycle and saving computing resources. The ILBA algorithm benefits from the improved global and local search and step size adjustment strategies of the bat algorithm. The bat can quickly jump out of the trap of the local extremum and continue the optimization process, so that the improved bat algorithm can quickly converge in the early stage of iteration.
4 Single-blade non-clogging pump cavitation experiment and data acquisition
4.1 Test equipment and methods
The test pump selected in this paper is a single-blade centrifugal non-clogging pump with a rated power of 2.2 kW. Its main design parameters are: head Hd = 13.8 m, flow Qd = 20 m3/h, speed n = 2,940 r/min, specific speed ns = 132. The non-clogging pump is driven by a three-phase asynchronous motor with a rotation frequency of 49 Hz. The test in this paper was carried out on the closed test bench of the Machinery Industry Drainage and Irrigation Machinery Product Quality Inspection Center (Zhenjiang). The test bench was carried out in accordance with the standard of GB/T 3216-2016 “Hydraulic Performance Acceptance Test of Rotary Power Pump Grade 1, Grade 2 and Grade 3”. The precision of the test bench is level 1. The layout diagram of the test bench is shown in Figure 2.
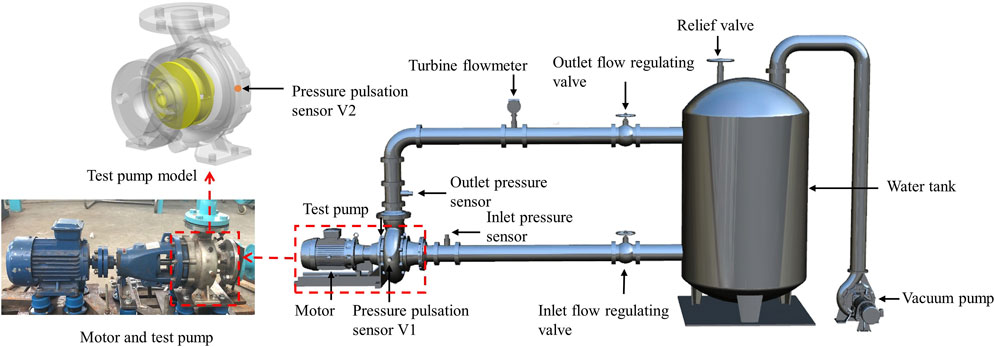
FIGURE 2. Single-blade non-clogging pump closed test stand.
The CYG1102F pressure pulsation sensor is selected for collecting the pressure pulsation signals in the experiment. The sensors V1 and V2 are placed at two different positions in the horizontal direction of the volute casing to collect the pressure pulsation data.
In order to verify the reliability of the test in this paper, three external characteristic tests were carried out on the test pump under different flow conditions. By changing the adjustment mode of the outlet valve, each time at an interval of 0.1 Qd, record the performance parameters of the experimental pump. Figure 3 shows the external characteristic curve of the test pump under a standard atmospheric pressure. According to the error bar analysis under different working conditions, it can be seen that the minimum error in head and efficiency appears at the rated flow rate (20 m3/h). The repeatability test results show the stability and reliability of the test equipment and test results.

FIGURE 3. Repeatability test.
The sampling frequency in this experiment is set to 24,000 Hz, with a single sampling time of 0.05 s. The experiment is conducted under the rated flow rate of 20 m3/h and the rated rotational speed of 2,940 r/min for the single-blade non-clogging pump. At the beginning of the experiment, the inlet valve is fully open, and the outlet valve is adjusted to stabilize the flow rate at 20 m3/h. The vacuum pump is then turned on to gradually reduce the inlet pressure and induce cavitation in the pump. To maintain a stable flow rate, the outlet valve is continuously adjusted in real-time until the end of the experiment. Throughout the experiment, the signals of the pump inlet and outlet pressures, flow rate, and volute casing pressure pulsation are synchronously collected.
4.2 Experimental results
The calculation formula for the Net Positive Suction Head Available (NPSHa) in the device is given by:
where pin is the pump inlet pressure and pv is the saturated vapor pressure of water at 25°C, which has a value of 3,469 Pa.
In actual engineering, it is usually considered that the head of the centrifugal pump drops by 3% as the basis for the onset of cavitation (Arendra et al., 2020). In this paper, the cavitation development process is divided into three stages according to the head drop ratio: non-cavitation (NPSHa = 7.49 m), cavitation inception (head drop 3%, NPSHa = 1.89 m) and severe cavitation (head drop 6%, NPSHa = 1.76 m). Carry out cavitation test on the test pump, as the inlet pressure decreases, the head initially remains stable or even shows an increasing trend. However, as the inlet pressure further decreases, the head rapidly drops.
Analyze the collected pressure pulsation signal data. Since the pressure pulsation signal data is huge and the processing is cumbersome, the main variables are dimensionally processed and the pressure pulsation value is converted into the pressure pulsation coefficient CP. The expression formula is as follows:
Where p is the transient static pressure value,
Analyze the collected pressure pulsation signal data and use Cmor wavelet transform to compensate for the lack of time axis in conventional Fourier transform, and the time-frequency domain diagram of the pressure fluctuation under different cavitation stages is obtained, as shown in Figure 4, the left and right are the wavelet transform diagrams of the V1 monitoring point and the V2 monitoring point respectively. It can be seen from the figure that when the monitoring point V1 close to the tongue is not in cavitation, since the dynamic and static interference between the blade and the volute tongue is the main cause of the pressure pulsation transformation, the pressure pulsation amplitude signal is mainly concentrated at one times the blade frequency (49 Hz), the amplitude of the secondary main signal is concentrated around double and triple the leaf frequency, and the maximum overall amplitude does not exceed 0.08. With the decrease of the inlet pressure, the periodic cavitation collapse makes the internal flow structure become complicated, and the signal amplitude at high frequency drops sharply when the cavitation is incipient, and the overall amplitude is concentrated around one times the leaf frequency, and the amplitude ratio is greater than that of the cavitation state has increased significantly, increasing by 0.125. As the cavitation process intensifies, the accumulation of gas in the pump interferes with the continuity of the flow field. In the severe cavitation stage, the overall amplitude is still concentrated at the one-time vane frequency and further increases, and the maximum value is at one-time vane frequency (49 Hz). The amplitude reached 0.2, and at the same time, the amplitude near the second leaf frequency increased compared with the initial stage of cavitation. The amplitude change of the pressure pulsation signal at the monitoring point V2 is not so drastic compared with the monitoring point V1 close to the diaphragm. On the whole, when there is no cavitation, the amplitude of the pressure pulsation signal at V2 is concentrated around the double leaf frequency and double leaf frequency. As the cavitation intensifies, the amplitude of the signal around the double leaf frequency increases. The amplitude and range of the signal amplitude are increasing, and the maximum signal amplitude reaches 0.11 near 49 Hz. The overall transformation law is similar to that of V1, but due to the large flow channel area around the V2 monitoring point, the liquid flow is relatively smooth and the impact is small, and the overall amplitude change is not as obvious as that at V1. The position close to the volute tongue is most strongly affected by the dynamic and static interference between the impeller and the tongue in the test, and it can represent the characteristic signal of the non-clogging pump in the cavitation process, so the monitoring point V1 near the volute tongue is selected. The obtained pressure pulsation signal is further analyzed to extract the representative signal of cavitation characteristics.
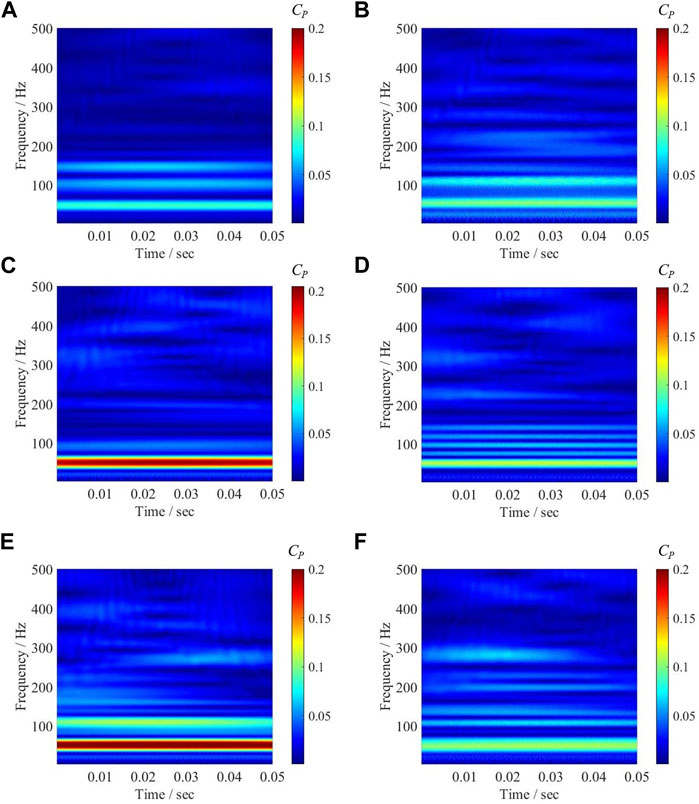
FIGURE 4. Wavelet transform map of pressure pulsation monitoring points. (A) V1 Non-cavitation. (B) V2 Non-cavitation. (C) V1 Cavitation inception. (D) V2 Cavitation inception. (E) V1 Severe cavitation. (F) V2 Severe cavitation.
5 Numerical simulation of cavitation in a single-blade non-clogging pump
5.1 Meshing and independence verification
The non-clogging pump belongs to the impeller rotating machine, and there are rotating domain and static domain inside. This paper adopts the numerical simulation calculation of the whole flow field, that is, all the liquid flow areas in the pump are calculation domains. UG software is used to model the single-vane test pump in 3D, which is mainly divided into five main parts: impeller, pump chamber, volute, inlet pipe section and outlet pipe section. The ANSYS ICEM 19.0 software is used to divide the entire numerical calculation model into a hexahedral structured grid. In numerical simulation, the more and denser the grid, the more accurate the calculation structure will be, but this will require too much computing power of the computer and cause a lot of waste of computing resources. Therefore, grid division needs to find a balance between calculation accuracy and efficiency. According to the data in Figure 5A, with the increase of the number of grids, the calculated head of the model pump is stable at about 13.8 m, and the value of the head is getting closer and closer to the head at the rated flow rate. When the number of grids exceeds 11.5
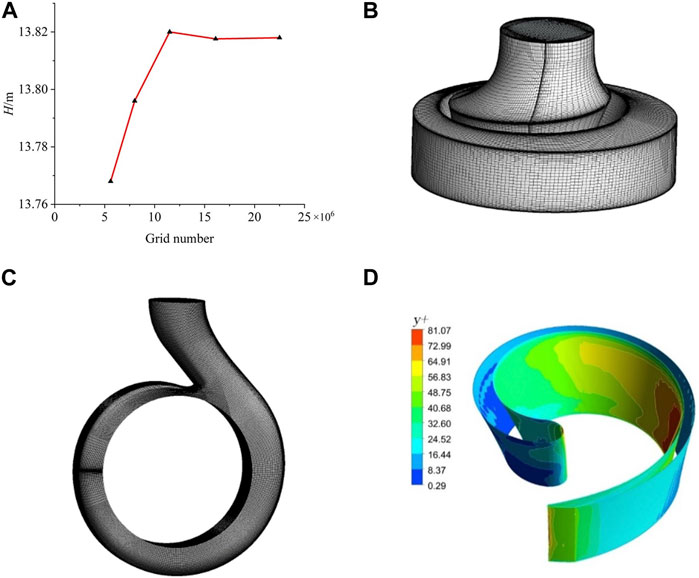
FIGURE 5. Mesh independent verification and water body structure grid. (A) Mesh independent verification. (B) Impeller. (C) Volute. (D) Distribution of y+ on blade surface.
5.2 Numerical simulation of cavitation
Due to the generation and collapse process of cavitation will affect the turbulent development, resulting in the imbalance between the turbulent kinetic energy generation term and the dispersion term in the cavitation flow during cavitation flow, the SST k-ω turbulent flow model is adopted, which has better accuracy and stability than the standard k-ω model on the near-wall surface (Fu et al., 2020; Mousmoulis et al., 2021). Under the condition of steady state without cavitation, the calculation medium is clear water at 25°C under standard atmospheric pressure, and the solid wall is set as a non-slip wall. Since the impeller and volute are all carbon steel castings, the surface roughness is set as 50 μm. The boundary conditions of the model are set according to the test conditions. The inlet boundary condition is set to the total pressure inlet, the turbulence intensity at the inlet is set to 2%, and the outlet boundary condition is set to the flow outlet. Since the turbulence intensity at the outlet is set to 5%, the reference atmospheric pressure is set to a standard atmospheric pressure of 101.325 kPa. Considering the calculation time and calculation accuracy comprehensively, in the simulation process, the time step is set to 1/ω, equivalent to 0.003248 s, the iteration step is set to 2,000 steps, and the convergence accuracy is 10−6. The solver settings are the same for all the different flow case points.
Figure 6 illustrates a numerical simulation and experimental comparison of the NPSHa curve, where arrows A and B indicate the points of a 3% and 6% head drop in the pump performance during the cavitation process. The figure also displays three-dimensional schematic representations of the distribution of bubble volumes within the impeller passage at these two distinct cavitation stages in the numerical simulation. The critical NPSHa obtained by the test and simulation is 1.89 and 1.77 m, respectively, and due to the rougher wall surface of the test and the influence of the leakage of the mouth ring, the head test value corresponding to the critical NPSHa point is slightly lower than the simulated value. From the point of view of the overall trend of the curve, the variation trend of the simulation and the test is basically consistent, which verifies the accuracy of the numerical calculation. As shown in Figure 7, the cavitation volume fraction distribution of the impeller and the central section of the single-blade non-clogging pump at different stages of cavitation. It can be seen from the figure that in the non-cavitation state, there is no bubble distribution on the central section of the impeller and the pump. When the inlet pressure gradually decreases and the critical cavitation state is reached, bubbles begin to appear near the leading edge of the blade suction surface. Obvious cavitation distribution, the length of the cavitation is continuously extending, and gradually diffuses to the downstream position of the suction surface. When the inlet pressure drops to a certain level and the pump suffers from severe cavitation, the cavitation at the inlet of the vane has been filled with the downstream of the suction surface, and even diffuses along the volute flow path to the pressure surface of the impeller. Due to the particularity of the asymmetry of the single-blade impeller, the cavitation volume distribution gradually develops from the leading edge to the trailing edge along the suction surface, and finally the cavitation blocks the entire impeller flow channel. A large number of cavitation will affect the normal flow of liquid in the pump, hinder the impeller blades from doing work on the fluid in the pump, and cause the pump lift and efficiency to decrease, making it unable to work normally.

FIGURE 6. NPSHa curve.
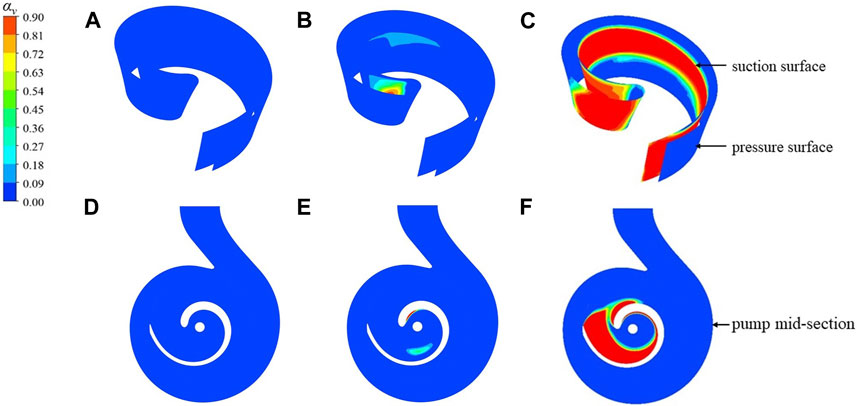
FIGURE 7. Cavitation volume fraction distribution of impeller and pump center section. (A) Non-cavitation. (B) Cavitation inception. (C) Severe cavitation. (D) Non-cavitation. (E) Cavitation inception. (F) Severe cavitation.
6 Validation of cavitation diagnosis model
In this chapter, the cavitation eigenvector is extracted from the pressure pulsation signal near the septum tongue collected in the cavitation test of the single-blade non-clogging pump. Using the feature signal extraction method of Variational Mode Decomposition (VMD) + Multiscale Dispersion Entropy (MDE), the complexity of the time series is measured from multiple angles, and the most representative feature vector in the original signal is extracted as a test ILBA-Elman Dataset for the cavitation recognition program.
6.1 Variational mode decomposition (VMD)
The Variational Mode Decomposition (VMD) is a non-recursive and nearly orthogonal adaptive decomposition method that incorporates the decomposition process of a signal into a variational framework. It aims to find the optimal solution by searching the constrained variational model, thereby achieving the adaptive decomposition of the signal (Kumar et al., 2021). The variational solving constraint model is defined by Eq. 14.
Where {uk} = {u1, u2, ···, uk,} represents the k mode components obtained from the decomposition, and {ωk} = {ω1, ω2, ···, ωk,} represents the central frequencies of each mode component.
When solving constrained variational problems, it is common to introduce the Lagrange function. This is done by utilizing Eq. 15.
Where α represents the quadratic penalty operator, f(t) represents the input signal, and λ(t) represents the pulse function.
By utilizing the Alternating Direction Method of Multipliers, the saddle point of the Lagrange function can be found. This allows us to obtain the optimal solution to the constrained variational model, resulting in the mode components uk and central frequencies ωk, as given by Eqs 16, 17, respectively.
6.2 Multiscale dispersion entropy (MDE)
Dispersion entropy is an algorithm used to measure the complexity and irregularity of a time series. It calculates the irregularity of a time series based on the sample space dispersion entropy and an adaptive threshold. On the other hand, multiscale dispersion entropy calculates the dispersion entropy at different scales, capturing the dynamic characteristics of the sequence at different time scales. By combining the coarse-grained multiscale dispersion entropy with dispersion entropy, a more comprehensive description of the complexity and regularity of a time series can be achieved. Compared to multiscale sample entropy, multiscale dispersion entropy has advantages in signal feature extraction (Dhandapani et al., 2022). The basic principles of multiscale dispersion entropy are described below.
First, the time series of the initial signal is expressed as: {u(i), i = 1, 2, ···, L}, The sequence is subjected to composite coarse-graining, and the kth coarse-grained sequence under the scale factor τ is denoted as xkt. The calculation formulas for the sequence are given by Eqs 18, 19 as follows.
Then, for each scale factor τ, the Multiscale Dispersion Entropy (MDE) is defined as shown in Eq. 20.
Where X represents the initial time series.
Unlike traditional methods such as multiscale permutation entropy, MDE calculates the coarse-grained sequences for each scale factor τ and computes their dispersion entropy and average. This approach reduces the fluctuations in entropy values caused by increasing values of τ (Minhas et al., 2021).
6.3 Decomposition and feature extraction of pressure pulsation signals
In VMD decomposition, there are two main parameters: the number of modes k and the quadratic penalty factor α. The value of k directly affects the effectiveness of signal decomposition. If k is too large, it will increase computational cost and decrease decomposition efficiency. On the other hand, if k is too small, it may result in mode mixing (González-Cavieres et al., 2021). In this study, α is set to 2000, and the value of k is determined using the center frequency method. Different values of k (3, 4, 5, 6, 7) are chosen, and the central frequencies of each mode component are analyzed, as shown in Table 4. It can be observed that when k is larger than 5, the central frequencies become similar, indicating over-decomposition. Therefore, in this study, k = 4 is chosen as the optimal number of mode components. The dispersion entropy of each mode component is computed for k = 4, as shown in Table 5. According to the principle of minimum entropy, a smaller entropy value indicates a lower probability of generating new patterns in the decomposed sequences. This implies that the decomposed sequence has fewer frequency components and a lower possibility of mode mixing, resulting in better decomposition performance, it can be seen that IMF1 component is selected as the object for feature extraction.
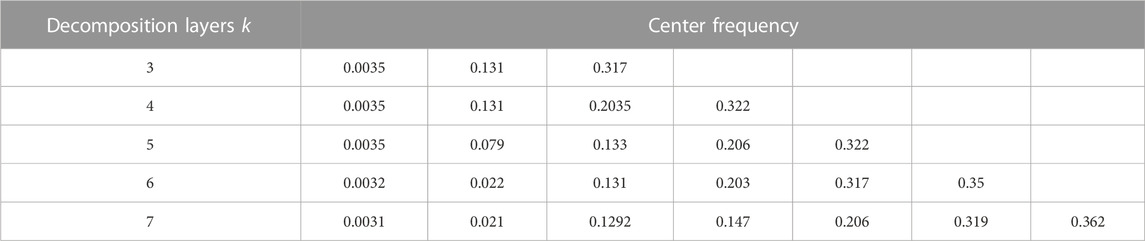
TABLE 4. Center frequency under different decomposition levels.
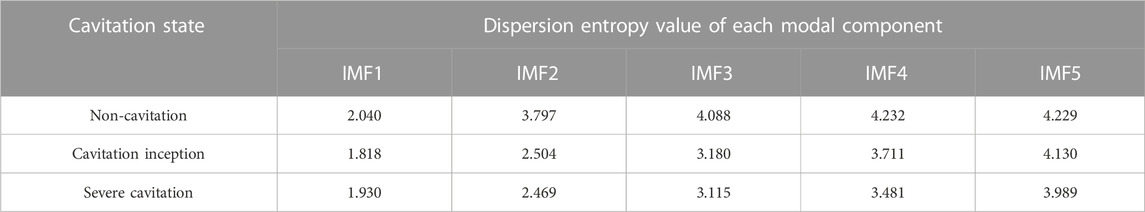
TABLE 5. Dispersion entropy under different cavitation conditions.
The Multiscale Dispersion Entropy (MDE) is used to extract features from the optimal mode component IMF1 of the pressure pulsation signals in three different cavitation states. The scale factor is set to 20, and the extraction results are shown in Figure 8.
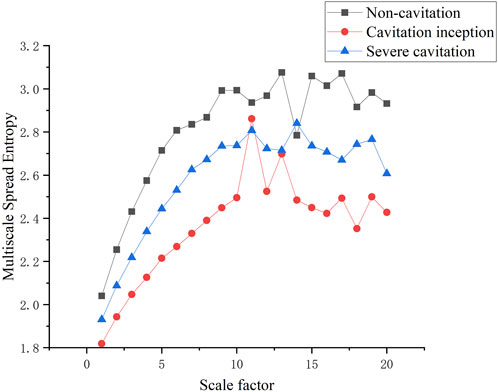
FIGURE 8. MDE feature extraction results.
From Figure 8, it can be observed that as the scale factor increases, the differences in MDE values between different cavitation states become smaller, leading to overlapping and crossing phenomena. If a larger scale factor is chosen to extract feature vectors, it may result in the mixing of feature information, thus affecting the final cavitation diagnosis. On the other hand, when the scale factor is too small, it may not capture sufficient feature information. Therefore, in this study, the MDE values under the first 10 scale factors are selected to construct the feature sample set. Thus, the VMD + MDE method is used to extract cavitation representative features of pressure pulsation signals, decomposing the originally complex and disordered time-domain signals to extract a traceable entropy distribution. By comparing the entropy distribution under different cavitation stages, the recognition and classification of pressure pulsation signals can be achieved, and the entropy distribution can be established as a basic dataset for training the cavitation diagnosis model.
6.4 Model diagnostics
The dataset of 300 samples is randomly divided into a training set and a test set in a 4:1 ratio, with 240 samples used for training and 60 samples used for testing. The three cavitation states in the dataset are labeled as 1, 2, and 3, respectively. The ILBA algorithm is used to optimize the weights and thresholds of the Elman neural network. The ILBA-Elman cavitation diagnostic program is established, and the training set is used to train the model to obtain the best model parameters and optimal network for diagnosing cavitation in the test set. The test results are shown in Figure 9. After training, the neural network achieves a cavitation identification accuracy of 96.67% for the 60 samples in the test set, while the baseline Elman neural network model only achieves a cavitation state identification accuracy of 90% for the test set.
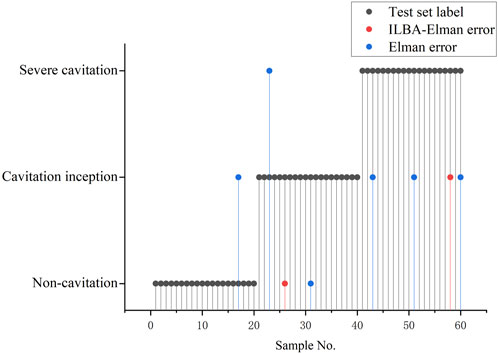
FIGURE 9. Sample test error comparison.
To validate the superiority of the proposed ILBA-Elman cavitation diagnosis method, the sample feature data extracted by MDE is inputted into the ILBA-Elman, BA-Elman, and PSO-Elman models for calculation and testing. To ensure the universality of the computational results, the tests are repeated 10 times. The results are shown in Table 6.
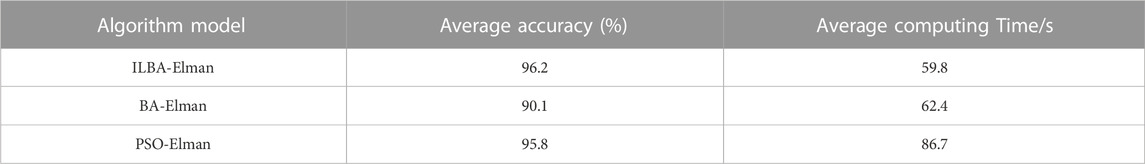
TABLE 6. Comparison of recognition results of three algorithms.
From Table 6, it can be observed that all three models demonstrate good performance in terms of classification accuracy. However, the proposed ILBA-Elman model in this paper shows advantages in both computation time and accuracy. Based on this analysis, it can be concluded that the proposed cavitation diagnosis model, which combines VMD with MDE feature extraction and utilizes the improved Lévy flight bat algorithm with Elman neural network, achieves good results in the recognition and classification of cavitation features in non-clogging pumps. It can strike a balance between high classification accuracy and low computation time cost.
7 Conclusion
In order to realize the pattern recognition of the cavitation process of non-clogging pumps, this paper proposes a program for identifying the cavitation characteristics of non-clogging pumps based on the improved Lévy flight bat algorithm. The effectiveness of the proposed method was verified through experiments and the following conclusions were drawn:
1. By making improvements to the conventional bat algorithm, the interaction among initial state bats positions was enhanced, and the Lévy flight was introduced to optimize the bat position update formula. This enhancement has increased the efficiency of bat searching, effectively avoiding local optimal situations.
2. The cavitation tests on a single-blade non-clogging pump are conducted to collect pressure pulsation signals at the volute tongue, and the data is analyzed based on wavelet transform. It was found that the dynamic and static interference between the blades and the spacer tongue is the main cause of pressure pulsations. As cavitation intensifies, the periodic collapse of the bubbles makes the liquid flow in the pump become cluttered. The accumulation of gas interferes with the fluidity of the flow field, leading to an increase in the amplitude of the high-frequency part. The distribution of vapor volume in the impeller channel under cavitation condition was analyzed through numerical simulation, and the accuracy of the experiment was verified by comparing it with experimental data.
3. By employing Variational Mode Decomposition and Multiscale Dispersion Entropy to extract feature vectors, interference signals were effectively suppressed. This approach assessed the complexity of time series from multiple perspectives. The complex and disordered pressure pulsation time domain signal is transformed into a traceable entropy distribution, which improves the accuracy of cavitation recognition.
4. The ILBA-Elman cavitation recognition program was trained and subsequently tested for cavitation data identification and diagnosis in single-blade non-clogging pumps. The BA-Elman and PSO-Elman models were tested for comparison. The results revealed that the ILBA-Elman model outperformed the other models in terms of accuracy and timeliness in identifying the cavitation development stages in non-clogging pumps. The improved Bat Algorithm helps the Elman neural network to identify the cavitation feature information more accurately.
Data availability statement
The data analyzed in this study is subject to the following licenses/restrictions: Due to laboratory policies and confidentiality agreements, raw data cannot be provided. Requests to access these datasets should be directed to CN, OTk3Njk0NjU1QHFxLmNvbQ==.
Author contributions
TL: Writing–original draft, Conceptualization, Methodology. CN: Data curation, Writing–original draft. KC: Investigation, Writing–review and editing. EX: Data curation, Writing–review and editing. JY: Methodology, Writing–review and editing. XS: Validation, Writing–review and editing. XW: Data curation, Writing–review and editing. DZ: Conceptualization, Visualization, Writing–review and editing.
Funding
The authors declare financial support was received for the research, authorship, and/or publication of this article. This research was funded by Key Program of the Joint Fund of the National Natural Science Foundation of China, grant number U2106225; Jiangsu Province Outstanding Youth Fund, grant number BK20211547; 2021 Jiangsu Province Excellent Science and Technology Innovation Team Project, grant number SKJ (2021) -1.
Conflict of interest
The authors declare that the research was conducted in the absence of any commercial or financial relationships that could be construed as a potential conflict of interest.
Publisher’s note
All claims expressed in this article are solely those of the authors and do not necessarily represent those of their affiliated organizations, or those of the publisher, the editors and the reviewers. Any product that may be evaluated in this article, or claim that may be made by its manufacturer, is not guaranteed or endorsed by the publisher.
References
Alamgir, F. M., and Alam, M. S. (2022). A novel deep learning-based bidirectional elman neural network for facial emotion recognition. Int. J. Pattern. Recogn. 36 (10), 2252016. doi:10.1142/S0218001422520164
Arendra, A., Akhmad, S., Winarso, K., and Herianto., (2020). Investigating pump cavitation based on audio sound signature recognition using artificial neural network. J. Phys. Conf. Ser. 1569 (3), 032044. doi:10.1088/1742-6596/1569/3/032044
Azizi, R., Attaran, B., Hajnayeb, A., Ghanbarzadeh, A., and Changizian, M. (2017). Improving accuracy of cavitation severity detection in centrifugal pumps using a hybrid feature selection technique. Measurement 108, 9–17. doi:10.1016/j.measurement.2017.05.020
Bajaj, A., Sangwan, O. P., and Abraham, A. (2022). Improved novel bat algorithm for test case prioritization and minimization. Soft Comput. 26 (22), 12393–12419. doi:10.1007/S00500-022-07121-9
Bezdan, T., Zivkovic, M., Bacanin, N., Strumberger, I., Tuba, E., and Tuba, M. (2022). Multi-objective task scheduling in cloud computing environment by hybridized bat algorithm. J. Intell. Fuzzy. Syst. 42 (1), 411–423. doi:10.3233/JIFS-219200
Campeau, W., Simons, A. M., and Stevens, B. (2022). The evolutionary maintenance of Lévy flight foraging. Plos. Comput. Biol. 18 (1), e1009490. doi:10.1371/JOURNAL.PCBI.1009490
Cui, Z., Li, F., and Zhang, W. (2019). Bat algorithm with principal component analysis. Int. J. Mach. Learn. Cyb. 10, 603–622. doi:10.1007/s13042-018-0888-4
Deotti, L. M. P., Pereira, J. L. R., and da Silva Junior, I. C. (2020). Parameter extraction of photovoltaic models using an enhanced Lévy flight bat algorithm. Energy Convers. manage. 221, 113114. doi:10.1016/j.enconman.2020.113114
Dhandapani, R., Mitiche, I., McMeekin, S., and Morison, G. (2022). A novel bearing faults detection method using generalized Gaussian distribution refined composite multiscale dispersion entropy. Ieee. Trans. Instrum. Meas. 71, 1–12. doi:10.1109/TIM.2022.3187717
Eskandari, S., and Seifaddini, M. (2023). Online and offline streaming feature selection methods with bat algorithm for redundancy analysis. Pattern Recogn. 133, 109007. doi:10.1016/j.patcog.2022.109007
Fu, X., Li, D., Wang, H., Zhang, G., Li, Z., and Wei, X. (2020). Numerical simulation of the transient flow in a pump-turbine during the load rejection process with special emphasis on the cavitation effect. J. Fluids Eng. 142 (1), 011103. doi:10.1115/1.4044479
González-Cavieres, L., Perez-Won, M., Tabilo-Munizaga, G., Jara-Quijada, E., Díaz-Álvarez, R., and Lemus-Mondaca, R. (2021). Advances in vacuum microwave drying (VMD) systems for food products. Trends. Food. Sci. Tech. 116, 626–638. doi:10.1016/J.TIFS.2021.08.005
Kan, K., Binama, M., Chen, H., Zheng, Y., Zhou, D., Su, W., et al. (2022). Pump as turbine cavitation performance for both conventional and reverse operating modes: a review. Renew. Sust. Energy Rev. 168, 112786. doi:10.1016/j.rser.2022.112786
Kumar, A., Gandhi, C. P., Vashishtha, G., Kundu, P., Tang, H., Glowacz, A., et al. (2021). VMD based trigonometric entropy measure: a simple and effective tool for dynamic degradation monitoring of rolling element bearing. Meas. Sci. Technol. 33 (1), 014005. doi:10.1088/1361-6501/ac2fe8
Kumar, A., and Kumar, R. (2017). Time-frequency analysis and support vector machine in automatic detection of defect from vibration signal of centrifugal pump. Measurement 108, 119–133. doi:10.1016/j.measurement.2017.04.041
Lang, T., Jin, L., Liu, Y., Chen, K., and Xu, E. (2022). Numerical analysis of hydrodynamic noise characteristics of single-blade centrifugal pump. J. Drain. Irrig. Mach. Eng. 40 (6), 541–548. doi:10.3969/j.issn.1674-8530.20.0358
Lang, T., Sun, Z., Jin, L., Chen, K., and Xu, X. (2023). Characteristics of cavitation-induced noise in single-blade centrifugal pump. J. Drain. Irrig. Mach. Eng. 41 (9), 873–880. doi:10.3969/j.issn.1674-8530.22.0025
Li, G., Ding, X., Wu, Y., Wang, S., Li, D., Yu, W., et al. (2022). Liquid-vapor two-phase flow in centrifugal pump: cavitation, mass transfer, and impeller structure optimization. Vacuum 201, 111102. doi:10.1016/j.vacuum.2022.111102
Li, H., Huang, Q., Li, S., Li, Y., Fu, Q., and Zhu, R. (2023). Study on flow characteristics of a single blade breakage fault in a centrifugal pump. Processes 11 (9), 2695. doi:10.3390/PR11092695
Lu, Y., Tan, L., Han, Y., and Liu, M. (2022). Cavitation-vibration correlation of a mixed flow pump under steady state and fast start-up conditions by experiment. Ocean. Eng. 251, 111158. doi:10.1016/J.OCEANENG.2022.111158
Minhas, A. S., Kankar, P. K., Kumar, N., and Singh, S. (2021). Bearing fault detection and recognition methodology based on weighted multiscale entropy approach. Mech. Syst. Signal P. R. 147, 107073. doi:10.1016/j.ymssp.2020.107073
Mousmoulis, G., Kassanos, I., Aggidis, G., and Anagnostopoulos, I. (2021). Numerical simulation of the performance of a centrifugal pump with a semi-open impeller under normal and cavitating conditions. Appl. Math. Model 89, 1814–1834. doi:10.1016/j.apm.2020.08.074
Neill, G. D., Reuben, R. L., Sandford, P. M., Brown, E. R., and Steel, J. A. (1997). Detection of incipient cavitation in pumps using acoustic emission. P. I. Mech. Eng. E-J Pro. 211 (4), 267–277. doi:10.1243/0954408971529737
Noon, A. A., Jabbar, A. U., Koten, H., Kim, M. H., Ahmed, H. W., Mueed, U., et al. (2021). Strive to reduce slurry erosion and cavitation in pumps through flow modifications, design optimization and some other techniques: long term impact on process industry. Materials 14 (3), 521. doi:10.3390/MA14030521
Quan, H., Li, Y., Kang, L., Yu, X., Song, K., and Wu, Y. (2021). Influence of blade type on the flow structure of a vortex pump for solid-liquid two-phase flow. Machines 9 (12), 353. doi:10.3390/machines9120353
Rauf, H. T., Malik, S., Shoaib, U., Irfan, M. N., and Lali, M. I. (2020). Adaptive inertia weight Bat algorithm with Sugeno-Function fuzzy search. J. Comput. Appl. Soft. 90, 106159. doi:10.1016/j.asoc.2020.106159
Siano, D., and Panza, M. A. (2018). Diagnostic method by using vibration analysis for pump fault detection. Energy Procedia 148, 10–17. doi:10.1016/j.egypro.2018.08.013
Vashishtha, G., and Kumar, R. (2021). An effective health indicator for the Pelton wheel using a Levy flight mutated genetic algorithm. Meas. Sci. Technol. 32 (9), 094003. doi:10.1088/1361-6501/abeea7
Yang, X. S., and He, X. (2013). Bat algorithm: literature review and applications. Int. J. Bio-Inspir. 5 (3), 141–149. doi:10.1504/IJBIC.2013.055093
Yang, X. S., and Hossein Gandomi, A. (2012). Bat algorithm: a novel approach for global engineering optimization. Eng. Comput. 29 (5), 464–483. doi:10.1108/02644401211235834
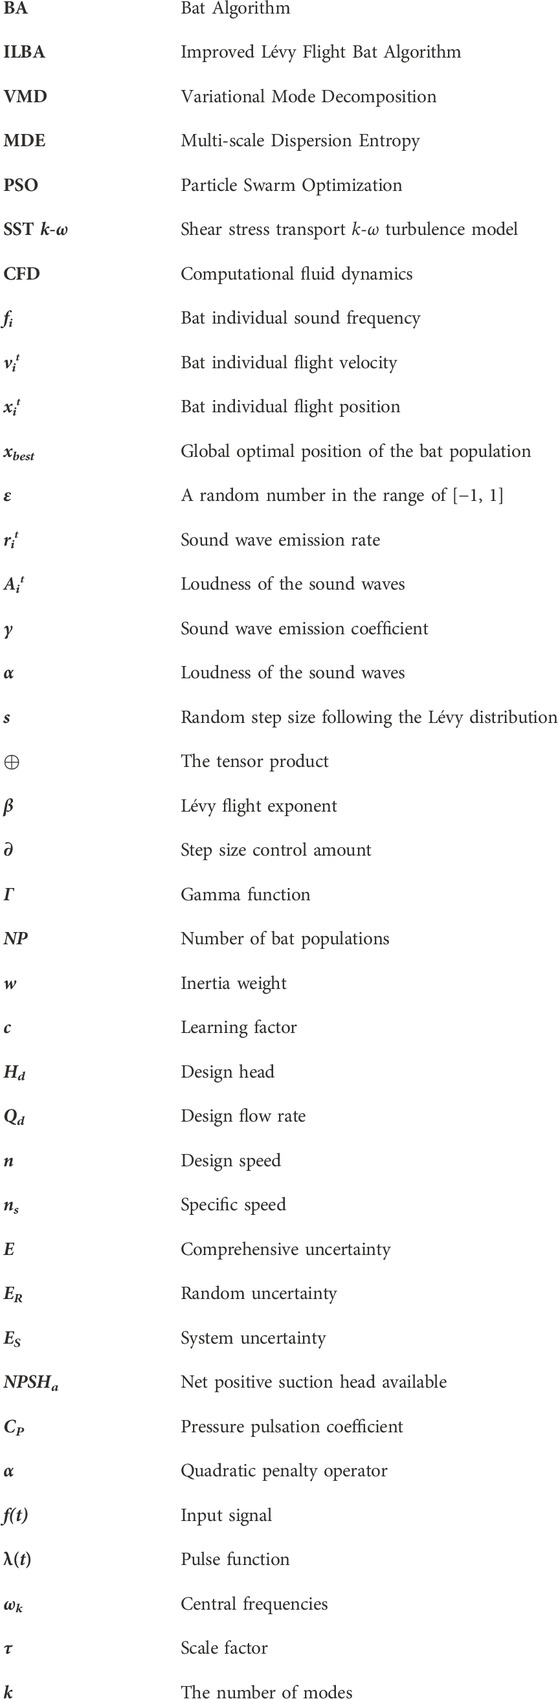
Nomenclature
Keywords: bat algorithm, Lévy flight, Elman neural network, cavitation recognition, non-clogging pump, VMD, multi-scale dispersion entropy
Citation: Lang T, Ni C, Chen K, Xu E, Yin J, Shen X, Wu X and Zhang D (2023) Recognition of cavitation characteristics in non-clogging pumps based on the improved Lévy flight bat algorithm. Front. Energy Res. 11:1335227. doi: 10.3389/fenrg.2023.1335227
Received: 08 November 2023; Accepted: 20 November 2023;
Published: 30 November 2023.
Edited by:
Yang Yang, Yangzhou University, ChinaCopyright © 2023 Lang, Ni, Chen, Xu, Yin, Shen, Wu and Zhang. This is an open-access article distributed under the terms of the Creative Commons Attribution License (CC BY). The use, distribution or reproduction in other forums is permitted, provided the original author(s) and the copyright owner(s) are credited and that the original publication in this journal is cited, in accordance with accepted academic practice. No use, distribution or reproduction is permitted which does not comply with these terms.
*Correspondence: Desheng Zhang, emRzQHVqcy5lZHUuY24=