 Mingshun Liu1*
 Yusheng Zhao
94% of researchers rate our articles as excellent or good
Learn more about the work of our research integrity team to safeguard the quality of each article we publish.
Find out more
ORIGINAL RESEARCH article
Front. Energy Res. , 05 January 2024
Sec. Process and Energy Systems Engineering
Volume 11 - 2023 | https://doi.org/10.3389/fenrg.2023.1334565
This article is part of the Research Topic Low-Carbon Oriented Market Mechanism and Reliability Improvement of Multi-energy Systems View all 28 articles
With the increasing proportion of renewable energy, the power system inertia decreases, and the operation uncertainty rises. It brings concerns about the system frequency and operational reliability. However, the impacts of the power system frequency performance on the reliability parameters of generation units have not been fully investigated. This paper studies the frequency performance and the operational reliability co-evaluation for power systems considering wind turbines. Firstly, a power system frequency regulation model is established considering the regulation capability of wind turbines. Then, the cluster of equivalent wind turbines is incorporated into the frequency regulation architecture of thermal power units, which accelerates the analysis of frequency performance. Then, the frequency performance of the power system with the participation of wind turbines under the operation uncertainty and the unit random faults is quantitatively analyzed. A frequency-dependent generator reliability parameter model is derived. Next, a multi-time scale co-evaluation framework is proposed to realize the co-evaluation of frequency performance and operational reliability. Case studies are carried out on the modified IEEE RTS-79 system and a provincial power system. Results show that compared with the existing research, the proposed method can obtain the frequency performance and reliability results efficiently.
In line with China’s “Carbon Peak and Carbon Neutrality” policy, the installed capacity of renewable energy units is expected to experience further growth. As stated in the National Development and Reform Commission’s report ‘China’s Renewable Energy Development in 2022"(National development and reform commission of China, 2022), China’s renewable energy installed capacity is projected to reach 1.2 billion kilowatts by 2022, accounting for 47.3% of the country’s total power generation. This will result in a total renewable energy power generation of 2.7 trillion kW hours, representing 31.6% of the total electricity consumption in society. The State Grid Energy Institute has reported that China’s wind and solar installed capacity is forecasted to reach 5 billion kilowatts by 2060, constituting over 65% of the total installed capacity (Lin et al., 2022a). Wind power, being the most mature and cost-effective renewable energy technology currently, is anticipated to witness a five-fold increase in installed capacity by 2060. Consequently, renewable energy will become the primary source of electricity supply in China.
The increasing integration of renewable energy sources, coupled with the retirement of conventional synchronous units like thermal power plants, has led to heightened uncertainty in the power supply of the electrical grid. Consequently, the system’s inertia has decreased, posing challenges to the frequency security and operational reliability of the power system (Lin et al., 2023). One potential solution to address this issue is to involve wind power generators in economic dispatch and frequency regulation services (Zhang et al., 2022; Lei et al., 2022; Tang et al., 2022). In line with China’s “Guidelines for Power System Safety and Stability” implemented on 1 July 2020, wind power generators are required to possess primary frequency regulation capabilities, with a higher priority assigned to primary frequency regulation than automatic power generation control (National Power Grid Operation And Control Standardization Technical Committee, 2023). It is foreseeable that wind power generators, as an increasingly significant energy source in modern power systems, will assume more substantial responsibilities in peak load management and frequency regulation.
The expansion of wind power generators integrated into the power grid leads to system frequency fluctuations, thereby influencing unit operation and dispatch as well as potentially impacting unit outage probabilities (Wu et al., 2023). Consequently, the operational and maintenance costs of the power system are likely to increase (Yang et al., 2020). Notably, augmented frequency fluctuations can trigger protective actions, such as frequency protection measures or even generator tripping, which are considered reliability events (Zhou et al., 2021). To illustrate this point, the British blackout incident in August 2019 serves as an example. The rapid decline in system frequency, resulting from transmission line and wind turbine failures, prompted the activation of frequency protection mechanisms in distributed generators, leading to their shutdown. This further exacerbated the frequency drop, ultimately necessitating the activation of the system’s low-frequency load-shedding mechanism. Consequently, approximately 931 MW of load was disconnected, resulting in the shutdown of local industries and commerce, paralyzing transportation, and incurring significant economic losses (Owens, 2019). These events demonstrate the interconnected nature of system frequency performance and operational reliability. Therefore, it becomes imperative to conduct a comprehensive assessment of the power system’s operational reliability level and frequency performance.
Various studies have investigated methods for assessing the operational reliability of power systems considering the uncertainty of wind power. These methods include analytical approaches (Sharifinia et al., 2020), time-series Markov Monte Carlo methods (Chao et al., 2019), and Monte Carlo hybrid sampling methods (Ding, 2022; Li, 2013; Wu and Wang, 2023) is a pioneering work in the reliability evaluation for integrated electricity-gas systems considering hydrogen. (Ding et al., 2021). provides a comprehensive study for the operational reliability assessment of the integrated heat and electricity system. (Hu et al., 2021). focuses on the power system operational reliability assessment considering the decision-dependent uncertainty. These studies propose an efficient reliability evaluation method for power systems. However, they overlook the impact of frequency performance on system reliability and fail to comprehensively capture the interplay between frequency performance and reliability parameters. The uncertainty in wind power output directly leads to increased system frequency fluctuations. Then the protection device of the generation units may be triggered and even result in generator trips, which are considered reliability events. These events ultimately affect the outage probability of generating units and consequently impact the results of power system operational reliability assessments (Kundur and Malik, 2022).
Currently, there are a limited number of studies that address the comprehensive assessment of power system frequency performance and operational reliability. A collaborative frequency regulation architecture combining battery energy storage and generators is proposed in (Farivar et al., 2022) to achieve a comprehensive evaluation of frequency performance and operational reliability. (Ye et al., 2023). presents a comprehensive evaluation method considering the frequency performance reliability of interconnected power systems, considering the characteristics of high-voltage DC transmission. These studies primarily analyze the impact of frequency regulation on the output power of generators, overlooking the influence of system frequency performance on the reliability parameters of the generation units. Moreover, they fail to adequately consider the frequency regulation capabilities of wind turbine clusters and neglect factors such as the wake effect of wind turbine clusters, leading to overly optimistic reliability assessment results (Wang et al., 2020).
This study aims to address the coupling effect between power system frequency performance and generator unit reliability parameters. Contributions of this paper are.
1) Propose an analytical expression of the frequency-dependent reliability parameters for generation units. The frequency performance of the power system is quantitatively analyzed under load uncertainty and random unit failures.
2) Formulate a comprehensive assessment method that incorporates the frequency regulation capability of wind turbine clusters, which enables the comprehensive evaluation of secondary frequency dynamics and hour-level power system operational reliability.
3) Numerical examples are conducted using the modified IEEE RTS-79 system and a provincial power system to validate the accuracy of the proposed method. The results obtained from this research contribute to the verification of the method’s effectiveness and provide valuable insights for secondary frequency control and reliability optimization efforts.
The rest of this manuscript is organized as follows. Section 1 introduces the frequency regulation model of wind turbine clusters. Section 2 proposes the frequency-dependent reliability parameters of generation units and the power system operational reliability assessment model. Section 3 formulates the power system frequency-reliability comprehensive assessment framework. Case studies are illustrated in Section 4. Section 5 concludes this paper.
Doubly-fed induction generator converters (DFIG) wind turbines consist of several essential components, including wind turbines, mechanical systems, generators, converters, controllers, and associated devices, as shown in Figure 1. The primary function of the wind turbine component is to extract energy from the wind and convert it into mechanical energy. This mechanical energy is subsequently transmitted through the mechanical system, enabling the rotation of the generator. The generator, an induction machine in this case, converts the mechanical energy into electrical energy. To achieve variable speed constant frequency power generation, a converter is interconnected with the rotor of the generator. The converter plays a crucial role in regulating the excitation current frequency of the rotor, thereby maintaining a constant stator frequency. Through this control mechanism, the DFIG can operate at varying speeds while ensuring a consistent frequency of the generated electrical power.
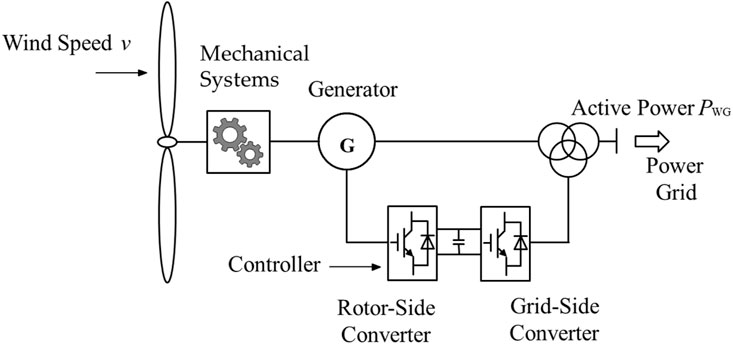
FIGURE 1. The structure of the wind turbine.
To provide frequency regulation services, DFIG works in sub-optimal power point tracking mode. In this mode, the DFIG reserves a certain amount of wind power and collects the frequency deviation of the power system
where
where
where
The relationship between the wind turbine virtual inertia factor correction coefficient and the power system frequency change rate is (Shafi et al., 2020)
where
Figure 2 shows the relationship between the output power of the wind turbine, the rotor speed, and the wind speed based on Eqs 1–5. It is assumed that before the disturbance occurs, the wind turbine operates at point A. When the system frequency decreases, the frequency changes, i.e.,
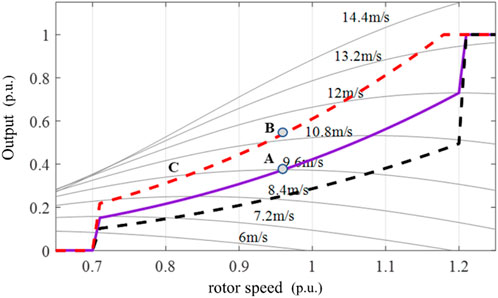
FIGURE 2. The relationship among the output power of the wind turbine, the rotor speed, and the wind speed.
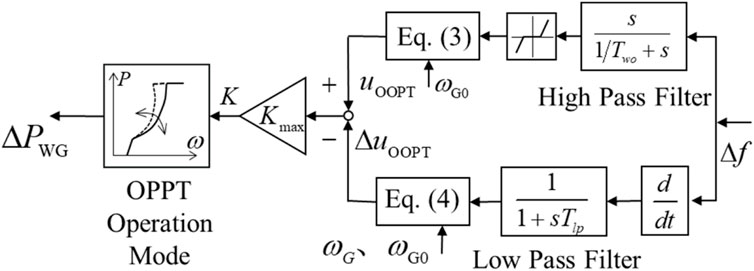
FIGURE 3. Frequency regulation model of a single wind turbine.
Since the frequency regulation capability of a single wind turbine is weak, clusters of wind turbines often participate in power system frequency regulation. In wind turbine clusters, the wake effect refers to the phenomenon that upstream wind turbines absorb part of the wind energy, thereby affecting the wind speed of downstream wind turbines. Ignoring this phenomenon will lead to overly optimistic evaluation results of power system frequency performance and reliability. This paper uses the common Jensen model to characterize the wake effect in wind turbine clusters (Zhao et al., 2021), as shown in Figure 4.
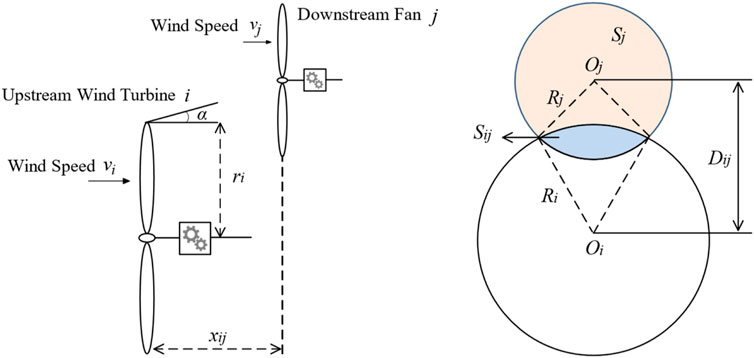
FIGURE 4. Schematic diagram of wake effect of wind turbine cluster based on Jensen model.
In Figure 4, vi is the wind speed of the upstream fan; vj is the wind speed of the down-stream fan; ri is the blade radius of the upstream fan;
Based on the Jensen model, the wind speed vj of the downstream wind turbine can be estimated as
where
When a wind turbine cluster contains hundreds or even thousands of wind turbines, it is impossible to analyze the frequency regulation capabilities of the units under the influence of the wake effect and its impact on system reliability. Therefore, this paper proposes a clustering method based on the wake effect coefficient to classify wind turbine clusters according to the wake effect coefficient of each wind turbine. The classification number is
Since the influence coefficient of the wake effect is nonlinearly related to factors such as the spatial position of the wind turbine, blade size, relative distance, etc., it presents characteristics of randomness and convexity that are difficult to guarantee. Therefore, this paper uses a density-based clustering algorithm with the wake effect coefficient as the core index to solve the problem of overestimation of wind turbine frequency regulation capabilities and power system operational reliability assessment caused by inaccurate clustering of wind turbines and inaccurate wind speed estimation. The problem with being too optimistic.
After the clustering is completed, the withstand wind speed of each type of wind turbine can be calculated. For example, the wind speed of Class B wind turbines is affected by the wake effect caused by Class A wind turbines. The wind speed is recorded as vj,B, which can be expressed as
where
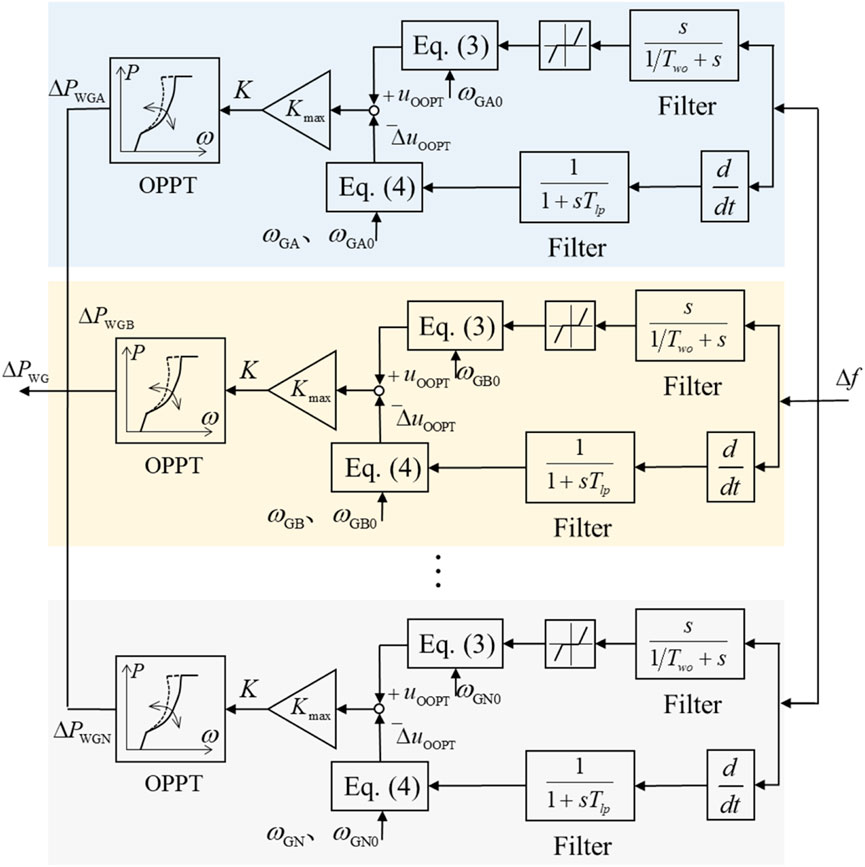
FIGURE 5. Frequency regulation model of wind turbine cluster considering the wake effect.
By incorporating the wind turbine cluster frequency regulation model, a wind turbine cluster-thermal power collaborative frequency regulation model is obtained, as shown in Figure 6.
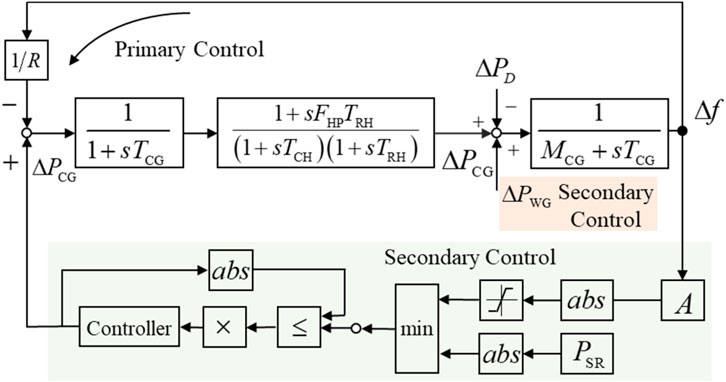
FIGURE 6. Wind turbine cluster-thermal power coordinated frequency regulation model.
The collaborative frequency regulation model between wind turbine clusters and thermal power units, as depicted in Figure 6, incorporates various factors such as the reserve capacity, ramping power limit of the thermal power unit, and the frequency regulation module of the wind turbine cluster. This model facilitates the transition from isolated analysis to integrated evaluation of these two distinct resource types, thereby extending the assessment framework. Each symbol in Figure 6 is explained as follows: R is the equivalent coefficient of the governor of the reheated thermal power generation unit; TCG is the equivalent time constant of the governor; TCH is the equivalent time constant of the steam chamber; FHP is the high-pressure power of the steam turbine. TRH is the steam turbine equivalent time constant.
Note that the set of thermal power units participating in secondary frequency regulation is
where
The reliability parameters of the generator (such as outage probability) are related to the health status of the generator, the external environment, and the system operating conditions. Specifically, the reasons for the outage of the generating set may be.
1) Actual failure of the generating set due to aging, extreme high temperature, or cold wave.
2) Abnormal operation of the system (such as frequency exceeding the limit) causes the protection device to operate and power generation The unit was not faulty but was removed from the power grid, causing an outage in a nonfaulty state.
3) Human misoperation and protection malfunction.
When establishing a generator reliability parameter model, this article focuses on the impact of reasons 1) and 2) on the generator reliability parameters due to the low probability of human misoperation and protection malfunction. The impact of reason 1) on the outage probability U of the generator is U1, and the impact of reason 2) on the outage probability U of the generator is U2. Since reasons 1) and 2) are independent events, the probability of generator outage satisfies
The Weibull model is used to describe the influence of the aging degree of the generator on the probability of outage of the generator and the probability of outage due to aging
where t is the running time of the generator in years;
Analyze the impact of reason 2) on the outage rate of generating units. The generator is equipped with a complete and sensitive relay protection system to ensure that the generator operates within a reasonable frequency range. When the generator operates within the low-frequency/high-frequency protection threshold range of the generator, the frequency does not affect the probability of outage of the generator. The probability of an outage of the generator is linked to the aging degree of the generator. Currently, U2 = 0 and U = U1. When the generator reaches the protection threshold of the generator frequency protection device, the protection device starts, and the generator is cut off from the grid. Although the generator is not faulty currently, it does not help maintain the power balance. For the power grid, the generator is equivalent to being out of service currently. Under this circumstance, the generator outage probability is 1, U = U2 = 1. In the context where the system frequency falls within the range of the normal value and the protection-action value, a direct correlation exists between the probability of generator failure and the frequency level, which can be expressed as Eq. 13
where f protects g, min and f protect g, max is the generator’s low- and high-frequency protection action values. The generator will trip when the frequency is f protect g, min or f protect g,max.
The two-state Markov model is used to describe the reliability parameter model of the generator. Based on calculating the probability of generator outage, the generator outage rate can be determined. Since the generator outage probability is related to the system frequency, without loss of generality, note
where
This paper uses reliability indicators in terms of power and probability to quantify the ability of the power system to meet users’ power frequency quality and power demand, including 1) expected energy not supplied (EENS), 2) expected indirect energy not supplied (EIENS), 3) expected number of under-frequency events (ENUF), 4) expected under frequency duration (EUFD), 5) probability of low-frequency events (LFEP) and 6) the probability of the system recovering from the low-frequency event (PRLFE). The detailed definitions of these metrics are referred to Eqs 14–21.
1) EENS represents the risk of load loss in the power system within a period and is the product of the probability of a load loss event and the amount of load loss. Let the expected power shortage be
where the set of loss-of-load events is
2) EIENS represents insufficient power during the primary and secondary frequency adjustment process. The power shortage here does not appear as load loss but as a frequency deviation of the power system. The indirect expected power shortage EIENS is defined as
where
3) ENUF represents the number of frequency limit violations within a period. The expectation of recording frequency exceeding the limit is
where
4) EUFD characterizes the duration of low-frequency phenomena within a period. The expected duration of low frequency is recorded as
where
5) LFEP is used to analyze the probability of low-frequency events in the system. The probability of occurrence of low-frequency events is recorded as
where SLFEP is the set of events that recover from low frequency to a reasonable frequency range.
This section proposes a multi-time scale power system frequency performance-reliability comprehensive assessment process to couple the power system frequency adjustment process with the reliability assessment process. The evaluation process includes three links: power system event generation, event analysis, and indicator calculation.
This article employs the enumeration method to generate states for analysis. In comparison to sequential and non-sequential Monte Carlo methods, the enumeration method offers distinct advantages, such as clearer physical interpretations and more precise evaluation results.
In the state analysis process, the impact of the frequency regulation process needs to be considered. Take an event k as an example to illustrate. In event k, firstly, the power system generates power imbalance
In the reliability metrics calculation process, the metrics are calculated based on the indicator definition and event analysis results.
The power system frequency performance-reliability comprehensive assessment process is as follows.
Step 1:. Input wind speed, wind turbine spatial position, load, traditional unit operating status, frequency control model parameters, generator unit reliability parameters, and other related parameters. The parameters of wind turbines are listed in Table 1.
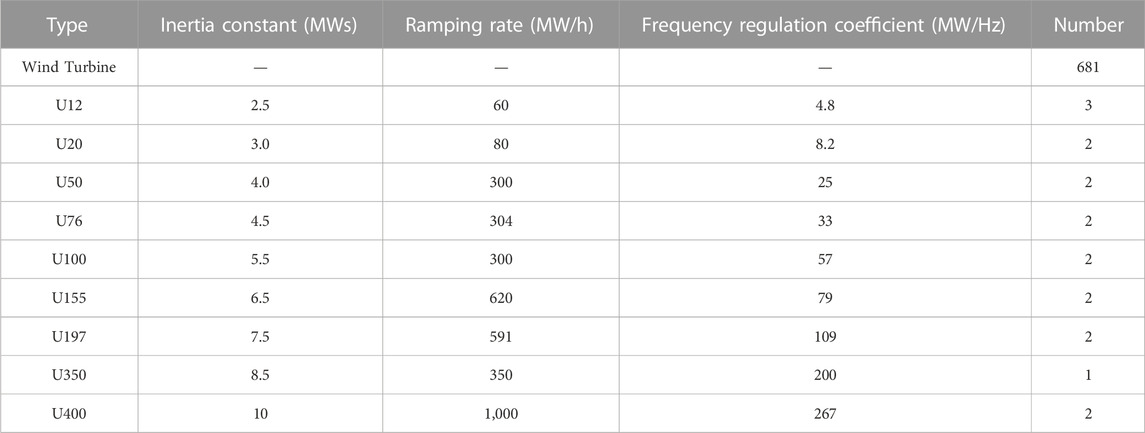
TABLE 1. The parameters of the wind turbines.
Step 2:. Use the enumeration method to generate the power system event set S. Perform status analysis on the events in the set S in turn. The status analysis is described in steps 3–6.
Step 3:. Consider the event
Step 4:. Based on the wind turbine cluster-thermal power collaborative frequency regulation model, calculate the frequency response curve of the power system.
Step 5:. According to the frequency response curve of the power system, record the frequency deviation amount at the end of the first and second frequency modulation of the system, whether the low-frequency event occurs, and its duration.
Step 6:. According to the power system frequency response curve and Equations 10–12, update the steady-state outage probability and normal operation probability of the generating unit. Update the occurrence probability pk of event k. Calculate system frequency performance and reliability metrics.
Step 7:. Check whether the entire system status has been analyzed. If not, let
This paper uses the modified IEEE RTS79 system and a provincial power system to evaluate the power system frequency performance and operational reliability. It verifies the necessity of considering the impacts of the system frequency performance on the operational reliability level.
The IEEE RTS79 system contains 9 types of conventional units and 1 wind turbine cluster. Assuming that the working life of all units is within the range of 3–5 years, the outage probability of generation units caused by aging can be calculated by Equation 11. The ramping rate, inertia constant, and frequency modulation coefficient of the generation units are referenced from (Attabo Ameh et al., 2023). The rated power of a single wind turbine is 1.5 MW, and the wind turbine control parameters can be found in (Chen et al., 2017). The wind power penetration rate is selected to be 30%. The load is set to a peak load of 2,850 MW and a load adjustment coefficient of 75 MW/Hz. The normal frequency of the system is 50 Hz, and the reasonable operating range of frequency is [49.8, 50.2] Hz. Only fault events of order 4 and below are considered in the reliability assessment. The time scale of each scenario is 1 h. It is assumed that all thermal power units participate in the primary and secondary frequency modulation of the system. Wind speed data comes from actual data from the San Cristobal Wind Farm. The revised IEEE RTS-79 system diagram is shown in Figure 7.
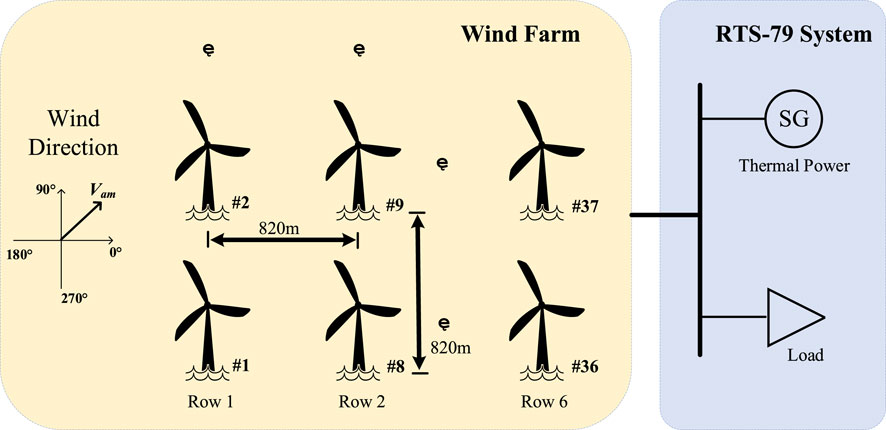
FIGURE 7. The modified IEEE RTS-79 system.
Figure 8 shows the improvement effect of wind turbines participating in system frequency control on the maximum deviation of system frequency
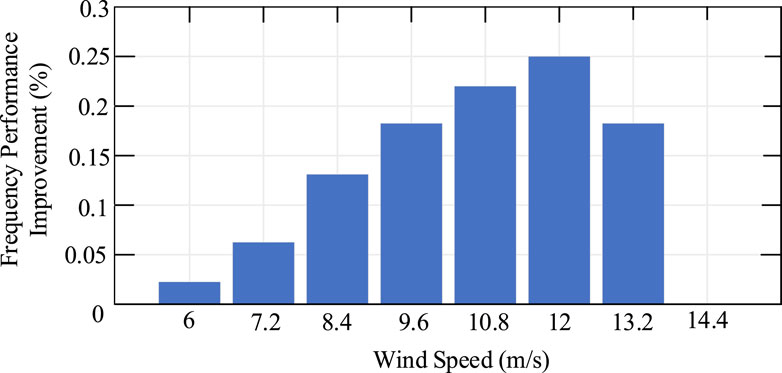
FIGURE 8. The improvement of the frequency performance with different wind speeds.
When the natural wind speed is 13.2 m/s, the wind turbines are clustered considering the wake effects. First, the wind speed of wind turbines was studied when the wind direction was 0°, as shown in Figure 9. It can be seen from Figure 9 that the wake effect has a great influence on the wind speed of the wind turbine. Therefore, it is necessary to cluster the wind turbines according to the wind speed and establish an equivalent model of the wind turbine. Table 2 shows the clustering results of wind turbines in four cases where the wind speed direction is 0°, 18°, 32° and 45°.
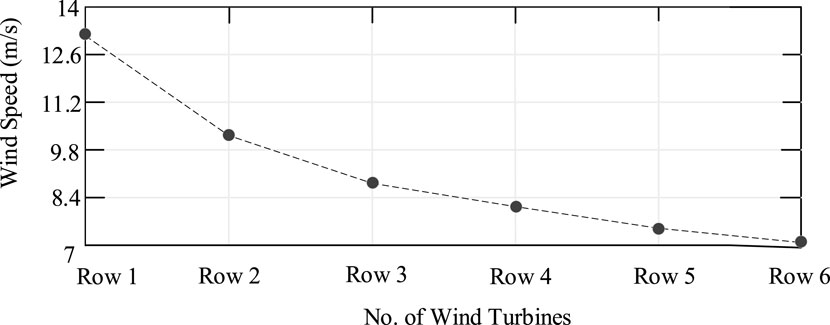
FIGURE 9. The wind speed of the wind turbine considering the wake effect.
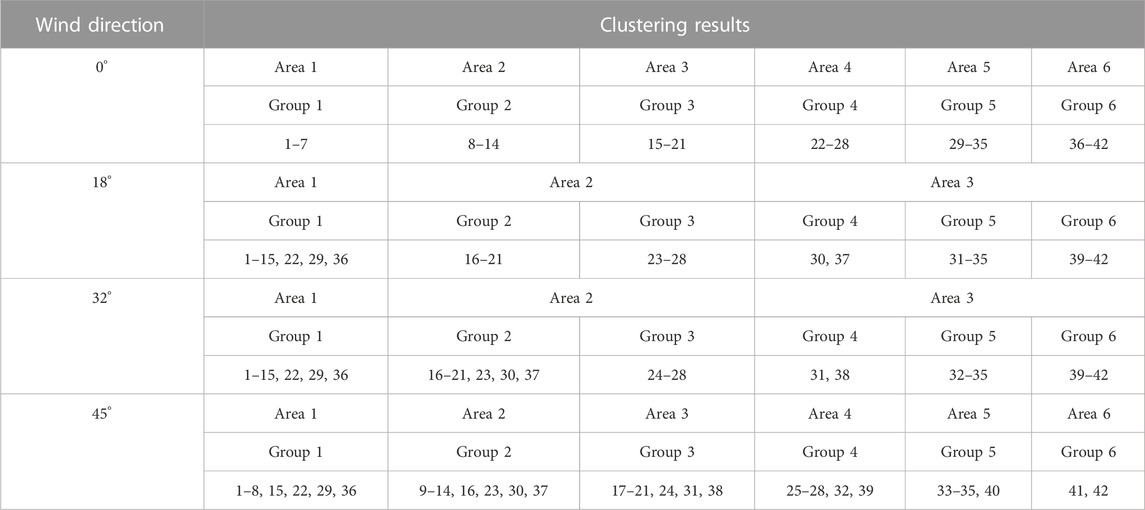
TABLE 2. Cluster results of wind turbines under different wind directions.
Figure 10 shows the natural wind speed of the wind turbine cluster is 13.2 m/s, and the wind speed of each wind turbine in different wind directions. The same wind speed is drawn in the same color. Comparing the data in Figure 10 and Table 2, it can be found that the clustering algorithm proposed in this article can cluster wind turbines with similar wind speeds into the same group, and then the equivalent wind turbine cluster model can be used, which greatly improves the efficiency of calculating frequency performance indicators.
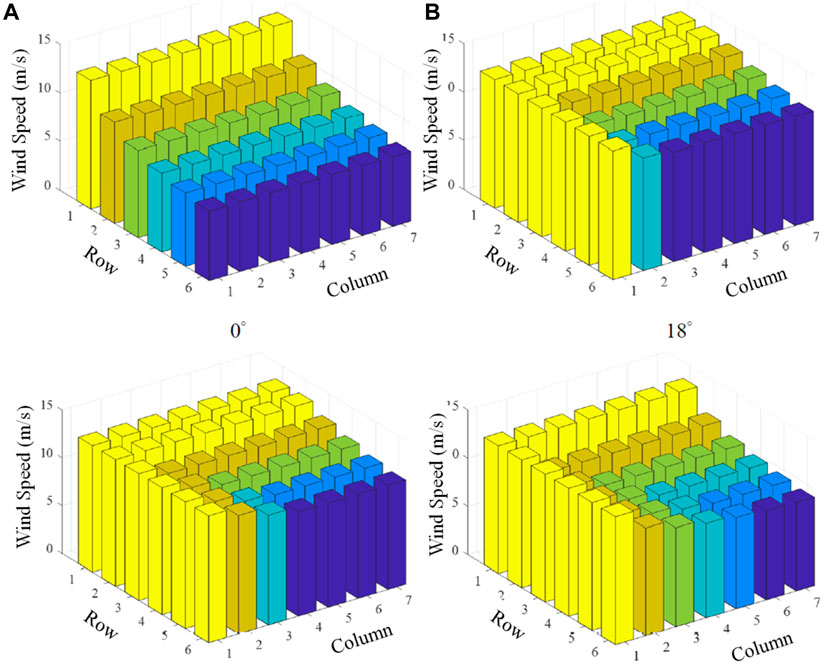
FIGURE 10. Cluster results of wind turbines under different wind directions. (A) The wind direction is 0°. (B) The wind direction is 18°. (C) The wind direction is 32°. (D) The wind direction is 45°.
Then we illustrate the accuracy of the proposed model by comparing the evaluation results of power system frequency performance-reliability with and without considering the impacts of frequency performance on the system reliability level.
Assuming that the predicted wind speed is 13.2 m/s, and the actual wind speed is 12 m/s. The absolute error of wind speed prediction is 1.2 m/s. Table 3 shows the results of the frequency performance and reliability of the power system. Situation 1 refers to considering the impacts of frequency performance on the reliability parameters of generation units. Situation 2 refers to without consideration of the impacts. From the perspective of frequency indicators, the frequency limit expectation MENUF, low-frequency duration expectation MEUFD, low-frequency event occurrence probability MLFEP and system recovery probability MPRLFE corresponding to Situation 1 are 102%, 108%, 100%, and 101.25% than the ones related to Situation 2. From the perspective of system reliability indicators, the expected power shortage MEENS and the indirect expected power shortage MEIENS corresponding to Situation 1 are 102% and 103% than the ones related to Situation 2. This shows that when the impacts of frequency performance on the reliability parameters of generation units are not considered, the reliability level of the generation units is overestimated, resulting in overly optimistic frequency performance and power system reliability evaluation results. On the other hand, the expected frequency MENUF corresponding to Situation 1 reaches 4,867.4 times/year, and the expected low-frequency duration MEUFD reaches 161.7 h/year. This shows that the reliability risks caused by frequency exceeding limits in power systems including wind power cannot be ignored.
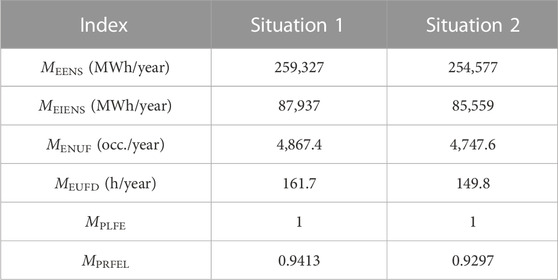
TABLE 3. The results of the frequency performance and the operational reliability.
The model proposed in this article simultaneously considers two factors: 1) the frequency regulation capability of wind turbine clusters with wake effects, and 2) the dependence of system frequency performance and generator unit reliability parameters. To illustrate the necessity of considering these two factors, four types of situations are set up for comparison:
Situation A: Both 1) and 2) are considered.
Situation B: Consider 1), but do not consider 2); that is, the dependence of the system frequency performance on the reliability parameters of the generator is ignored.
Situation C: Consider 2), but do not consider 1). Namely, the wake effect is not ignored.
Situation D: Neither factor is considered; that is, the traditional power system reliability assessment method.
Existing studies fall into three categories: Situations B to D. Table 4 shows the system’s expected power shortage MEENS and indirect expected power shortage MEIENS under four types of situations. Since traditional reliability assessment does not consider the impact of the frequency modulation process, there is no corresponding indirect expected power shortage MEIENS. Scenario A considers more comprehensive factors and can reflect more objective frequency performance and reliability evaluation results. The factors considered in scenarios B and C are lacking, and the corresponding expected power shortage MEENS and indirect expected power shortage MEIENS are smaller than those in scenario A, and the results are too optimistic.

TABLE 4. The system reliability evaluation results under four scenarios.
To verify the accuracy and scalability of the proposed method, a provincial power system located in China is employed as the testing ground. This system encompasses a considerable scale, comprising 220 generators, 1,393 buses, and 2033 transmission lines. The peak load within this provincial system reaches 38,760 MW, with an installed capacity of 64,471 MW. Notably, the enumeration of branch and generator outages is conducted up to the N-3 contingency level, while branch outages are solely enumerated up to the N-1 contingency level. For evaluation, a period of 6 h is chosen. The reliability evaluation outcomes are presented in Table 5, where Situation 1 refers to considering the impacts of frequency performance on the reliability parameters of generation units and Situation 2 refers to without consideration of the impacts.

TABLE 5. The system reliability evaluation result of the provincial power system.
This paper investigates the dependence between the power system reliability level and the system frequency performance. In this study, a power system frequency regulation model is developed that considers the regulation capabilities of wind turbines. Subsequently, an equivalent wind turbine cluster is integrated into the frequency regulation architecture of thermal power units, thereby facilitating the analysis of frequency performance. The frequency performance of the power system, considering the uncertain operation conditions and random faults of generating units, is then quantitatively examined. A model for the frequency-dependent reliability parameters of generators is derived. Furthermore, a multi-time scale co-evaluation framework is proposed to enable the simultaneous evaluation of frequency performance and operational reliability. The proposed methodology is applied to case studies involving the modified IEEE RTS-79 system and a provincial power system. The results demonstrate that the proposed approach achieves efficient determination of frequency performance and reliability outcomes, surpassing the capabilities of existing research in this domain.
Furthermore, the suggested evaluation method can be integrated into the framework of power system optimal dispatching and planning. Given the imperative coordination of economic considerations, reliability requirements, and frequency stability, it becomes essential to establish an effective long-term capacity planning approach for the power system. This methodology ensures the optimal arrangement of generating units and guarantees the system’s sustained capacity adequacy over the long term. By incorporating the proposed evaluation method into the planning process, power system operators can make informed decisions regarding the configuration of generating units, striking a balance between economic efficiency, operational reliability, and the safeguarding of frequency stability.
The raw data supporting the conclusion of this article will be made available by the authors, without undue reservation.
ML: Funding acquisition, Writing–original draft, Writing–review and editing. YZ: Conceptualization, Formal Analysis, Methodology, Writing–review and editing. LZ: Data curation, Investigation, Software, Supervision, Writing–review and editing. QC: Data curation, Formal Analysis, Project administration, Supervision, Validation, Writing–review and editing. DC: Funding acquisition, Resources, Visualization, Writing–review and editing.
The author(s) declare financial support was received for the research, authorship, and/or publication of this article. This work was supported by the Key Science and Technology Project of China Southern Power Grid under a grant (No. 066500KK52222013).
Authors ML and LZ were employed by Power Dispatching and Control Center of Guizhou Power Grid Company. Author DC was employed by China Southern Power Grid.
The remaining authors declare that the research was conducted in the absence of any commercial or financial relationships that could be construed as a potential conflict of interest.
All claims expressed in this article are solely those of the authors and do not necessarily represent those of their affiliated organizations, or those of the publisher, the editors and the reviewers. Any product that may be evaluated in this article, or claim that may be made by its manufacturer, is not guaranteed or endorsed by the publisher.
Attabo Ameh, A., Ajayi Oluseyi, O., Oyedepo Sunday, O., and Afolalu Sunday, A. (2023). Assessment of the wind energy potential and economic viability of selected sites along Nigeria’s coastal and offshore locations. Front. Energy Res. 11, 1186095. doi:10.3389/fenrg.2023.1186095
Chao, H., Hu, B., Xie, K., Tai, H. M., Yan, J., and Li, Y. (2019). A sequential mcmc model for reliability evaluation of offshore wind farms considering severe weather conditions. Ieee Access 7 (1), 132552–132562. doi:10.1109/access.2019.2941009
Chen, L., Wang, P., Han, X., Qin, W., Billinton, R., and Li, W. (2017). Operational reliability and economics of power systems with considering frequency control processes. Ieee Trans. Power Syst. 32 (4), 2570–2580. doi:10.1109/tpwrs.2016.2632157
Ding, J. (2022). Reliability evaluation and tracing for power systems integrated with wind power considering epistemic uncertainty [D]. Chongqing: Chongqing University.
Ding, Y., Shao, C., Hu, B., Bao, M., Niu, T., Xie, K., et al. (2021). Operational reliability assessment of integrated heat and electricity systems considering the load uncertainties. Ieee Trans. Smart Grid 12 (5), 3928–3939. doi:10.1109/tsg.2021.3081602
Farivar, G. G., Manalastas, W., Tafti, H. D., Ceballos, S., Sanchez-Ruiz, A., Lovell, E. C., et al. (2022). Grid-connected energy storage systems: State-of-the-art and emerging technologies. Proc. IEEE.
Hu, B., Pan, C., Shao, C., Xie, K., and Niu, T. (2021). Decision-dependent uncertainty modeling in power system operational reliability evaluations. Ieee Trans. Power Syst. 36 (6), 5708–5721. doi:10.1109/tpwrs.2021.3081765
Huang, L., Wu, C., Zhou, D., Chen, L., Pagnani, D., and Blaabjerg, F. (2023). Challenges and potential solutions of grid-forming converters applied to wind power generation system—An overview. Front. Energy Res. 11, 1040781. doi:10.3389/fenrg.2023.1040781
Kundur, P., and Malik, Om (2022). Power system stability and control [M]. 2nd Edition. New York: Mcgraw-Hill Education.
Lei, J., Yuan, Z., Bai, H., Su, S., Yang, J., Li, W., et al. (2022). Economic dispatch of distribution network with dispersed wind power considering network reconfiguration. Front. Energy Res. 10 (2022), 942350.
Li, W. (2013). Reliability assessment of electric power systems using Monte Carlo methods. Springer Science & Business Media, 2013.
Lin, C., Hu, B., Shao, C., Li, W., and Xie, K. (2022a). Delay-dependent optimal load frequency control for sampling systems with demand response. IEEE Trans. Power Syst. 37 (6), 4310–4324. doi:10.1109/tpwrs.2022.3154429
Lin, C., Hu, B., Shao, C., Niu, T., and Cheng, Q. (2022b). An analysis of delay-constrained consensus-based optimal algorithms in virtual power plants. Isa Trans. 125, 189–197. doi:10.1016/j.isatra.2021.06.035
Lin, C., Hu, Bo, Shao, C., Ye, Y., Tai, H. M., Xie, K., et al. (2023). Event-triggered load frequency control based on age-of-information. IEEE Trans. Power Syst. 38 (3), 2348–2361. doi:10.1109/tpwrs.2022.3186333
Liu, Y., Wang, Y., Wang, Q., Zhang, K., Qiang, W., and Wen, Q. (2023). Recent advances in data-driven prediction for wind power. Front. Energy Res. 11, 1204343. doi:10.3389/fenrg.2023.1204343
National development and reform commission of China (2022). China's renewable energy development in 2022. Available at: https://www.ndrc.gov.cn/fggz/hjyzy/jnhnx/202302/t20230215_1348799.html.
National Power Grid Operation And Control Standardization Technical Committee (2023). Guidelines for power system security and stability: gb38755-2019 [M]. Beijing: China Standard Press.
Owens, C. (2019). Blackout – everything you need to know [Z]. Available at: Https://Www.Theblackoutreport.Co.Uk/2021/08/09/9-August-2019-Blackout/(Accessed August 9, 2019).
Shafi, A., Hussein, S., and Shima, H. (2020). Design of optimal power point tracking controller using forecasted photovoltaic power and demand. Ieee Trans. Sustain. Energy 11 (3), 1820–1828. doi:10.1109/tste.2019.2941862
Sharifinia, S., Rastegar, M., Mehdi, A., and Fotuhi-Firuzabad, M. (2020). Inverse reliability evaluation in power distribution systems. Ieee Trans. Power Syst. 35 (1), 818–820. doi:10.1109/tpwrs.2019.2952518
Tang, Y., Yang, C., Yan, Z., Xue, Y., and He, Y. (2022). Coordinated control of a wind turbine and battery storage system in providing fast-frequency regulation and extending the cycle life of battery. Front. Energy Res. 10, 927453. doi:10.3389/fenrg.2022.927453
Wang, Y., Vijay, V., Mojdeh, K., and Singh, C. (2020). Composite system reliability evaluation with essential reliability services assessment of wind power integrated power systems. Ieee Open Access J. Of Power And Energy 7 (1), 403–413. doi:10.1109/oajpe.2020.3029119
Wu, T., and Wang, J. (2023). Reliability evaluation for integrated electricity-gas systems considering hydrogen. Ieee Trans. Sustain. Energy 14 (2), 920–934. doi:10.1109/tste.2022.3229896
Wu, X., Shen, Z., Fan, X., and Yang, L. (2023). Short-term wind power prediction based on anomalous data cleaning and optimized lstm network. Front. Energy Res. 11, 1268494. doi:10.3389/fenrg.2023.1268494
Yang, X., Yang, Y., Liu, Y., and Deng, Z. (2020). A reliability assessment approach for electric power systems considering wind power uncertainty. Ieee Access 8 (1), 12467–12478. doi:10.1109/access.2020.2966275
Ye, C., Guo, L., Ding, Y., Ding, M., Wang, P., and Wang, L. (2023). Reliability assessment of interconnected power systems with hvdc links considering frequency regulation process. J. Of Mod. Power Syst. And Clean Energy 11 (2), 662–673. doi:10.35833/mpce.2021.000491
Zhang, T., Yan, X., Zhang, R., Ye, Q., and Ma, J. (2022). Optimized dispatching for integrated energy system with wind power. Front. Energy Res. 10, 917805. doi:10.3389/fenrg.2022.917805
Zhao, X., Lin, Z., Fu, B., and Gong, S. (2021). Research on frequency control method for micro-grid with a hybrid approach of FFR-OPPT and pitch angle of wind turbine. Int. J. Of Electr. Power and Energy Syst. 127 (1), 106670. doi:10.1016/j.ijepes.2020.106670
Keywords: renewable energy, wind turbines, power system reliability, frequency regulation, risk evaluation
Citation: Liu M, Zhao Y, Zhu L, Chen Q and Chang D (2024) Co-evaluation of power system frequency performance and operational reliability considering the frequency regulation capability of wind power. Front. Energy Res. 11:1334565. doi: 10.3389/fenrg.2023.1334565
Received: 07 November 2023; Accepted: 11 December 2023;
Published: 05 January 2024.
Edited by:
Minglei Bao, Zhejiang University, ChinaReviewed by:
Yizhou Zhou, Hohai University, ChinaCopyright © 2024 Liu, Zhao, Zhu, Chen and Chang. This is an open-access article distributed under the terms of the Creative Commons Attribution License (CC BY). The use, distribution or reproduction in other forums is permitted, provided the original author(s) and the copyright owner(s) are credited and that the original publication in this journal is cited, in accordance with accepted academic practice. No use, distribution or reproduction is permitted which does not comply with these terms.
*Correspondence: Mingshun Liu, bG1zMjgwMEBxcS5jb20=
Disclaimer: All claims expressed in this article are solely those of the authors and do not necessarily represent those of their affiliated organizations, or those of the publisher, the editors and the reviewers. Any product that may be evaluated in this article or claim that may be made by its manufacturer is not guaranteed or endorsed by the publisher.
Research integrity at Frontiers
Learn more about the work of our research integrity team to safeguard the quality of each article we publish.