 Li Zhang1
 Xin Zhang
94% of researchers rate our articles as excellent or good
Learn more about the work of our research integrity team to safeguard the quality of each article we publish.
Find out more
ORIGINAL RESEARCH article
Front. Energy Res., 03 January 2024
Sec. Process and Energy Systems Engineering
Volume 11 - 2023 | https://doi.org/10.3389/fenrg.2023.1333907
This article is part of the Research TopicLow-Carbon Oriented Market Mechanism and Reliability Improvement of Multi-energy SystemsView all 28 articles
In the process of promoting energy green transformation, the optimization of regional integrated energy system faces many challenges such as cooperative management, energy saving and emission reduction, as well as uncertainty of new energy output. Therefore, this paper proposes a multi-agent game operation method of regional integrated energy system based on carbon emission flow. First, this paper establishes a carbon emission flow calculation model for each subject, and proposes a comprehensive tariff model based on the carbon emission flow, which discounts the carbon emissions from the power supply side to the power consumption side. Secondly, considering the interests of each subject, this paper establishes the decision-making model of each subject. And the new energy uncertainty, the cost of energy preference of prosumers, and the thermal inertia of buildings are considered in the decision model. Finally, the model is solved using differential evolution algorithm and solver. The case study verifies that the comprehensive electricity pricing model based on carbon emission flow developed in this paper can play a role in balancing economy and low carbon.
As greenhouse gas emissions continue to climb, it is required to fundamentally change the traditional way of production and life and promote the green and low-carbon transformation of energy (Tong et al., 2019). In this context, regional integrated energy system (RIES) has been developed significantly due to its advantages in meeting diversified energy demand and improving energy utilization efficiency (Zhu et al., 2022; Su et al., 2023; Wang et al., 2023). With the development of RIES, a system of multi-agent interaction is further formed, which provides a platform support for the sharing and mutual aid of dispatchable resources (Liu et al., 2020). Each subject within the RIES has different objectives and does not support other subjects “unconditionally” (Li et al., 2020). Therefore, it is very important to deeply study the operation of multi-agent game of regional integrated energy system.
The study of optimal operation schemes for integrated energy systems is one of the current hot issues. Ming et al. (2021) proposed an optimized scheduling scheme based on a multi-agent system composed of system layer, network layer, energy center layer and local layer. Ma et al. (2021) establishes a compact model of cogeneration system to solve the problem of uncoordinated energy supply flexibility and conversion efficiency of integrated energy system. Liu et al. (2019) considers the constraints of multi-energy systems and achieves the effect of improving clean energy consumption based on the optimization model of multi-demand response. The above studies focus on the perspective of IES optimization operation, but do not consider the conflict between multiple players in the operation process.
The introduction of the game idea in the optimized operation of integrated energy system provides a method for the study of solving the problem of interests among multi-agents. The method of game is an effective means to solve the conflict between different interest players (Liu et al., 2018). Zhou et al. (2019) combined the auxiliary service model and the economic operation model to construct the Stackelberg game model of users and operators, and proved the existence of a unique equilibrium solution of the model in the game process. Wang et al. (2020) proposed a Stackelberg game model based on the energy seller and load aggregator as players to obtain a RIES distributed cooperative optimized scheduling scheme, which led to a significant increase in both system and customer consumption surplus. Cong et al. (2018) constructed a two-tier optimization coalition game model with the upper layer on the energy supply side and the lower layer on the customer demand side, taking into account the demand response, which improves the economy and flexibility of the system’s energy hubs to collaborate with each other. Chen et al. (2022) considered the cooperative relationship between multiple microgrids and adopted Nash bargaining to accomplish the reasonable distribution of benefits among different players. Li et al. (2023) studied the master-slave game operation strategy with energy retailer, supplier and user as the players to improve the operational stability of the integrated energy system. Numerous explorations of game models have been conducted in existing research results, but little research has been conducted on the game interactions among distribution network operator, distributed energy station, and prosumer in RIES.
On the demand side of energy, the rational utilization of demand response resources of users such as prosumers is one of the hot issues in integrated energy system. Most of the existing studies are about a single type of demand response behavior (Cui et al., 2020; Chen et al., 2021). He et al. (2017) proposed mathematical models of demand response resources and methods for optimal operation. Yang et al. (2020) adjusts the integrated demand response by setting prices for multiple energy sources to get greater profit. Wang et al. (2020b) investigated the demand response evaluation of RIES based on an improved material-element model. In the above studies, there are fewer studies on the satisfaction requirements of prosumers in the multi-agent game in pursuit of maximizing the effectiveness of acquisition.
In addition, under low-carbon requirements, integrated energy system usually introduces carbon emissions as part of the model objective function or as a constraint to achieve emission reduction (Zhang et al., 2022). Li et al. (2012) proposes carbon capture power plant scheduling strategies to achieve emission reduction under the constraint of carbon emission reduction targets. Some studies introduced the carbon trading mechanism in the objective function and verified that the introduction of carbon trading mechanism can effectively reduce carbon emissions (Wei et al., 2016; Lu et al., 2017; Qu et al., 2018). From the perspective of promoting renewable energy consumption and thus reducing carbon emissions, Lu et al. (2018) and Wei et al. (2017) proposes scheduling strategies to smooth out net load fluctuations and increase new energy consumption for wind power consumption in electric and thermal integrated energy systems. However, the above studies only consider from the source side, based on the idea that demand generates supply, how to measure the demand-side carbon emissions and make full use of demand-side resources to participate in the system scheduling deserves attention.
As mentioned above, in the optimization operation problem of RIES, there are fewer researches that comprehensively consider the characteristics of multi-energy coupling, carbon emission flow, market mechanism, satisfaction of producers and prosumers, and multi-agent game problems. In this paper, a multi-agent game operation method of regional integrated energy system based on carbon emission flow is proposed in the context of multi-agent game, aiming at the reasonable benefit distribution among multi-agents, low-carbon operation, the influence of uncertainty factors, and the influence of users’ satisfaction of energy acquisition. First, the RIES structure and multi-agent game framework are constructed. Second, the integrated electricity price model based on carbon emission flow is established. After that, the interests of each player are considered and the decision-making model of each player is established. And the uncertainty of new energy, the satisfaction function of prosumer, and the virtual energy storage of buildings are considered in the decision model. Finally, the differential evolution algorithm (DE) and solver are utilized to solve the model, and the proposed model is verified through examples to be significant for improving the economy and low-carbon of the integrated energy system.
The main contributions of this paper are as follows:
1) This paper proposes a comprehensive electricity price model based on carbon emission flow. Integrating the carbon emission flow of each subject into the formulation of electricity price and establishing a price mechanism that takes into account carbon policies such as carbon tax and carbon emissions can better guide the energy use behavior of users.
2) This paper develops a two-layer Stackelberg game framework based on the distribution system operator, distributed energy stations, and prosumers. The distribution system operator, as a leader, has the objective of maximizing revenue and deciding the electricity price. The lower tier followers aim at maximizing their own interests and decide their own equipment output and energy use behaviors.
3) In the game model established in this paper, the satisfaction function is used in the objective function of the prosumer to describe the energy use preference of the prosumer. It reflects the impact of comprehensive electricity price on prosumer’s energy use behavior. In addition, since indoor temperature changes take a period of time, this paper employs the thermal inertia of buildings constraint to characterize the thermal demand of prosumers.
Regional integrated energy system is a multilevel complex coupled system of multiple energy inputs, transformations, and outputs (Wang et al., 2020c), consisting of the main bodies of distribution grids, distributed energy stations, and prosumers. The system involves the coupling of electrical energy, natural gas and thermal energy. The structure of RIES is shown in Figure 1. Among them, the energy station includes a variety of energy coupling devices, generally combined heating and power units (CHP), heat pump (HP), gas boilers (GB) electric energy storage (EES), thermal energy storage (TES), and renewable energy power generation equipment.

FIGURE 1. Structure of RIES.
The multiple players in the RIES studied in this paper are the distribution system operator (DSO), distributed energy station (DES), and the prosumer. The DSO seeks to maximize its own revenue, while the DES and the prosumer seek to optimize their performance according to their own demand for electricity and heat as well as their own satisfaction. These three parties constitute a competitive game relationship.
The RIES multi-agent master-slave game interaction framework is shown in Figure 2. DSO, DES and prosumer formulate trading strategies based on their own interests and environmental benefits, optimize the internal operation state and satisfy diversified load demands. DSO is the coordinator and the dominant player in the game, which is responsible for optimizing the electricity price and maintaining the power balance. The interaction between the DSO and the lower level players is a typical Stackelberg game. DES is a follower in the game, which contains various types of energy conversion equipment and wind turbines, and aims to maximize its own revenue. Prosumer is a follower in the game, and its load contains a portion of adjustable load. And the Prosumer is not sensitive to thermal induction, this paper uses virtual energy storage to describe its thermal load.
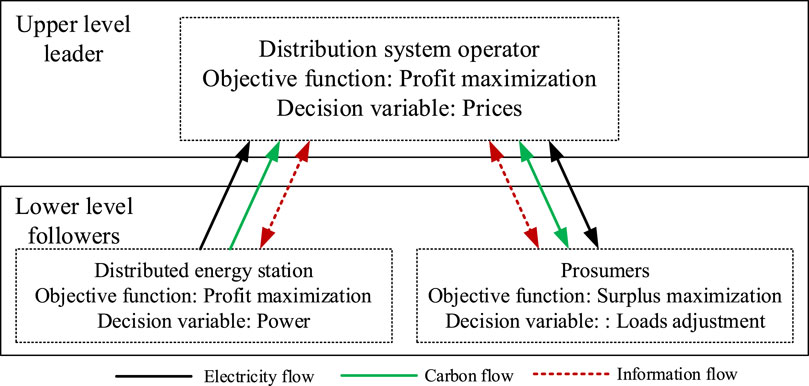
FIGURE 2. Multi-agent game framework.
The integrated energy system multi-agent game can incentivize small energy consumer, prosumer to exchange energy with each other in a competitive market, and its optimal scheduling research has received widespread attention (Liu et al., 2018). One of the important issues in RIES operation research is how to rationalize pricing. In order to achieve the purpose of energy saving and emission reduction and rational utilization of energy, this paper proposes a comprehensive electricity pricing model based on carbon emission flow. This paper incorporates carbon emission indicators into the calculation of electricity price to better guide the energy use behavior of prosumers.
In order to model a comprehensive electricity price based on carbon emission flow, it is necessary to model the carbon emission flow of each player within its IES. Ac-cording to the literature (Kang et al., 2012), it is known that the carbon emission flow of each player is the weighted average of the carbon emission intensity of all injected electricity. Based on this theory, this paper models the carbon emission flows in RIES. In this paper, it is assumed that the grid power supply is generated from thermal power generation.
where,
If the energy demand of prosumer exceeds its own PV generation, the carbon emission flow of DSO at this time is as follows.
where
If the energy demand of prosumer can be satisfied by its own PV, the carbon emission flow of the DSO is as follows.
At this point, the carbon emission flow from prosumer is 0 because the electricity produced by prosumer is generated by PV.
For the DES, it can sell the excess electricity to the distribution system operator after meeting its own electricity and heat demand. Therefore, the carbon emission flow of the energy station is calculated as:
where
The process of electricity production, transmission and distribution needs to go through a series of complex processes, so it is difficult for prosumer and other users to sense the incentives of electricity price in a timely and accurate manner (Cheng et al., 2018). The key to the multi-agent game of IES lies in the transmission of price information. This paper first analyzes the carbon emission flow among the agents to lay the foundation for the establishment of a comprehensive electricity price model. The comprehensive electricity price consists of a basic electricity price and a carbon cost, where the DSO decides the basic electricity price. The comprehensive tariff model links the price of electricity in each time period to the carbon emission stream by considering carbon policy factors such as carbon emissions and carbon taxes. The method transmits information from the source side to the users, which can better guide the energy use behavior of prosumers.
where
In the proposed Stackelberg game model, the distribution system operator, as a leader, will decide the price of electricity and purchase electricity from the grid based on the energy demand to gain profit. The distribution system operator has profit maximization as its objective function.
where
When the prosumer needs to purchase electricity externally, the profit from the interaction between the prosumer and the DSO is:
Prosumer sells additional electricity after satisfying its own demand. The profit of interaction between prosumer and DSO is:
where
The DES produces electricity through WT and CHP, and the excess electricity is purchased by the DSO after meeting the load demand in the energy station. The cost of purchasing electricity from the DES by the distribution system operator is:
The maintenance cost of the distribution system operator is calculated by multiplying the unit price of maintenance cost by the power of the superior grid, which is expressed as follows:
where
1) Power balance constraint
The DSO is responsible for the transmission and distribution of electrical energy, so the electrical power balance constraint is:
2) Security operational constraint
The DSO needs to satisfy the security constraint during operation, and the power interacting between the DSO and the grid cannot exceed the specified upper limit.
3) Other constraint
In order to ensure that prosumer is motivated to trade with the DSO, the purchase and sale price of electricity decided by the DSO should satisfy the following constraints:
where
The energy station regulates the output of each equipment within the energy station according to the price set by the DSO. The energy station has the objective of maximizing the profit.
where
The DES can produce electricity and heat through the use of gas, allowing for the inter-conversion of energy sources, while also reducing costs and pollution. In the DES, the equipment that uses gas are CHP and GB. The cost of gas consumption is calculated as follows:
where
The operating cost of each equipment in the DES is calculated as follows:
where
1) Power balance constraint
The balance of electric and thermal power is to be satisfied inside the energy station with the following expression.
where
2) Security operational constraint
The security operational constraint of the equipment is to ensure the safe operation of all kinds of equipment, mainly considering the power upper limit and the maximum ramping rate constraints of each equipment in DES.
where
Prosumers aim to minimize their own energy costs. Based on the comprehensive electric pricing strategy and utilizing demand response and building thermal inertia, prosumers actively participate in the master-slave game to reduce their energy costs while meeting their energy requirements. Due to the existence of the thermal inertia of the building and the heat load of the prosumer is not large, the heat demand of the prosumer is satisfied through the conversion of electric energy.
The energy preference cost of the prosumer, the cost of interacting with the DSO and the operation cost of the PV are considered in the objective function.
where
The operating cost of the PV is proportional to its output, and the expression is as follows.
where
where
where
1) Operation constraint
The sale and purchase of electricity between DSO and prosumer cannot be carried out at the same time. And the PV output needs to be less than the maximum output power.
2) Electric load demand response constraint
The basic electric load requires high reliability to meet the basic production and living needs of users, and cannot be changed arbitrarily, so it does not participate in demand response. Adjustable electric loads participate in demand response.
3) Thermal inertia of buildings constraint
In integrated energy system, buildings have large thermal inertia. Due to the inherent thermal inertia of buildings, it takes a certain amount of time for the indoor temperature to change, and after a sudden interruption or increase or decrease in the thermal energy provided by the system, the indoor temperature of the building will not change immediately, but will reach a new temperature after a certain period of time. So the thermal load can be regulated within a comfortable temperature range.
Since buildings have thermal inertia of buildings, the thermal needs of prosumers can be met by maintaining the room temperature within the comfort range. In order to describe the indoor temperature variation in a building, this paper uses a building energy model based on a thermal resistance and thermal capacity network (Chen et al., 2021).
where
The temperature variation constraints inside the prosumer’s room, and the comfortable temperature range expressions are as follows.
where
During the actual energy station operation, there is uncertainty in the output of the wind turbines and photovoltaic equipment. And it is often difficult to obtain the exact probability density function in real system decision-making, while it is relatively easy to obtain the range of values of uncertain variables (Wang et al., 2014; Bai et al., 2017). Interval mathematical programming (IMP) methods are capable of handling uncertain information in the form of intervals, with interval linear programming methods being the most widely used in energy planning under complex and uncertain conditions.
The general form of IMP model is:
where
Interval mathematical programming method generally transform a model containing an uncertain problem into two sub-models of a deterministic problem to be solved, so that the objective value
In this paper, the IMP is used to deal with the WT and PV output uncertainty problem, which represents
This paper uses
where
where
The Stackelberg game model is developed based on the competitive relationship between DSO, DES and prosumer. where DSO acts as the leader, DES and prosumer act as the follower. In the game process, the upper level leader sets the price of each electric energy with the goal of obtaining its own maximum net profit, and the lower level followers will take into account the maximum comprehensive efficiency and their own satisfaction to formulate a suitable energy demand program.
The strategy of the DSO is
Considering the privacy problem of each player, this paper adopts the differential evolution algorithm as well as the CPLEX solver to solve the multi-agent game model. Figure 3 shows the flowchart of the algorithm. The DE algorithm designs the computational factors by simulating the hybridization and mutation in the genetic process, and optimizes the updating of the offspring population by using the difference between the parent vectors, which leads to the optimal solution of the given problem after several iterations (Zhang et al., 2023). The basic steps of DE can be summarized into 4 steps: selection, variation, crossover and selection.
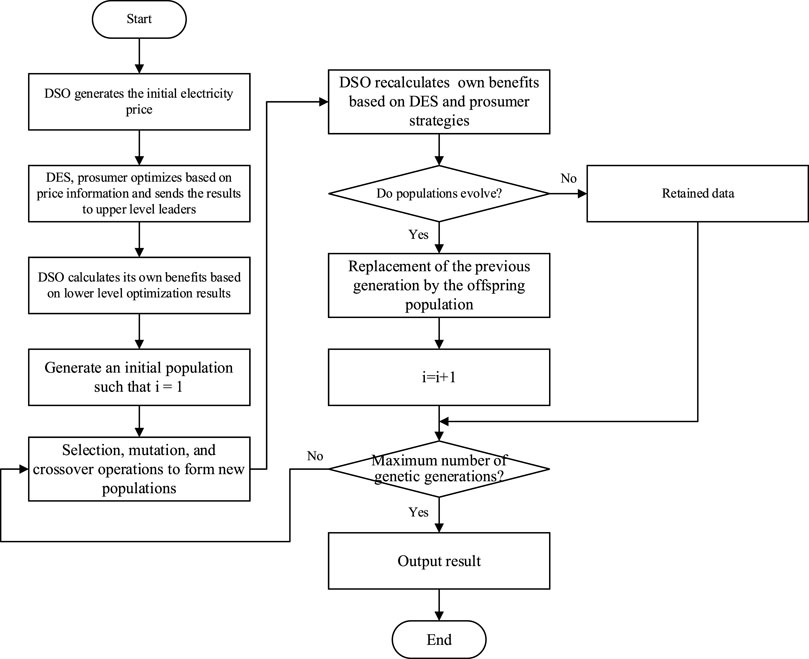
FIGURE 3. Solving flow chart.
The decision of the upper level leader DSO is a nonlinear optimization problem. The DE algorithm can solve it quickly and accurately. Among the followers, the objective functions of energy station and prosumer can be solved directly using the CPLEX solver. During the solving process, the optimization results of the followers are passed to the upper level leader, who makes decisions based on the information and passes them to the lower level. The final result can be solved through continuous iteration (Liu et al., 2017).
The data of the cases in this paper are selected from a typical regional integrated energy system. The multi-agent game model established in this paper is applied to simulate the operation optimization of this regional integrated energy system to verify the effectiveness of the method proposed in this paper. According to the load characteristics and geographical characteristics of the region, the energy station is equipped with CHP, GB, WT, HP, and energy storage devices; the prosumer is equipped with PV. The basic parameters required for the case include equipment parameters, load parameters, and new energy output parameters. The variation curves of wind speed and light intensity in the region are shown in Figure 4, the parameters of each equipment are shown in Table 1, and the electric and thermal load demand in the region is shown in Figure 5.
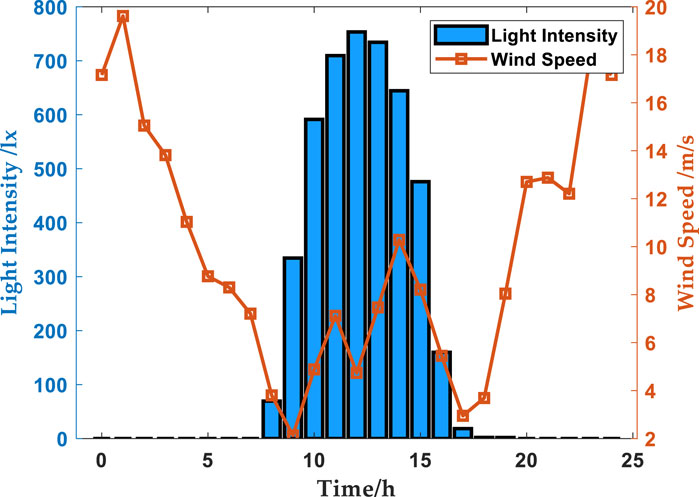
FIGURE 4. Wind speed and light intensity.
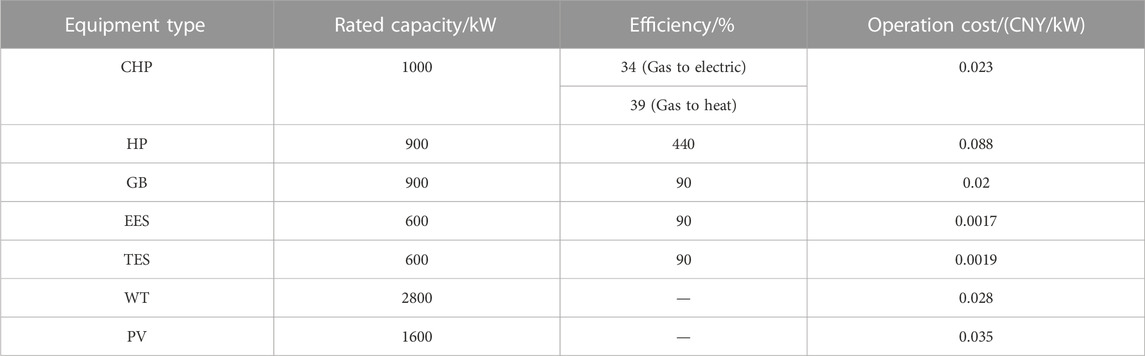
TABLE 1. Types and parameters of equipment.
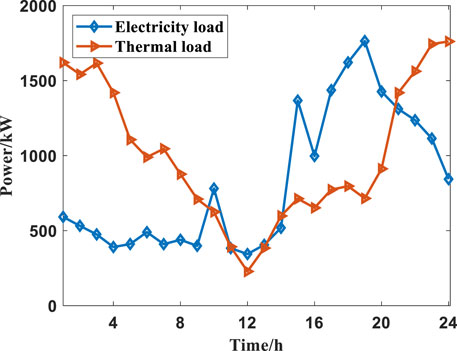
FIGURE 5. Electrical and thermal loads on a typical day.
Based on the above data, the following scenarios are set up for comparison in order to analyze the impacts of comprehensive electricity price, wind power output uncertainty, and demand response on the regional integrated energy system.
Scenario 1: Considering demand response, no comprehensive electricity price and no uncertainty.
Scenario 2: Considering demand response and comprehensive electricity price of electricity, carbon tax
Scenario 3: Demand response is not considered, comprehensive electricity price is considered, carbon tax
Scenario 4: Considering demand response and comprehensive electricity price of electricity, carbon tax
Scenario 5: Considering demand response and comprehensive electricity price of electricity, carbon tax
In order to demonstrate the effect of the comprehensive electricity price model based on the carbon emission flow theory on the energy station and distribution system operator in the region in terms of carbon reduction, Table 2 shows the data comparison before and after the application of the comprehensive electricity price model with different carbon tax prices.
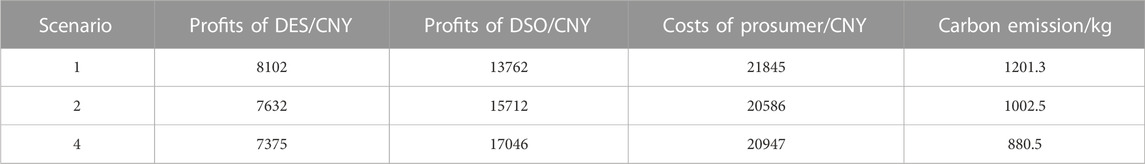
TABLE 2. Effectiveness of comprehensive electricity price model.
Comparing scenario 1 and scenario 2, the effectiveness of the comprehensive electricity price model developed in this paper in terms of energy saving and emission reduction benefits is analyzed. The DES’s benefit increases by 14.5%, which is due to the higher price of electricity sold by the distribution system operator after taking into account the carbon emission and carbon tax, thus increasing the benefit. However, DES and prosumer experience a slight decrease in their revenues due to the additional costs associated with the carbon tax. The carbon emissions of scenario 2 decreased by 12.1% compared to scenario 1, proving the effectiveness of the method of the invention for reducing carbon emissions.
The sensitivity of RIES to carbon tax price is analyzed comparing scenario 2 and scenario 4. After the carbon tax price is raised to 0.2 CNY/kgCO2, the revenue of the energy station further decreases and the cost of prosumer increases. However, there is a significant reduction in carbon emissions. It can be seen that the method proposed in this paper can reduce the system carbon emissions by sacrificing part of the economy.
In order to accurately analyze the effect of the comprehensive electricity price, this paper compares the change in electricity price before and after considering the carbon emission flow. Figure 6A shows the price of electricity sold by this DSO during a typical day, and Figure 6B shows the price at which the DSO purchases excess electricity from the energy station. The variation of electricity price over time reflects the time-varying characteristics of the load and the carbon emission characteristics of the energy producing equipment. When the load is large and in the peak period of electricity consumption, the purchase and sale price of electricity is higher; when the load is small and in the trough period of electricity consumption, the purchase and sale price of electricity is lower. When the new energy equipment output of the DES is large enough, the carbon emission intensity of each node in the system decreases, at which time the price of electricity sales is lower and the price of electricity purchases is higher; when the new energy equipment output of the DES is lower, the carbon emission intensity of each node in the system is larger, at which time the price of electricity sales is higher and the price of electricity purchases is lower.
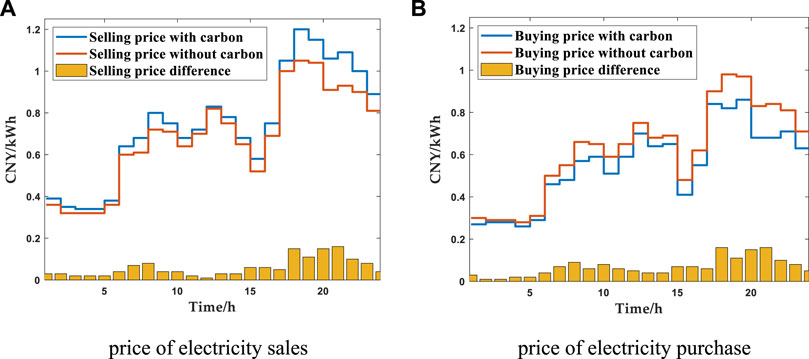
FIGURE 6. DSO electricity price comparison. (A) price of electricity sales (B) price of electricity purchase.
The effect of the comprehensive electricity price shows that the operational status of the equipment within the energy station and the comprehensive electricity price in-fluence each other. Therefore, it is necessary to analyze the operating state of the DES. The operation simulation is carried out for the electric and thermal loads and wind power data in this paper, and the electric power balance scheduling results and thermal power balance scheduling results are obtained, as shown in Figures 7, 8, respectively.
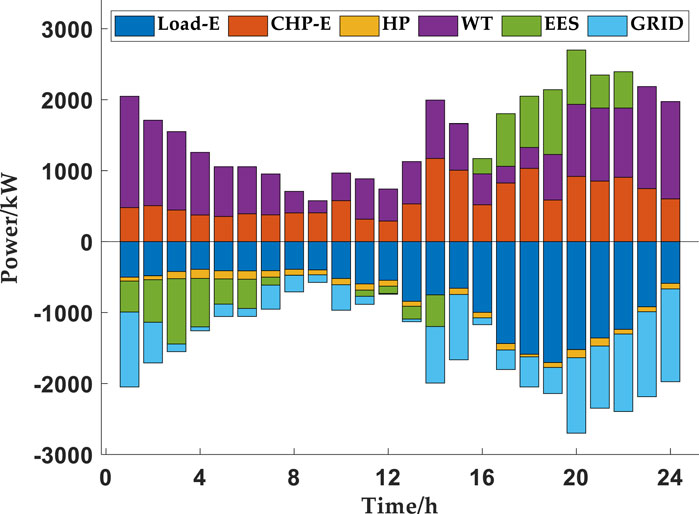
FIGURE 7. Electric energy scheduling results on a typical day.
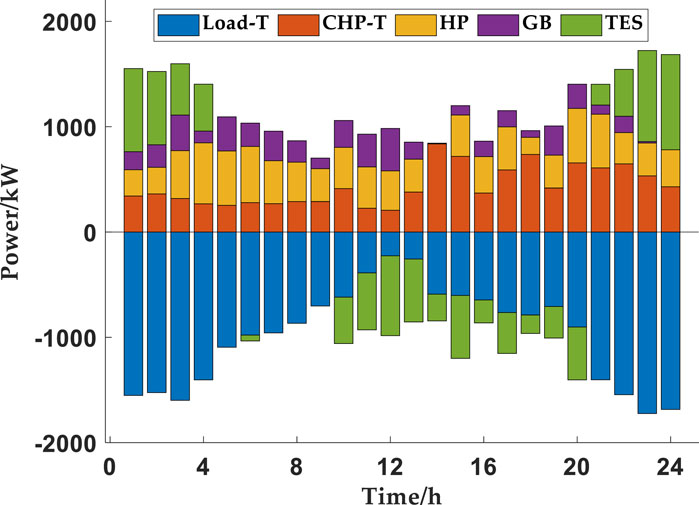
FIGURE 8. Thermal energy scheduling results on a typical day.
First of all, during the period from 23:00 to 07:00, electricity prices are in the valley due to the low electrical load, and the profits from the sale of electricity by the energy station are also lower. The electric load is first supplied by WT, and the shortfall is then replenished by other devices. In addition, in order to obtain more profit, the energy station will store the excess electricity in the storage equipment, and then sell the stored electricity at a high price during the peak period. During this period, the heat load demand is high, and then GB, CHP and HP work together to meet the thermal energy demand of the users; if they cannot meet the demand, the thermal energy shortage is supplemented by the thermal storage device of the energy station. Secondly, during 08:00–10:00 and 14:00–18:00, the demand of electric load rises gradually, and the comprehensive electricity price tends to increase, and when WT cannot meet the demand of load, the output of CHP also increases. The heat load is still supplied by GB, CHP and HP, and the shortfall is then supplemented by the heat storage equipment. Finally, the electrical load is at its peak during the 18:00–23:00 h, when the comprehensive electricity price is the highest, and the energy station, driven by profit, will increase its internal generation significantly to avoid using electricity with too much carbon price attached. At the same time, the storage device discharges and sells the rest of the electricity to the DSO while meeting its own load demand, thus obtaining a high profit. Due to the operating characteristics of the CHP, the CHP also produces more heat during this time period, and the excess heat energy will be stored by the thermal storage device and then released during the peak heat use period.
Under the actual conditions, the output of new energy equipment is greatly affected by natural conditions and there is a certain degree of uncertainty, so it is necessary to further study the impact of uncertainty factors on the operation of energy stations. In this paper, we consider the uncertainty of wind power equipment output and compare scenario 5 and scenario 2 according to the interval mathematical programming method, and the results are shown in Table 3.

TABLE 3. Uncertainty analysis of wind power output.
Comparing the results of scenario 2 and scenario 5, it can be seen that the revenue of the energy station under scenario 5 is affected by the uncertainty of wind power output in the system, and the average value of the profit is slightly decreased. This is due to the fact that after considering the wind power output uncertainty, the energy station will sell less power to the distribution network in order to cope with the situation of insufficient wind power output while meeting the load demand, which in turn leads to a lower profit from power sales.
In order to analyze the effect of the comprehensive electricity price on the energy use behavior of prosumer in the game process, the following conclusions are drawn by comparing scenarios 1, 2 and 3. Table 4 shows the comparison of optimization results of prosumer.
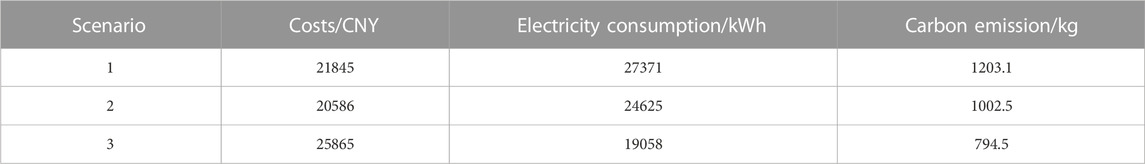
TABLE 4. Analysis of prosumer costs.
Scenario 2 considers the cost of additional carbon tax on electricity purchased by prosumer compared to Scenario 1. The introduction of the additional carbon tax not only encourages the energy station to prioritize the production of clean electricity, but also guides prosumer to adjust their own energy use behavior to reduce the overall carbon emissions in the region. By comprehensively weighing the carbon emissions and the costs to prosumer, it can be argued that all players can gain more profit after considering the comprehensive electricity price.
Comparing scenario 2 and scenario 3, the impact of considering the demand response of prosumer on the operation status is analyzed. The system carbon emission of scenario 3 is further reduced, but at the same time the cost of prosumer increases by 25.6%. This is due to the fact that scenario 3 does not consider the demand response of prosumer, and prosumer does not adjust its energy use behavior when the comprehensive electricity price is higher.
To further illustrate the effectiveness of the comprehensive electricity price model proposed in this paper in guiding prosumer to adjust their electricity consumption strategies, this paper compares the electricity consumption of prosumer with and without the comprehensive electricity price mechanism. The comparison results are shown in Figure 9. Prosumer adjusts its electricity consumption strategy with the goal of minimizing the total cost while ensuring that the basic electric load is satisfied. From the figure, it can be seen that based on the comprehensive electricity price model, prosumer will take the initiative to regulate the energy use behavior and reduce the electricity consumption during the peak period.
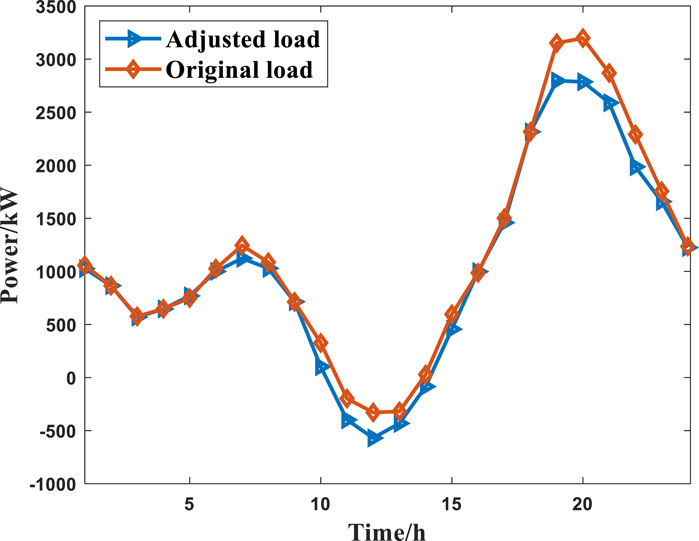
FIGURE 9. Comparison of electricity use by prosumer.
Compare scenarios 2 and 5 to analyze the impact of uncertainty. The results are shown in Table 5. Compared with Scenario 2, Scenario 5 is affected by PV uncertainty, and the energy cost of prosumers fluctuates greatly and the average value of the cost increases slightly. This is because when considering the uncertainty of PV plant output, prosumers need to cope with the situation of insufficient PV plant output and need to buy more electricity from the distribution network operator or adjust their energy use behavior in order to satisfy their own electricity demand.

TABLE 5. Uncertainty analysis of wind power output.
This paper proposes an optimization operation strategy of integrated energy system based on carbon emission flow for RIES multi-agent game. The paper constructs a body Stackelberg game mechanism with DSO as the leader and distributed energy stations and prosumers as the followers. The conclusions are drawn by setting up multiple scenarios for comparison and analysis. The comprehensive electricity price model based on carbon emission flow can well guide the equipment output and energy use behavior of the lower level followers. In the game process, the energy station optimizes the operation state according to the comprehensive electricity price and gains more revenue. Prosumers optimize their energy consumption strategies under the incentive of demand response after obtaining the comprehensive electricity price. Each agent is able to transform its low-carbon resources into economic benefits after participating in the game, indicating that the carbon market environment can motivate the participating agents to further save energy and reduce emissions.
The original contributions presented in the study are included in the article/Supplementary Material, further inquiries can be directed to the corresponding author.
LZ: Conceptualization, Data curation, Writing–original draft. DP: Investigation, Software, Writing–review and editing. BW: Resources, Validation, Writing–original draft. JJ: Formal Analysis, Writing–original draft. ZS: Data curation, Formal Analysis, Writing–review and editing. XZ: Methodology, Writing–review and editing.
The author(s) declare financial support was received for the research, authorship, and/or publication of this article. This work is supported by Economic and Technological Research Institute Project of State Grid Anhui Electric Power “Research on the key technologies and commercial operation mode of station-grid synergistic optimization planning of regional integrated energy system to adapt to the synergistic development of ‘electricity–carbon’ market.” (521209220002).
Authors LZ, DP, BW, JJ, and ZS were employed by Economic and Technological Research Institute of State Grid Anhui Electric Power Company.
The remaining author declares that the research was conducted in the absence of any commercial or financial relationships that could be construed as a potential conflict of interest.
All claims expressed in this article are solely those of the authors and do not necessarily represent those of their affiliated organizations, or those of the publisher, the editors and the reviewers. Any product that may be evaluated in this article, or claim that may be made by its manufacturer, is not guaranteed or endorsed by the publisher.
The Supplementary Material for this article can be found online at: https://www.frontiersin.org/articles/10.3389/fenrg.2023.1333907/full#supplementary-material
Bai, M., Wang, Y., Tang, W., Wu, C., and Zhang, B. (2017). Day-ahead optimal dispatching of regional integrated energy system based on interval linear programming. Power Syst. Technol. 41, 3963–3970. doi:10.13335/j.1000-3673.pst.2017.0390
Chen, H., Wu, T., Li, B., Jiang, T., Zhang, R., and Li, G. (2021a). Electricity pricing strategy of park retailer and energy optimization considering thermal inertia of building. Automation Electr. Power Syst. 45, 148–156. doi:10.7500/AEPS20200329005
Chen, L., Wu, J., and Zhang, W. (2021b). Robust optimization based coordinated scheduling strategy for integrated demand response in micro energy grid. Automation Electr. Power Syst. 45, 159–169. doi:10.7500/AEPS20210201001
Chen, W., Wang, J., Yu, G., Chen, J., and Hu, Y. (2022). Research on day-ahead transactions between multi-microgrid based on cooperative game model. Appl. Energy 316, 119106. doi:10.1016/j.apenergy.2022.119106
Cheng, Y., Zhang, N., Wang, Y., Yang, J., Kang, C., and Xia, Q. (2018). Modeling carbon emission flow in multiple energy systems. IEEE T Smart Grid 10, 3562–3574. doi:10.1109/tsg.2018.2830775
Cong, H., Wang, X., Jiang, C., and Ma, X. (2018). Coalition game based optimized operation method for integrated energy systems. Automation Electr. Power Syst. 42, 14–22. doi:10.7500/AEPS20170912006
Cui, Y., Zhang, J., Wang, Z., Wang, T., and Zhao, Y. (2020). Day-ahead scheduling strategy of wind-PV-CSP hybrid power generation system by considering PDR. Proc. CSEE 40, 3103–3114. doi:10.13334/j.0258-8013.pcsee.191388
He, Z., Xu, C., Liu, Y., Hua, H., and Dong, S. (2017). Industrial park IDR model considering multi-energy cooperation. Electr. Power Autom. Equip. 37, 69–74. doi:10.16081/j.issn.1006-6047.2017.06.010
Kang, C., Zhou, T., Chen, Q., Xu, Q., Xia, Q., and Ji, Z. (2012). Carbon emission flow in networks. Sci. Rep-UK 2, 479. doi:10.1038/srep00479
Li, K., Ye, N., Li, S., Wang, H., and Zhang, C. (2023). Distributed collaborative operation strategies in multi-agent integrated energy system considering integrated demand response based on game theory. Energy 273, 127137. doi:10.1016/j.energy.2023.127137
Li, P., Wu, D., Li, Y., Yin, Y., Fang, Q., and Chen, B. (2020). A multi-objective union optimal configuration strategy for multi-microgrid integrated energy system considering bargaining game. Power Syst. Technol. 44, 3680–3690. doi:10.13335/j.1000-3673.pst.2020.0289
Li, X., Lu, Z., Wang, H., and Cheng, H. (2012). In dispatch strategy for carbon capture considering day index constraints in carbon emission reduction. Chin. Soc. Electr. Eng. 32, 159–165. doi:10.13334/j.0258-8013.pcsee.2012.31.001
Liu, N., He, L., Yu, X., and Ma, L. (2017). Multiparty energy management for grid-connected microgrids with heat-and electricity-coupled demand response. IEEE T Ind. Inf. 14, 1887–1897. doi:10.1109/tii.2017.2757443
Liu, N., Wang, J., and Wang, L. (2018a). Hybrid energy sharing for multiple microgrids in an integrated heat–electricity energy system. IEEE T Sustain Energy 10, 1139–1151. doi:10.1109/tste.2018.2861986
Liu, P., Ding, T., Zou, Z., and Yang, Y. (2019). Integrated demand response for a load serving entity in multi-energy market considering network constraints. Appl. Energy 250, 512–529. doi:10.1016/j.apenergy.2019.05.003
Liu, X., Gao, B., and Li, Y. (2018b). Review on application of game theory in power demand side. Power Syst. Technol. 42, 2704–2711. doi:10.13335/j.1000-3673.pst.2018.0039
Liu, Y., Chen, X., Li, B., and Zhu, J. (2020). State of art of the key technologies of multiple microgrids system. Power Syst. Technol. 44, 3804–3820.
Lu, Z., Guo, K., Yan, G., and He, L. (2017). Optimal dispatch of power system integrated with wind power considering virtual generator units of demand response and carbon trading. Automation Electr. Power Syst. 41, 58–65. doi:10.7500/AEPS20170101001
Lu, Z., Yang, Y., Geng, L., Pan, L., He, L., and Li, X. (2018). Low-carbon economic dispatch of the integrated electrical and heating systems based on benders decomposition. Proc. CSEE 38, 1922–1934. doi:10.13334/j.0258-8013.pcsee.171058
Ma, H., Chen, Q., Hu, B., Sun, Q., Li, T., and Wang, S. (2021). A compact model to coordinate flexibility and efficiency for decomposed scheduling of integrated energy system. Appl. Energy 285, 116474. doi:10.1016/j.apenergy.2021.116474
Ming, M., Chen, N., Wang, X., Yang, L., and Cong, S. (2021). A multi-agent based hierarchical distributed energy coordination method for integrated energy system. Mod. Electr. Power 38, 129–137. doi:10.19725/j.cnki.1007-2322.2020.0256
Qu, K., Huang, L., Yu, T., and Zhang, X. (2018). In decentralized dispatch of multi-area integrated energy systems with carbon trading. Proc. CSEE 38, 697–707. doi:10.13334/j.0258-8013.pcsee.170602
Su, J., Zhang, H., Liu, H., Yu, L., and Tan, Z. (2023). Membership-function-based secondary frequency regulation for distributed energy resources in islanded microgrids with communication delay compensation. IEEE Trans. Sustain. Energy 14, 2274–2293. doi:10.1109/tste.2023.3266295
Tong, D., Zhang, Q., Zheng, Y., Caldeira, K., Shearer, C., Hong, C., et al. (2019). Committed emissions from existing energy infrastructure jeopardize 1.5 °C climate target. Nature 572, 373–377. doi:10.1038/s41586-019-1364-3
Wang, H., Li, K., Zhang, C., and Xin, M. (2020a). Distributed coordinative optimal operation of community integrated energy system based on Stackelberg game. Trans. China Electrotech. Soc. 40, 10. doi:10.13334/j.0258-8013.pcsee.200141
Wang, S., Wang, D., and Han, L. (2014). Interval linear programming method for day-ahead optimal economic dispatching of microgrid considering uncertainty. Automation Electr. Power Syst. 38, 5–11. doi:10.7500/AEPS20131212010
Wang, S., Zhai, J., Hui, H., Ding, Y., and Song, Y. (2023). Operational reliability of integrated energy systems considering gas flow dynamics and demand-side flexibilities. IEEE Trans. Industrial Inf. 2023, 1–13. doi:10.1109/tii.2023.3275712
Wang, Y., Li, F., Yang, J., Zhou, M., Song, F., Zhang, D., et al. (2020b). Demand response evaluation of RIES based on improved matter-element extension model. Energy 212, 118121. doi:10.1016/j.energy.2020.118121
Wang, Y., Ma, Y., Song, F., Ma, Y., Qi, C., Huang, F., et al. (2020c). Economic and efficient multi-objective operation optimization of integrated energy system considering electro-thermal demand response. Energy 205, 118022. doi:10.1016/j.energy.2020.118022
Wei, Z., Zhang, S., Sun, G., Xu, X., and Chen, S. (2016). Carbon trading based low-carbon economic operation for integrated electricity and natural gas energy system. Automation Electr. Power Syst. 40, 9–16. doi:10.7500/AEPS20151109004
Wei, Z., Zhang, S., Sun, G., Zang, H., Chen, S., and Chen, S. (2017). Power-to-gas considered peak load shifting research for integrated electricity and natural-gas energy systems. Proc. CSEE 37, 4601–4609. doi:10.13334/j.0258-8013.pcsee.161361
Yang, S., Tan, Z., Lin, H., Li, P., De, G., Ju, L., et al. (2020). A two-stage optimization model for Park Integrated Energy System operation and benefit allocation considering the effect of Time-Of-Use energy price. Energy 195, 117013. doi:10.1016/j.energy.2020.117013
Zhang, S., Wang, D., Cheng, H., Song, Y., and Yuan, K. (2022). Key technologies and challenges of low-carbon integrated energy system planning for carbon emission peak and carbon neutrality. Automation Electr. Power Syst. 46, 189–207. doi:10.7500/AEPS20210703002
Zhang, Z., Wu, D., Yang, Z., and Ma, R. (2023). Optimal configuration of microgrid capacity based on improved differential evolution algorithm. Control Eng. China 30, 90–97. doi:10.14107/j.cnki.kzgc.20200538
Zhou, C., Ma, X., Guo, X., and Lei, J. (2019). Leader-follower game based optimized operation method for interaction of integrated energy system in industrial park. Automation Electr. Power Syst. 43, 74–80. doi:10.7500/AEPS20180604007
Keywords: IES, carbon emission flow, multi-agent game, demand response, thermal inertia of buildings
Citation: Zhang L, Pan D, Wang B, Jia J, Song Z and Zhang X (2024) Multi-agent game operation of regional integrated energy system based on carbon emission flow. Front. Energy Res. 11:1333907. doi: 10.3389/fenrg.2023.1333907
Received: 06 November 2023; Accepted: 08 December 2023;
Published: 03 January 2024.
Edited by:
Sheng Wang, University of Macau, ChinaCopyright © 2024 Zhang, Pan, Wang, Jia, Song and Zhang. This is an open-access article distributed under the terms of the Creative Commons Attribution License (CC BY). The use, distribution or reproduction in other forums is permitted, provided the original author(s) and the copyright owner(s) are credited and that the original publication in this journal is cited, in accordance with accepted academic practice. No use, distribution or reproduction is permitted which does not comply with these terms.
*Correspondence: Xin Zhang, eGluemhhbmcyMDAwMTAyNkAxNjMuY29t
Disclaimer: All claims expressed in this article are solely those of the authors and do not necessarily represent those of their affiliated organizations, or those of the publisher, the editors and the reviewers. Any product that may be evaluated in this article or claim that may be made by its manufacturer is not guaranteed or endorsed by the publisher.
Research integrity at Frontiers
Learn more about the work of our research integrity team to safeguard the quality of each article we publish.