 Kun Ding1
 Lei Zhang
- 1State Grid Gansu Electric Power Company, Lanzhou, China
- 2Tsinghua Sichuan Energy Internet Research Institute, Chengdu, China
The significant increase in the proportion of renewable energy access has led to a burgeoning and urgent demand for flexible resources within the power system, and the prominence of flexible resources on the demand side has been underscored. The existing research on demand-side response primarily focuses on addressing peak load challenges, while the optimization of demand response for accommodating renewable energy remains inadequate. Considering this issue, the present study initially examines the flexibility mechanism offered by demand-side resources and proposes a calculation approach for determining the adjustable capacity of demand-side flexible resources. Furthermore, considering the limitations of the load that can be shifted, transferred, and curtailed, we develop a collaborative optimization operational model for accommodating renewable energy with multiple types of demand response. Finally, based on the provincial power grid example, the simulation study verifies the efficacy of a multi-type demand response. The results demonstrate that shiftable and transferable loads can effectively facilitate the accommodation of new energy, and their optimal allocation capacity ratios are 5.8% and 2.3%, respectively.
1 Introduction
The substantial increase in the proportion of renewable energy access necessitates a significant surge in demand for flexible resources within the power system, and the flexibility of the traditional power system primarily stems from the power supply side (LI et al., 2015; LI et al., 2017). As traditional power sources, such as thermal power, are substituted by emerging energy alternatives, the contradiction between the declining capacity of flexible power supply and the increasing demand for flexibility in the power system becomes more pronounced. The current cost limitations of energy storage impede its widespread promotion and application, despite it being a high-quality and versatile resource for adjustment. In contrast, the demand side exhibits significant potential for flexibility and cost-effectiveness, thereby emerging as an increasingly favorable option for harnessing flexibility resources (YI et al., 2018; ZHAO et al., 2018).
Currently, both domestic and international scholars have conducted extensive research on demand-side flexible resources. In terms of mitigating the peak load on the power grid, HU et al. (2018) and Lin et al. (2020) proposed an interactive mechanism model wherein moderate and transferable loads such as air conditioning and electric vehicles actively participate in power grid dispatching and realized the effect of peak cutting and grain filling in demand response. LIU et al. (2020) and Waseem et al. (2021) established a demand-side response model in order to guide the adjustment of the hourly load, taking into account the characteristics of the load.
The demand-side response also contributes to enhancing power grid security due to its rapid response speed and remarkable cost-effectiveness. HU et al. (2022) established an economic scheduling model with frequency security constraints and proposed a data-driven frequency security constraint model to solve the frequency modulation requirements of the system. Khajehzadeh et al. (2022) established a two-layer optimization model considering demand response to improve the voltage stability of the power system.
In terms of market mechanism, Linna et al. (2018) put forward an optimization method and operation strategy for the dynamic TOU price of the distribution network. Dolatabadi and Mohammadi-Ivatloo (2017) and Huang et al. (2023) established a multi-energy system operation model, adjusted end-user energy consumption patterns according to energy prices, and made internal operation plans. For small- and medium-sized power users, Lu (2021) proposed the concept of a load service provider and established a demand response model based on coupon incentives. Ying et al. (2019) established curvilinear regulation models of two types of flexible loads, transferable loads and adjustable loads, and analyzed the adjustment effect of flexible loads on the overall load demand.
To sum up, the existing research work on demand-side response mainly focuses on solving the problems of power grid security (Stluka et al., 2011; YAO et al.; Qian et al., 2022), peak cutting and valley filling (CHEN et al., 2022; ZHU et al., 2022), and market mechanisms (Yuan et al., 2022; ZHOU et al., 2022). The scenario of renewable energy accommodation is not considered enough, the mechanism of demand-side resources providing flexibility is not revealed, and the effect of demand-side responses promoting renewable energy accommodation is not clear. In response to this problem, this paper carried out a study on multi-type demand-side flexibility resource optimization for renewable energy accommodation, with specific innovations as follows:
1) Aiming at the problem of demand-side response in promoting the accommodation of renewable energy, this paper analyzes the mechanism of demand-side resources providing flexibility and puts forward the calculation method to increase and decrease the demand-side flexibility resource space.
2) Considering the multi-type load constraints, such as shifting load, transferable load, and reducable load, a multi-type collaborative optimization operation model for promoting renewable energy accommodation is constructed; the improvement effect of different types of demand response resources on renewable energy accommodation is analyzed; and the optimal response capacity of demand-side flexible resources is obtained by combining the cost and benefit situation.
The remainder of this paper is organized as follows: in Section 2, the mechanism of demand-side flexibility is analyzed and the calculation method of demand-side flexibility resource adjustment space is proposed. In Section 3, a multi-type demand response collaborative optimization operation model for renewable energy accommodation is established. In Section 4, based on the provincial power grid example, multi-type demand response collaborative optimization simulation research is carried out and the improvement effect and optimal response capacity of multi-type demand response resources promoting renewable energy accommodation are obtained.
2 The mechanism by which demand-side resources provide flexibility
Power system operation follows the principles of power generation, transmission, and real-time power balance. After a high proportion of renewable energy is connected to the system, the randomness and intermittency of renewable energy make its output unreliable. In order to ensure the safe and stable operation of the system and the reliability of the power supply, a certain number of conventional units must be arranged in the system startup combination.
The conventional unit not only needs to meet the load but also needs to smooth the output fluctuation of renewable energy. When the renewable energy output exceeds the adjustment capacity of the system, it will produce wind abandonment and light abandonment. Demand-side resources can provide certain flexibility to reduce the power abandonment of renewable energy. In order to ensure the maximum accommodation of renewable energy, as shown in Figure 1, during the period of renewable energy abandonment, the actual output of conventional units should be equal to its minimum technical output, and the required demand-side flexible resources are the up-demand-side flexible resources. The corresponding space is the space between the “minimum technical output of the conventional unit + renewable energy generation power” curve and the curve of “load + outgoing power of the liaison line” curve. In the period when renewable energy is not abandoned, the actual output of the conventional unit should not be less than its minimum technical output. In this case, the required demand-side flexible resource is the reduced demand-side flexible resource, and the corresponding theoretical maximum adjustable space is the space between the “actual output of the conventional unit” curve and the “minimum technical output of the conventional unit” curve.
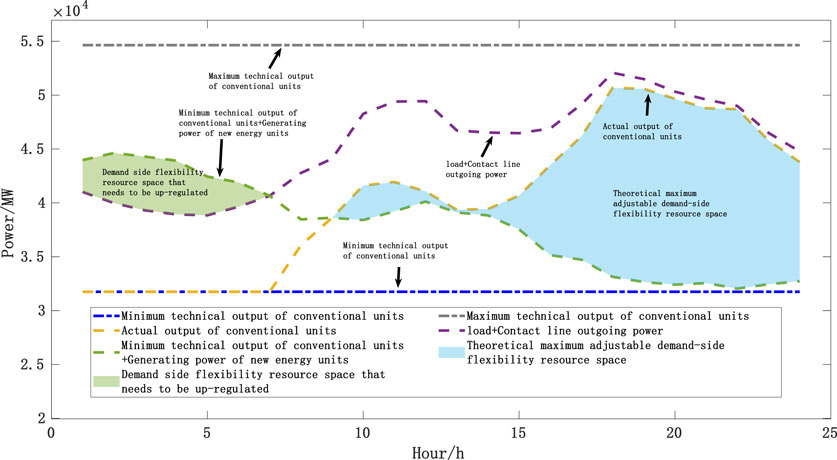
FIGURE 1. Schematic diagram of how demand-side resources provide flexibility.
Assume that at time
Here,
(1) If
Here,
(2) If
The up-demand-side flexible resources can be supplied by time–space translation or shift through a certain amount of down-demand-side flexible resources; that is, part of renewable energy power abandonment can be reduced through appropriate demand response strategies.
3 Sequential production simulation model that takes into account demand-side response
The demand-side response for the purpose of renewable energy accommodation can be divided into two categories: price-based demand response and incentive demand response. Compared with the price-based demand response model, the incentive demand response is a direct control method that enables it to respond quickly, reliably, and accurately to the system signal through directly managing the power accommodation activity of the load, tracking and matching the output of renewable energy, and showing greater potential in promoting the large-scale grid connection and efficient operation of renewable energy power generation.
According to the user response characteristics, the incentive response model divides the demand-side resources into three categories: 1) Curtailable load: Partial or total reduction according to the balance of electric energy production and use, such as air conditioning and electric fan agricultural irrigation equipment; 2) Shiftable load: Restricted by the production process or living process, it is necessary to translate it as a whole, such as the load of equipment for assembly line work; and 3) Transferable load: The total electrical energy required in a dispatch cycle remains unchanged, but the power of electricity in each period can fluctuate within a certain range, such as washing machines, dishwashers, electric vehicles, and other loads.
3.1 Demand-side response model
3.1.1 Shiftable load model
The shiftable load needs to be translated as a whole to ensure power continuity. For a shiftable load, the power distribution vector is
Here,
The 0–1 variable
When
Modeling of shiftable loads is based on power distribution vectors, which is given by
Since the shiftable load exists after the dispatch, there are only two cases: a) not panning and b) pan within the acceptable time period. The build constraints are as follows:
3.1.2 Transferable load model
For a transferable load, the
The 0–1 variable
The total amount of load before and after the transfer of the transferable load remains unchanged. The transfer load power within t ranges between the maximum and minimum values of the transfer power. In addition, when transferring without restriction, there will be load transfer to multiple single periods, and the external performance is the frequent start and stop of the equipment, so the minimum continuous operation time of the transferred load needs to be constrained, that is,
Here,
3.1.3 Curtailable load model
For curtailable load
With user satisfaction in mind, the minimum and maximum consecutive cut times and the number of cuts need to be constrained, namely,
Here,
3.2 Sequential production simulation model
Production simulation is an important tool for studying the operation of modern power systems, which can provide important indicators such as the expected value of production cost, reliability, and the renewable energy accommodation rate of the system under the optimal operation mode, and has been widely used in the power industry.
3.2.1 Objective function
The system maximizes the accommodation of renewable energy (wind power and photovoltaics).
Here,
3.2.2 Constraints
1) Constraint of power and electricity balance
In actual operation, the power system must meet the real-time balance of power supply and power consumption.
Here,
2) Constraint of spinning reserve
Here,
3) Constraint of upper and lower limits of thermal unit output
4) Constraints of thermal units climbing up and down
Here,
5) Constraint of upper and lower limits of renewable energy unit output
At present, the output of renewable energy units only considers wind power and photovoltaic power generation to meet the upper limit requirements, excluding the process of climbing, starting, and stopping renewable energy units, namely,
6) Constraint of upper and lower limits of power flow for transmission lines
In order to ensure the safe operation of the power grid, at any time, the transmission power of the power grid transmission line must meet the upper and lower limits of power transmission, that is,
Here,
7) Constraint of power flow balance
In the process of power grid optimization, usually only the active power of the system is taken into account. In order to improve the calculation speed, this model uses the DC power flow method to calculate the transmission power of the line, convert the non-linear power flow problem into a linear problem, and establish a relationship between the active power injected into the node and the phase angle, which is convenient for checking the overload and constructing a linear constraint, that is,
Here,
Here,
8) Phase angle constraint of node voltage
The constraint on the phase angle of the node voltage is mainly aimed at bounding its upper and lower limit values, that is,
Here,
4 Case study
4.1 Introduction to the case study system
In this paper, the typical days of provincial power grids are selected as the research objects; the maximum daily load is 60,970 MW, and the renewable energy power generation capacity is 637,293 MWh. The upper and lower spinning reserve values of the system are 2% of the maximum daily load. Based on the operation results of the sequential production simulation model established in this paper, as shown in Table 1, the renewable energy online accommodation is 596,311 MWh, the renewable energy power abandonment is 40,981 MWh, and the new discard rate is 6.4%.

TABLE 1. Typical daily accommodation and abandonment data of the provincial power grid.
In order to improve the renewable energy accommodation capacity of the power grid, consider the demand-side response flexible resources. The demand-side response model established in this paper is used to study the effect of renewable energy accommodation and improvement under the individual and common responses of the three demand-side flexible resources, namely, shiftable load, transferable load, and curtailable load, respectively.
4.2 Simulation result analysis
4.2.1 The effect of renewable energy accommodation under the shiftable load response can be improved
As shown in Table 2, the design of the shiftable load power is 3,000 MW; according to the model operation results, the shiftable load is shifted from 18:00–22:00 to 03:00–07:00; the response effect curve is shown in Figure 2; the promotion of renewable energy accommodation is 19,554 MWh; and the proportion of renewable energy accommodation is 3.1%. The quantitative effect of shiftable load on promoting renewable energy accommodation is 6.52 MWh/MW.
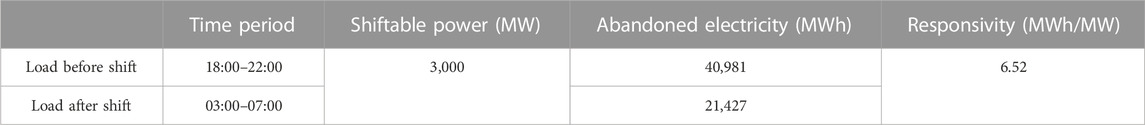
TABLE 2. Parameters for shiftable load responses.
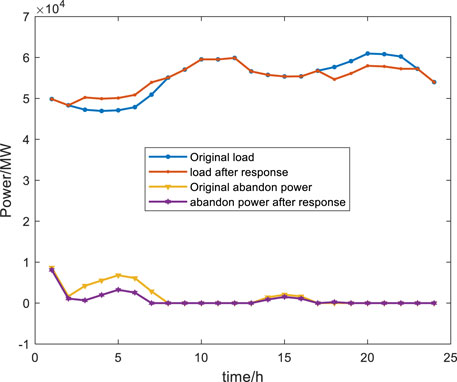
FIGURE 2. Shiftable load response effect.
4.2.2 The effect of renewable energy accommodation under the transferable load response can be improved
As shown in Table 3, the power of the designed transferable load is 3,000 MW; according to the model operation results, the transferable load is translated from 09:00–13:00 to 01:00–04:00 and 06:00–07:00 to 13:00–14:00; the response effect curve is shown in Figure 3, which promotes the accommodation of renewable energy by 12,440 MWh; and the proportion of renewable energy accommodation is 2.0%. The quantitative effect of translational load on promoting renewable energy accommodation is 4.15 MWh/MW.
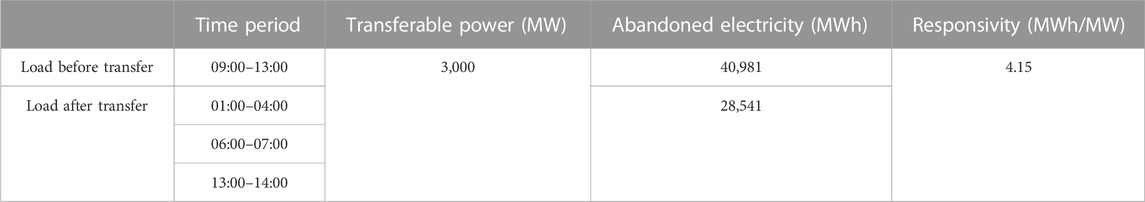
TABLE 3. Transferable load response parameters.
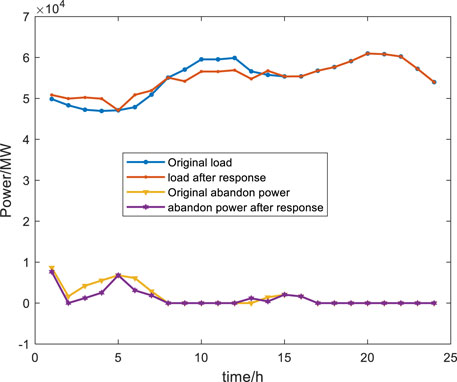
FIGURE 3. Transferable load response effect.
4.2.3 The effect of renewable energy accommodation under the curtailable load response can be improved
As shown in Table 4, the power of the design curtailable load is 3,000 MW; according to the model operation results, to promote renewable energy accommodation as the goal, the curtailable load response power is 0 MW; and the response effect curve is shown in Figure 4, which promotes renewable energy accommodation of 0 MWh and increases the proportion of renewable energy accommodation by 0%. The quantitative effect of the curtailable load on promoting renewable energy accommodation is 0 MWh/MW. The curtailable load has no effect on the accommodation of renewable energy.
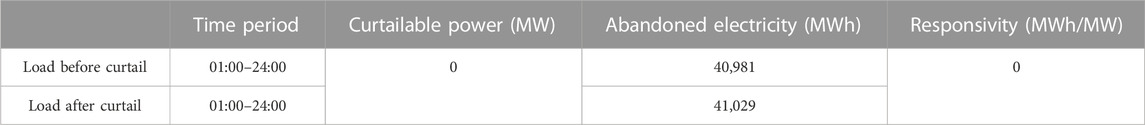
TABLE 4. Parameters for curtailable load responses.
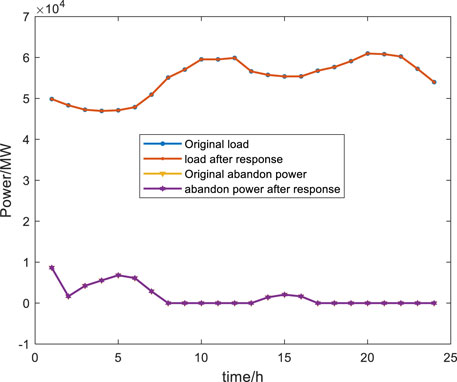
FIGURE 4. Curtailable load response effect.
4.2.4 The effect of renewable energy accommodation under the common response of three demand-side flexible resources can be improved
Considering the common response of shiftable load, transferable load, and curtailable load, as shown in Table 5, the power of the designed responsive load is 6,000 MW; according to the model operation results, the translatable load is shifted from 18:00–22:00 to 03:00–07:00, the transferable load is transferred from 09:00–13:00 to 01:00–02:00, 04:00–06:00, and 13:00–16:00, and the curtailable load is responded to at 23:00. The response effect curve is shown in Figure 5. The comprehensive response promotes a renewable energy accommodation of 36,467 MWh, and the proportion of renewable energy accommodation is 5.7%. The quantitative effect of renewable energy accommodation under the common response of three demand-side flexible resources is 6.08 MWh/MW.
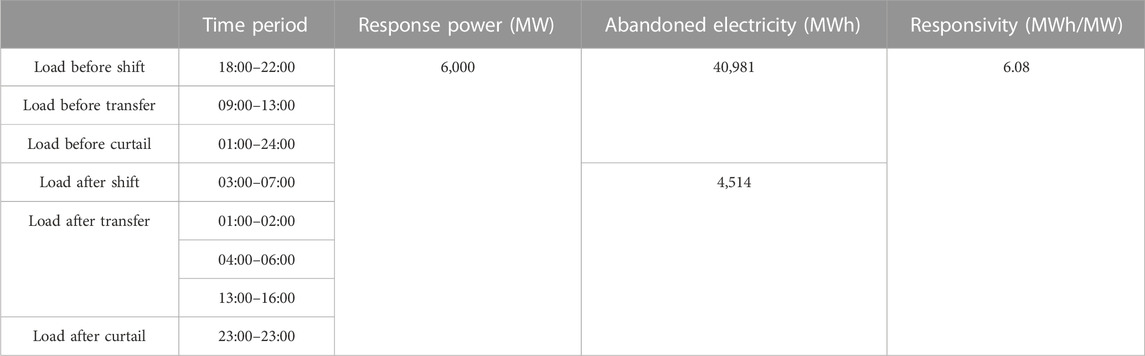
TABLE 5. Parameters for the common response of the three loads.
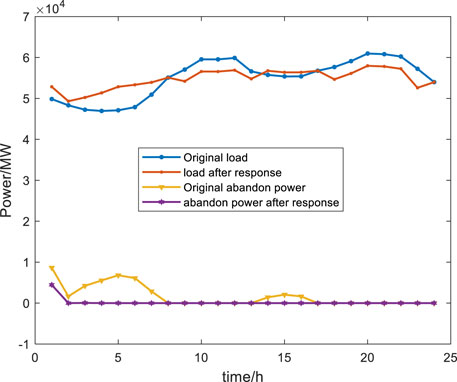
FIGURE 5. Effect of the three loads responding together.
Comparing the three different response results, the shiftable load response is the largest, the comprehensive response is second, the transferable load response is small, and the curtailable load cannot promote the accommodation of renewable energy at all.
4.3 Optimal capacity of demand-side flexible resources
Excluding the construction cost required to carry out the demand-side response, such as the purchase and installation of hardware, such as communication and metering, the demand response cost is the subsidy cost paid by the grid to the user. The benefit of demand-side response can be understood as the renewable energy accommodation promoted can correspond to the reduction of thermal power generation, that is, the product of the renewable energy accommodation promoted and the production cost per unit of thermal power accommodation. According to the survey data (Jia et al., 2022), the subsidy cost of the transferable load is 200 yuan/MW, the subsidy cost of the transferable load is 300 yuan/MW, and the production cost of a thermal power unit is 300 yuan/MWh. The cost, benefits, and net benefits of the participation of demand-side flexible resources in renewable energy accommodation are calculated, as shown in Figure 6. It can be seen from the figure that the optimal response power of demand-side flexible resources is the transferable load of 3,300 MW and 1,300 MW, accounting for 5.8% and 2.3% of the daily maximum load, respectively.
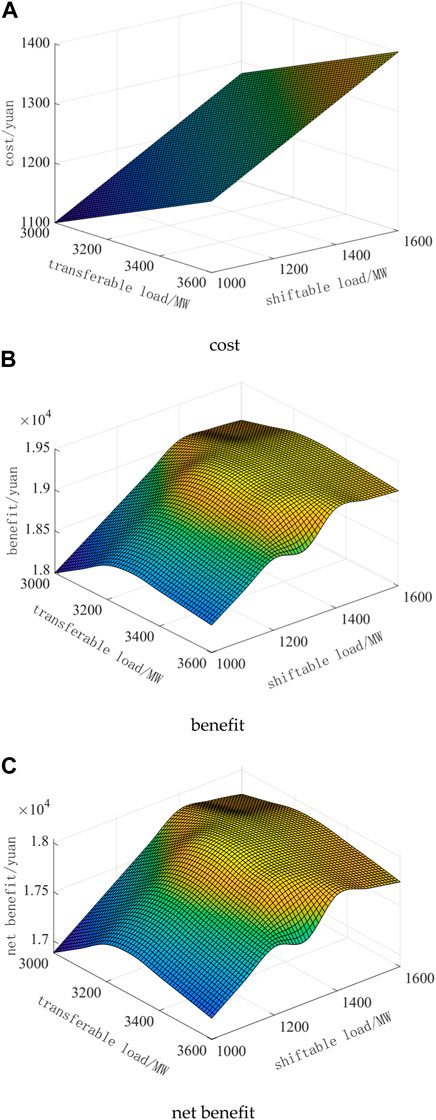
FIGURE 6. Costs and benefits of multiple types of demand responses. (A) Cost; (B) benefit; and (C) net benefit.
5 Conclusion
This paper analyzes the mechanism of demand-side resource flexibility, proposes a calculation method for demand-side flexibility resource adjustment space, establishes a multi-type demand response collaborative optimization operation model to promote renewable energy accommodation, and quantitatively analyzes the effect of demand-side response on improving renewable energy accommodation through typical daily data of provincial power grids. The main conclusions are as follows:
1) The mechanism of providing flexibility by demand-side resources is analyzed, and a method for calculating the adjustable space of demand-side flexible resources is proposed.
2) A collaborative optimization operation model of the demand response to promote renewable energy accommodation was established, and simulation analysis was carried out based on provincial power grid examples to obtain quantitative results of different types of demand-side flexible resources to improve renewable energy accommodation. Among them, the shiftable load can improve the best effect of renewable energy accommodation, and the quantitative effect of shiftable load on promoting renewable energy accommodation is 6.52 MWh/MW. Under the common response of the three demand-side flexible resources, the effect of improving renewable energy accommodation is better, and the quantitative effect of renewable energy accommodation under the common response of three demand-side flexible resources is 6.08 MWh/MW. The effect of transferable load improvement on renewable energy accommodation is poor, and the quantitative effect of translational load on promoting renewable energy accommodation is 4.15 MWh/MW. The curtailable load basically cannot improve the accommodation of renewable energy, and the quantitative effect of the curtailable load on promoting renewable energy accommodation is 0 MWh/MW.
3) Based on the example data, the response cost, benefit, and net benefit of demand-side flexible resources are analyzed, and the optimal capacity of demand-side flexible resources is determined: the transferable load is 3,300 MW and 1,300 MW, accounting for 5.8% and 2.3% of the daily maximum load, respectively.
Data availability statement
The original contributions presented in the study are included in the article/Supplementary Material; further inquiries can be directed to the corresponding author.
Author contributions
KD: writing–review and editing and validation. LZ: conceptualization, methodology, writing–original draft, and writing–review and editing. CY: investigation and writing–original draft. ZW: data curation and writing–original draft.
Funding
The author(s) declare that financial support was received for the research, authorship, and/or publication of this article. This research was funded by three projects: (1) Management Consulting Project of Economic and Technological Research Institute of Gansu Electric Power Company, State Grid (Research on Construction Plan of New Power System Demonstration Zone at the typical regional level in Gansu Province, SGGSJY00XXWT2310040); (2) Major Science and Technology Special Project of Gansu Province (22ZD6GA032); and (3) Gansu power consulting project—Research on the Mechanism of Emerging Entities Participating in the Electricity Market (B7272223XT8200M2400000).
Conflict of interest
Authors KD, CY, and ZW were employed by State Grid Gansu Electric Power Company.
The remaining author declares that the research was conducted in the absence of any commercial or financial relationships that could be construed as a potential conflict of interest.
The handling editor DZ declared a shared affiliation with the author LZ, HL at the time of the review.
The authors declare that this study received funding from Management Consulting Project of Economic and Technological Research Institute of Gansu Electric Power Company. The funder had the following involvement in the study: data collection.
Publisher’s note
All claims expressed in this article are solely those of the authors and do not necessarily represent those of their affiliated organizations, or those of the publisher, the editors, and the reviewers. Any product that may be evaluated in this article, or claim that may be made by its manufacturer, is not guaranteed or endorsed by the publisher.
References
Chen, Z., Lin, K., Wang, B., et al. Design of demand response incentive mechanism considering lowest efficiency loss based on stack elberg equilibrium analysis in unilateral Liberalization market[J]. Power Syst. Technol., 2022, 46(05):1790–1800.
Dolatabadi, A., and Mohammadi-Ivatloo, B. (2017). Stochastic risk-constrained scheduling of Smart energy hub in the presence of wind power and demand response. Appl. Therm. Eng. 123, 40–49. doi:10.1016/j.applthermaleng.2017.05.069
Huang, N., Wang, W., and Cai, G., Optimal configuration planning of multi-energy microgrid based on source-load-temperature scenarios deep joint generation[J]. Power Energy Syst., 2023, 09(03):1090–1102. doi:10.17775/CSEEJPES.2020.01090
Hu, J., Zheng, T., Jin, Y., et al. An aggregation strategy of air conditioning loads considering uncertainty of customer behavior and frequency regulation demand[J]. Power Syst. Technol. , 2022, 46(09):3534–3542.
Hu, R., Zhang, M., Li, Z., et al. Optimal oper ation for CCHP system considering shiftable loads[J]. Power Syst. Technol., 2018, 42(03):715–721. doi:10.1016/j.egyr.2022.02.161
Jia, H., Lin, Y., Liu, Ru, et al. Load aggregator operation optimization model considering demand response uncertainty[J]. Acta Energiae Solaris Sin.,2022, 43(06):17–23.
Khajehzadeh, A., Jahromi, M. H. M., Mahmoudian, M., Rodrigues, E. M. G., and Melicio, R. Novel control framework for optimal scheduling in microgrid with demand response support under contingency events[J]. Clean. Energy Syst., 2022, 3, 100019, doi:10.1016/j.cles.2022.100019
Li, H., Lu, Z., and Qiao, Y. Bi-Level optimal planning of generation-load-storage integrated generalized flexibility resource [J]. Automation Electr. Power Syst., 2017, 41(21):46–54+104.
Li, H., Lu, Z., Qiao, Y., et al. Assessment on operational flexibility of power grid with grid-connected large-scale wind farms [J]. Power Syst. Technol., 2015, 39(06):16721678. doi:10.13335/j.1000-3673.pst.2015.06.032
Lin, J., Dong, P., Liu, M., Huang, X., and Deng, W. Research on demand response of electric vehicle agents based on multi-layer machine learning algorithm[J]. IEEE Access, 2020, 08:224224–224234. doi:10.1109/access.2020.3042235
Linna, N. I., Liu, W., Wen, F., Xue, Y., Dong, Z., Zheng, Y., et al. Optimal operation of electricity, natural gas and heat systems considering integrated demand responses and diversified storage devices[J]. J. Mod. Power Syst. Clean Energy, 2018, 6(3):423–437. doi:10.1007/s40565-017-0360-6
Liu, H., Zheng, N., Ge, S., et al. Coordinated planning of source and network in active distribution system with demand response and optimized operation strategy[J]. Automation Electr. Power Syst., 2020, 44(03):89–97.
Liu, R., Li, Z., Yang, X., et al. Optimal dispatch of community integrated energy system considering user-side flexible load[J]. Acta Energiae Solaris Sin., 2019, 40(10):2842–2850.
Lu, X., Ge, X., Li, K., Wang, F., Shen, H., Tao, P., et al. Optimal bidding strategy of demand response aggregator based on customers’ responsiveness behaviors modeling under different incentives[J]. IEEE Trans. Industry Appl., 2021, 57(04):3329–3340. doi:10.1109/tia.2021.3076139
Qian, CHEN, Wang, W., and Wang, H. Bi-level optimization model of an active distribution network based on demand response[J]. Syst. Prot. Control, 2022, 50(16):1–13.
Stluka, P., Godbole, D., and Samad, T. (2011). “Energy management for buildings and microgrids[C],” in 2011 50th IEEE conference on decision and control and European control conference, 5150–5157. doi:10.1109/CDC.2011.6161051
Waseem, M., Lin, Z., Ding, Y., Wen, F., Liu, S., and Palu, I. Technologies and practical implementations of air-conditioner based demand response[J]. Mod. Power Syst. Clean Energy, 2021, 09(06):1395–1413. doi:10.35833/mpce.2019.000449
Yao, Yu, Ye, C., Zhu, C., et al. Data-driven frequency constrained economic dispatch considering fast demand resources[J]. Power Syst. Prot. Control: 1-13.
Ying, L. I., Zhang, Y., Wu, L., et al. Bottom-to-top load curve forecasting method for active distribution network[J]. J. Power Syst. Automation, 2019, 31(02): 106–111.
Yi, W., Zhang, Y., Zeng, Bo, et al. Robust optimization allocation for multi-type incentive-based demand response collaboration to balance renewable energy fluctuations[J].Trans. China Electrotech. Soc., 2018,33(23):5541–5554. doi:10.19595/j.cnki.1000-6753.tces.181033
Yuan, G., Liu, P., Tang, F., et al. Source-load coordination optimal scheduling considering green power certificate and carbon trading mechanisms[J]. Acta Energiae Solaris Sin., 2022(10): 1–8. doi:10.19912/j.0254-0096.tynxb.2020-1044
Zhao, Bo, Wang, X., Zhang, X., et al. Two-layer method of microgrid optimal sizing considering[J]. Trans. China Electrotech. Soc., 2018, 33(14):3284–3295. doi:10.19595/j.cnki.1000-6753.tces.170388
Zhou, X., Huang, X., Zhang, Y., et al. (2022). Real-time scheduling and optimization model of electric vehicles based on fuzzy evaluation of demand response potential [J/OL]. Electr. Power Autom. Equip. (10), 1–8.
Keywords: demand-side response, renewable energy accommodation, shiftable load, transferable load, curtailable load
Citation: Ding K, Zhang L, Yang C and Wang Z (2023) The optimization analysis of multi-type demand-side flexibility resources for renewable energy accommodation in electrical power systems. Front. Energy Res. 11:1333872. doi: 10.3389/fenrg.2023.1333872
Received: 06 November 2023; Accepted: 20 November 2023;
Published: 29 December 2023.
Edited by:
Donghui Zhang, Tsinghua University, ChinaCopyright © 2023 Ding, Zhang, Yang and Wang. This is an open-access article distributed under the terms of the Creative Commons Attribution License (CC BY). The use, distribution or reproduction in other forums is permitted, provided the original author(s) and the copyright owner(s) are credited and that the original publication in this journal is cited, in accordance with accepted academic practice. No use, distribution or reproduction is permitted which does not comply with these terms.
*Correspondence: Lei Zhang, emhhbmdsZWlAdHNpbmdodWEtZWlyaS5vcmc=