- 1State Grid Jibei Electric Power Economic Research Institute, Beijing, China
- 2Beijing Jingyan Electric Power Engineering Design Co., Beijing, China
- 3State Key Laboratory of Alternate Electrical Power System with Renewable Energy Sources, North China Electric Power University, Baoding, China
The increasing growth in installed capacity for renewable energy sources has progressively replaced traditional thermal power units as synchronous power contributors. This transition has led to a reduction in system inertia and resources for frequency regulation, creating a need for renewable energy and energy storage to participate in system frequency modulation. Empirical studies indicate that the current market mechanism for frequency modulation auxiliary services, which predominantly rely on thermal power, is suboptimal for leveraging the unique capabilities of diverse frequency modulation resources. This inadequacy hinders the power industry’s pursuit of the “dual carbon” goals—carbon neutrality and carbon peak. Hence, this paper proposes a joint clearing model for the involvement of renewable energy and energy storage in the frequency modulation auxiliary service market. It considers performance differences and employs the Analytic hierarchy process (AHP) to guide the optimization of the weights of frequency modulation performance indicators for various frequency modulation resources. This approach allows renewable energy, energy storage, and thermal power to maximize the benefits of their own differentiated advantages in various frequency modulation performance indicators. Consequently, this fosters an increased share of renewable energy within the system while ensuring frequency stability, thereby expediting the achievement of the power industry’s “dual carbon” goals. Finally, computational analyses substantiate that the proposed joint clearing model, accounting for performance differentials, can enhance the renewable energy share in the system and simultaneously reduce the societal costs associated with frequency modulation services.
1 Introduction
The development of the electricity market in China, particularly in the area of ancillary services, has been relatively nascent compared to its Western counterparts, such as the United States and Northern Europe, where the frequency modulation ancillary service market has seen matured more rapidly (PJM manual energy & ancillary services market operations, 2017). Currently, China predominantly operates under a “dual-detailed rules” system for frequency modulation services (Santos et al., 2021). However, this framework suffers from inefficiencies, including an incomplete service price compensation mechanism and an inequitable cost distribution. The market’s inherent ability to efficiently allocate resources through supply-demand dynamics has led to the emergence of the frequency modulation ancillary service market as a timely necessity. In the current market structure, synchronous machines serve as the principal providers of frequency modulation services. As the share of renewable energy sources continues to grow, renewable energy and energy storage systems are poised to play a more significant role in frequency modulation (Peng et al., 2019). Unlike traditional thermal power units, these emerging resources offer advantages such as reduced start-up times and faster frequency adjustments (Hu et al., 2019). Nevertheless, the current market design, which relies heavily on the dominant role of thermal power units in frequency modulation, fails to capitalize on the unique attributes of renewable energy and energy storage systems (Liao and Dai, 2005). Consequently, there is an imperative need to reevaluate the market mechanisms. Future research in the electricity market must focus on accounting for the performance differentials among traditional thermal units, renewable energy, and energy storage systems. This involves developing nuanced bidding mechanisms and clearing strategies that can fully leverage the distinct characteristics of diverse frequency modulation resources, thereby promoting a more synergistic approach to system frequency modulation tasks (Yuan and Xi, 2020).
The inherent intermittency and unpredictability of renewable energy generation, as seen in wind and photovoltaic power systems, presents unique challenges for grid stability. Initially, these energy sources operate solely in maximum power tracking mode, refraining from participating in system frequency modulation (Iliana and Torjus, et al., 2014). However, as their scale expands, there is an imperative growing for these renewable sources to assume the roles previously held by synchronous generators within the power grid. Consequently, integrating renewable energy into the frequency modulation ancillary services market is becoming an undeniable trend. European initiatives have already begun incorporating wind and photovoltaic power into frequency modulation services (Meeus et al., 2005).
Traditionally, renewable energy systems have operated in maximum power tracking mode, lacking the capability for frequency modulation. Existing literature (De Paola et al., 2017) developed a demand model for frequency modulation within the ancillary service market and introduced a novel distributed control scheme, accompanied by an iterative control algorithm, to optimize customer satisfaction while minimizing energy costs. However, this model does not take into account the incorporation of a large number of new energy units, which is one-sided and does not adapt to the existing new energy grid connection situation. For wind farms, adjustments such as rotor over speeding or blade pitch angle control are requisite to participate in frequency modulation effectively (Cui et al., 2016). Similarly, photovoltaic systems must transition from maximum power tracking to incorporate frequency modulation capabilities, which can be achieved through load shedding or DC capacitance controls (Zhao et al., 2020). Energy storage systems, characterized by their flexible charging and discharging capabilities and rapid response times (Zhong et al., 2006), are also well-suited for frequency modulation tasks. In the broader context of the power market, the energy market and the frequency modulation ancillary services market have traditionally operated as separate entities. However, empirical studies (Csereklyei et al., 2019) have demonstrated that joint market clearing can yield optimized comprehensive interests, reducing overall electricity costs and enhancing societal welfare. Therefore, integrating renewable energy and energy storage systems into a unified frequency modulation ancillary service market is feasible and economically advantageous. But at present, the existing research is only limited to taking new energy units into the joint market, ignoring the evaluation of a series of their performance, and can not guarantee the fairness of the market.
In the existing regulatory framework for frequency modulation ancillary services in China, unit quotations are typically revised based on historical performance metrics, which subsequently lead to a hierarchical sorting of the units according to these revised quotations. Although this approach effectively incentivizes superior frequency modulation performance among thermal power plants, it falls short in harmonizing the interplay between thermal power, renewable energy, and energy storage systems. Hence, this paper introduces a comprehensive joint clearing model for frequency modulation ancillary services to address this limitation. This model allows for the participation of thermal power, renewable energy, and energy storage systems in the grid while considering the distinct frequency modulation performance attributes of each type of power plant. Utilizing the Analytic Hierarchy Process (AHP) (Deng, 2019), the model assigns weights to frequency modulation performance indicators across various types of frequency modulation plants. This methodological innovation enables the maximization of the unique advantages inherent in each type of frequency modulation plant, ultimately fostering a more coordinated and efficient approach to system-wide frequency modulation tasks. Compared with the traditional joint market clearing model, this model can make the power system obtain more superior frequency modulation performance, ensure the stability of the power system and better power quality on the basis of ensuring the economy.
2 The joint clearing model of electricity market and ancillary service market
2.1 Objective function
Given the multifaceted participation of wind power, photovoltaic power generation, thermal power, and energy storage systems in both of the ancillary service market and the broader energy market, this study develops a joint clearing optimization model. The total social electricity cost encompasses various components, including the energy market quotation, primary frequency modulation quotation, and secondary frequency modulation quotation.
where
2.2 Constraints
The premise of safe system operating frequency lies in the necessity for a balance between the electric energy supply and demand. Therefore, the clearing results must adhere the power balance constraints as follows:
where
Conventional unit operation constraints include output upper and lower limit constraints, climbing constraints, and minimum start and stop time constraints:
where
Frequency modulation capacity constraints of thermal power units are as follows:
The load-shedding rate of wind power involved in frequency modulation complies with the reserved maximum load-shedding rate requirements.
where
where
The quotation limit for wind farms in the electricity market is given below.
Operational constraints on photovoltaic participation in the electricity market can be presented below.
Constraints on energy storage participation in electricity market and ancillary services market bidding are:
where
Operational constraints of energy storage:
where
System backup constraints:
where
3 Optimization of frequency modulation performance indicator weights for different frequency modulation resources considering performance differences
The frequency modulation ancillary service market is typically structured and cleared through a multi-faceted evaluation framework considering variables, including frequency modulation demand, quotations submitted by service providers, and historical frequency modulation performance metrics. The primary objective of this market mechanism is to minimize the procurement cost associated with frequency modulation services. To assess the capabilities of power plants in providing frequency modulation, a historical frequency modulation performance index is employed, which serves as a quantifiable metric calculated based on a power plant’s past contributions to frequency modulation and acts as a quality assessment tool that gauges the efficacy of a given power plant’s frequency modulation capabilities. Subsequently, this index adjusts the initial quotations submitted by each frequency modulation service provider, thereby establishing a prioritized queue for market clearing.
3.1 Calculation of frequency modulation performance indicators
Historical frequency modulation performance indicators are pivotal metrics for evaluating the service quality of frequency modulation service providers. These indicators directly influence on the clearing eligibility of each service provider, thereby shaping the revenue streams of individual suppliers (Li, 2014). Generally, the composite frequency modulation performance index comprises three constituent components as follows: the adjustment rate, the adjustment deviation, and the response time.
The computational methodology for deriving these performance indices is expressed in Eqs. 15–17.
where
The comprehensive frequency modulation performance index
As derived for each power plant, the synthesized frequency modulation performance index serves as a mechanism for revising the plant’s initial bid quotation. This revised bid price is subsequently integrated into a unified sorting algorithm, forming the basis for organizing the market clearing process.
where
where
3.2 Performance index weight optimization considering the difference infrequency modulation performance of different types of power plants
The prevailing methodologies for calculating frequency modulation indices across diverse types of frequency modulation power plants have conventionally assigned equal weights to the adjustment rate, adjustment deviation, and response time indicators. However, this uniform weighting scheme falls short of adequately capturing the unique advantages inherent to different categories of frequency modulation power plants. For instance, renewable energy and energy storage systems exhibit markedly shorter frequency modulation response times compared to traditional thermal power units. This characteristic is of paramount importance for maintaining frequency stability, especially in systems with reduced synchronous inertia. Unlikely, this intrinsic advantage is not sufficiently leveraged in the current competitive market landscape. To address this shortcoming, this study introduces an index weight optimization methodology that considers the performance differentials among various types of power plants. This approach aims to provide a more accurate representation of the distinct advantages in frequency modulation capabilities across different categories of power plants, ultimately promoting a more equitable and efficient market mechanism.
The AHP is a robust quantitative tool that converts perceptual judgments into evaluative metrics. By scrutinizing the interrelationships among various indicators within the system under assessment, AHP facilitates the determination of the relative importance of elements at a given hierarchical level with respect to the established criteria at a higher level. This method constructs a judgment matrix using a comparative analysis of these characteristics, thereby providing a structured framework for multi-criteria decision-making (U-Dominic et al., 2021).
The judgment matrix A is shown in (Eq. 22).
The element in the judgment matrix represents the importance of indicator i compared with indicator j, as shown in Table 1.
All elements in the judgment matrix satisfy the two following points.
1) The diagonal elements are all 1, that is,
2) All elements that are symmetrical along the main diagonal are the same, that is,
To avoid contradictions in the judgment matrix constructed from experiential data, it must undergo a consistency test before practical application. The initially constructed matrix can be used as a judgment matrix only after successfully passing the consistency test.
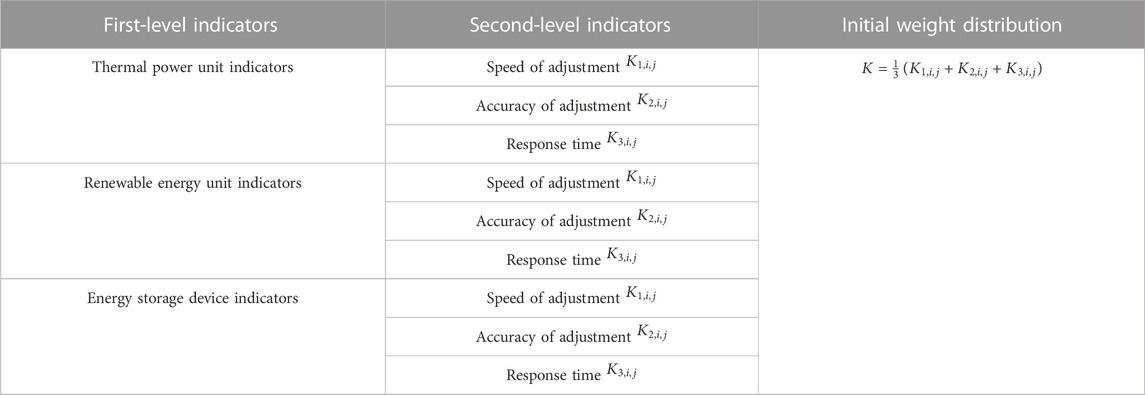
The initial weight distribution for the adjustment rate, adjustment deviation, and response time index weights within the frequency modulation performance indicators is presented in Table 2.
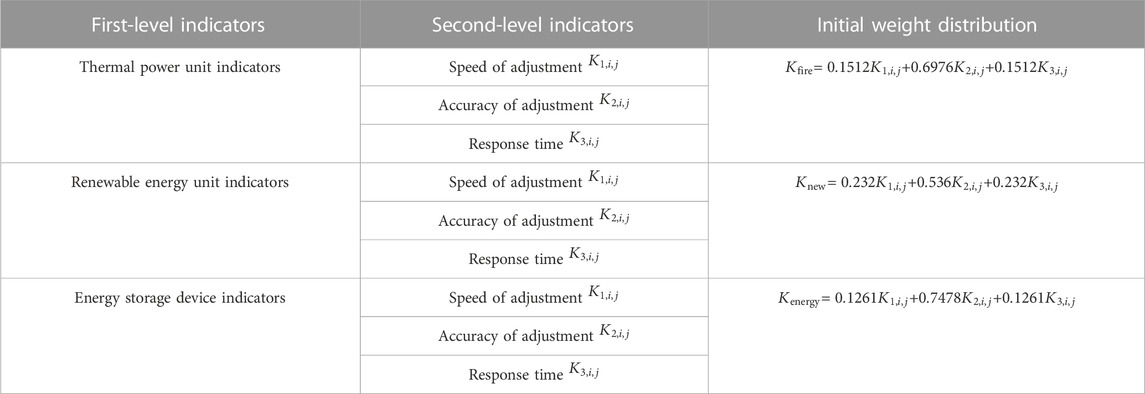
The first-level judgment matrix is derived by considering the proportion of the frequency modulation capacity of each type of unit within the total system’s frequency modulation capacity. According to the differences in frequency modulation performance across different types of power plants, the secondary judgment matrix for modulation rates, modulation deviations and response time indicators of different types of power plants is established based on the frequency modulation performance. Specifically, energy storage units exhibit a shorter adjustment response time compared to conventional and renewable energy units. Renewable energy units have significantly lower requirements for absorbing task adjustment deviations and are lower than other units to avoid high frequency modulation performance indicators that will cause renewable energy to lose the scalar.
Following the consistency test, the weights of the frequency modulation performance indicators for renewable energy, energy storage, and thermal power units, considering performance differences, are shown in Table 3 below.
The weighting coefficients for each frequency modulation index concerning various types of generating units are computed utilizing the AHP. In practical applications, operators within the ancillary service market can flexibly allocate these weight values to adjustment rates, adjustment deviations, and response time indicators based on the real-time operational conditions of the respective units. This nuanced approach ensures cost-effective and operationally efficient execution of the system’s frequency modulation tasks.
4 Example
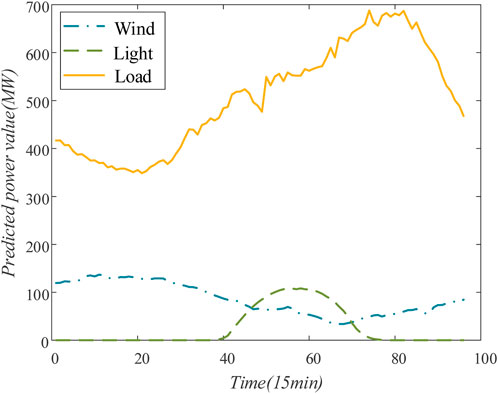
The case study comprises ten thermal power units, two wind farms, one photovoltaic power station, and four independent energy storage devices. Detailed parameter settings can be found in Tables 5–7, while the load curve and renewable energy output curve are illustrated in Figure 1.
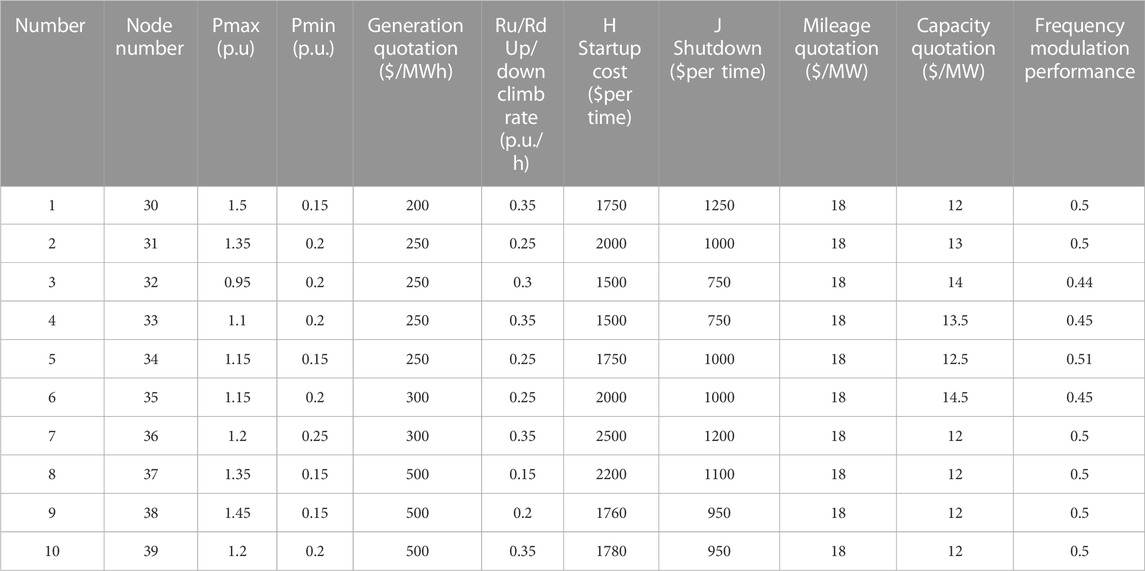
According to China’s regulations on the frequency limit of power systems, the frequency fluctuation range is ±0.2 Hz. The parameters of the thermal power units are shown in Table 4.
The parameters of the wind farms and photovoltaic power stations are shown in Table 5.
The parameters of the independent energy storage devices are listed in Table 6.
4.1 The influence of renewable energy penetration rate on the clearing result of frequency modulation market
With the construction of new power systems, the penetration rate of new energy has been increasing. The following two scenarios are set for analysis to verify the model’s applicability for different new energy penetration rates.
Scenario 1: New energy permeability and low penetration scenario: wind power capacity installed at 150MW, along with photovoltaic capacity at150 MW.
Scenario 2: New energy permeability and high penetration scenario: wind power capacity installed at 200MWand photovoltaic capacity at 200 MW.
In the above two new energy penetration scenarios, the model conducts joint clearance procedures. The clearance results under low permeability of new energy are shown in Figure 2, while Figure 3 illustrates the clearance results under high permeability of new energy.
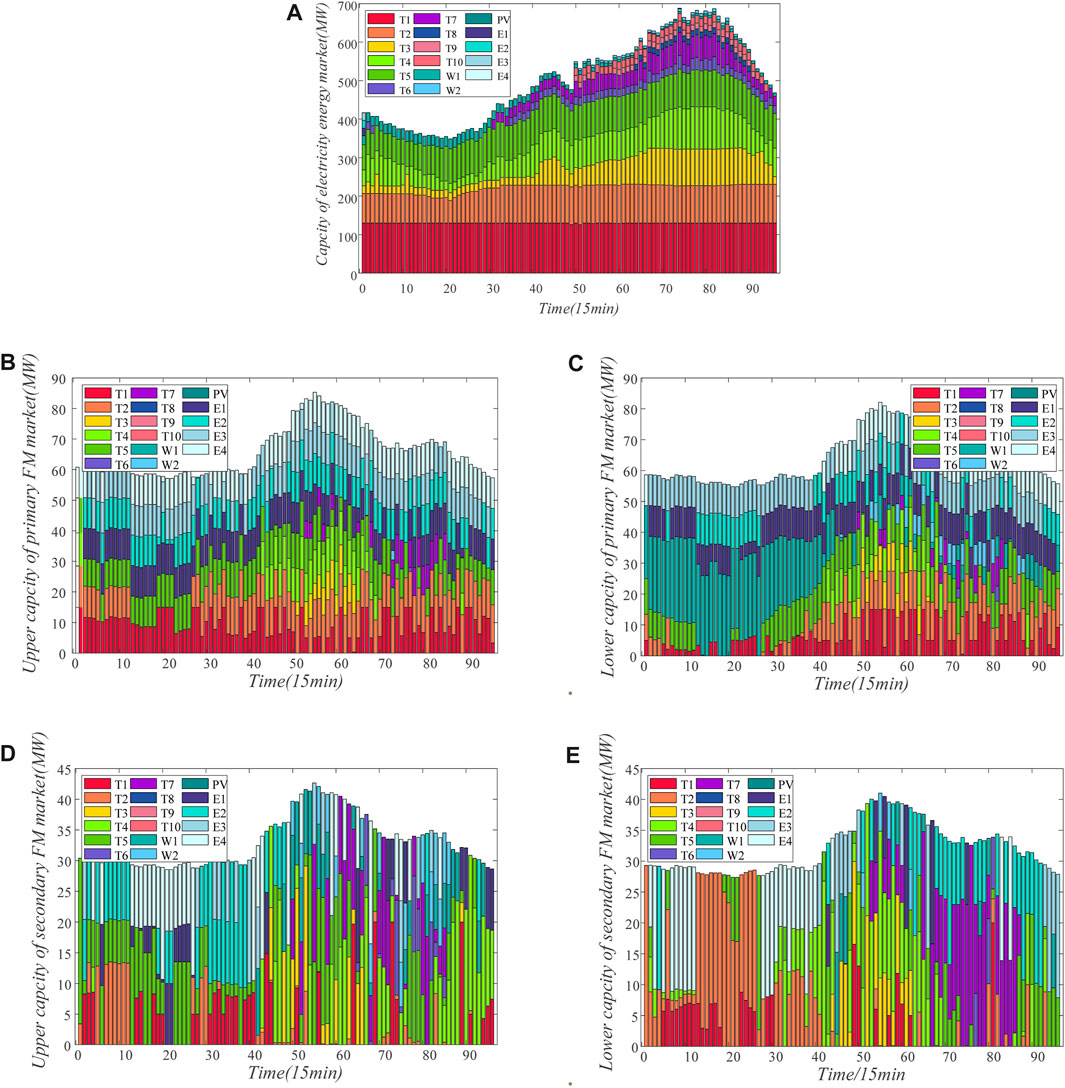
FIGURE 2. Bid capacity of low permeability (A) power market bidding results, (B) primary frequency modulation market up-modulation bid capacity, (C) primary frequency modulation market low-modulation bid capacity, (D) secondary frequency modulation market up-modulation bid capacity, (E) secondary frequency modulation market low-modulation bid capacity.
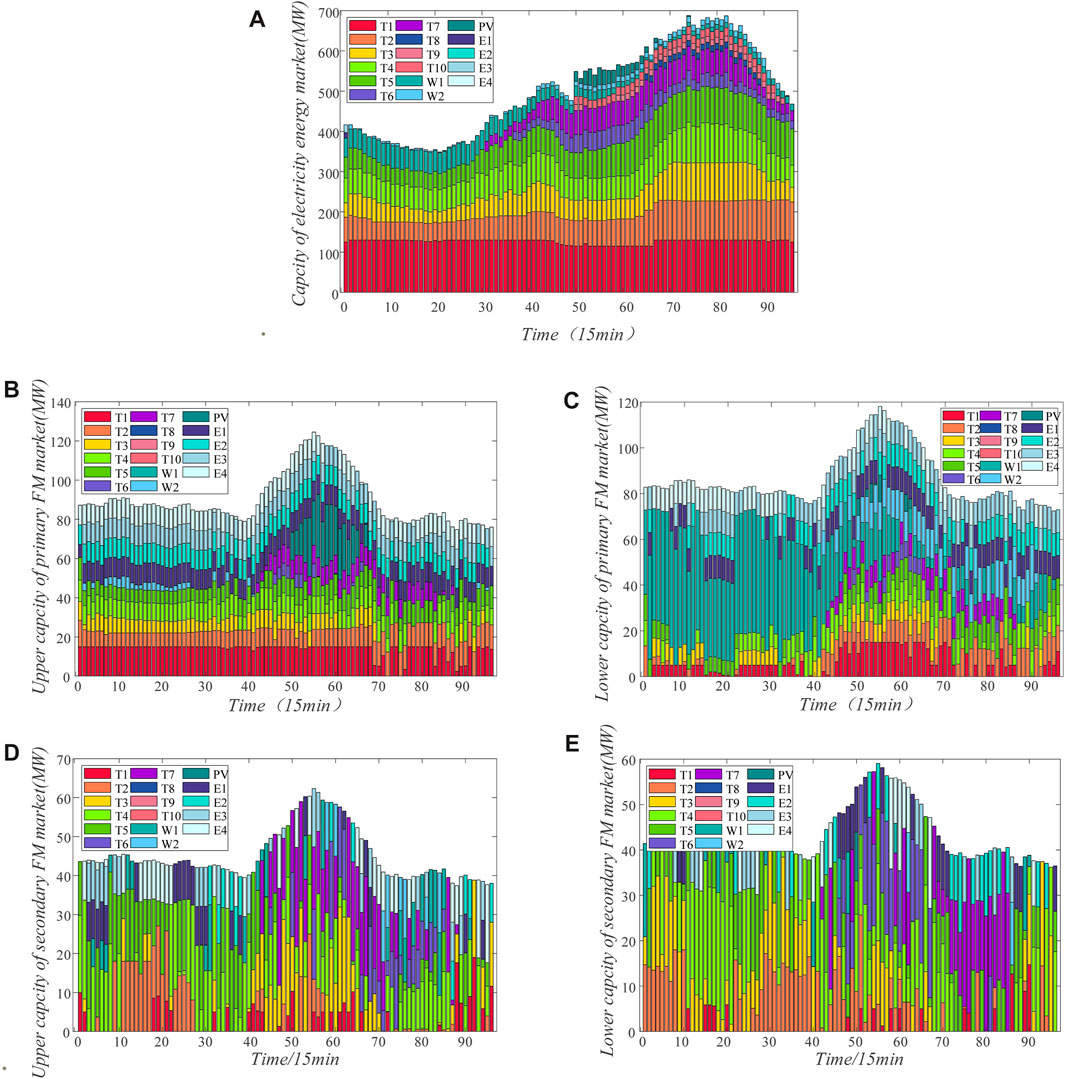
FIGURE 3. Bid capacity of high permeability (A) power market bidding results, (B) primary frequency modulation market up-modulation bid capacity, (C) primary frequency modulation market low-modulation bid capacity, (D) secondary frequency modulation market up-modulation bid capacity, (E) secondary frequency modulation market low-modulation bid capacity.
As seen in Figure 2, the system fluctuation is small in the scenario of low penetration of new energy, and the frequency modulation demand is relatively small. Thus, the total revenue of the frequency modulation service provider is also small. At this time, thermal power units contribute significantly to the energy and frequency modulation market. Due to the consistent total load demand, the quotation of new energy in the electricity energy market remains relatively low. However, as the penetration rate of new energy increases, the bid capacity of new energy rises, leading to an overall decrease in revenue of the electricity energy market. The joint market income under the penetration scenario of the two new energy sources is listed in Table 7.
As shown in Table 7, the overall market revenue increases after the proportion of new energy rises, with a significant boost in revenue from the frequency modulation market. The introduction of a high proportion of new energy contributes more frequency modulation reserve capacity to the power system, consequently reducing the frequency modulation contribution rate of conventional thermal power units.
4.2 The influence of independent energy storage devices on the clearing results of frequency modulation market
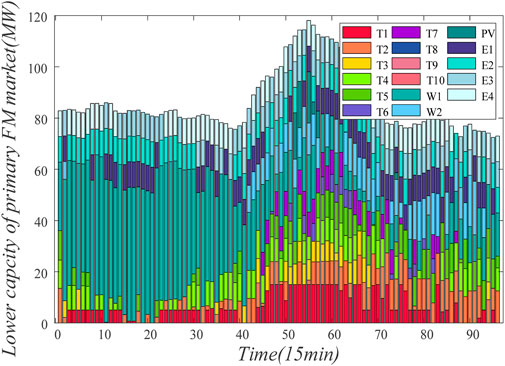
The frequency modulation contribution after energy storage participation is shown in Figures 4, 5.
Compared to the electricity energy market, energy storage plays a more significant role in the frequency modulation auxiliary service market, which has an unparalleled advantage in the frequency modulation market due to the higher adjustment accuracy and faster response time of the energy storage device. The winning result shows that other units win the bid successively after the scalar in the energy storage reaches the technical boundary of its operation. Therefore, the extra energy storage relieves the frequency modulation pressure of conventional units, in which conventional units can have more ability to bid in the energy market. In addition, comparing the bid capacity of the frequency modulation market before and after introducing energy storage reveals that due to the increase in the output of photovoltaic power stations at noon, a higher proportion of photovoltaic power stations participate in primary frequency modulation at this time compared to wind farms. With the introduction of the energy storage device, more photovoltaic power plant output in the larger period of photovoltaic output is used for the frequency modulation.
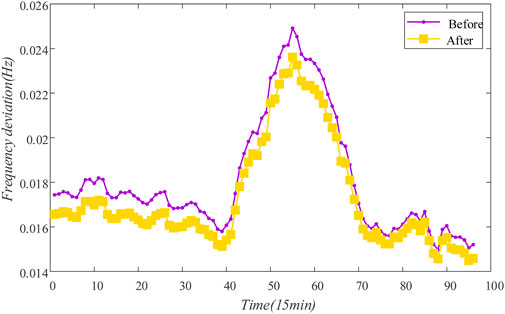
To investigate the impact of energy storage on the stability of the system’s operating frequency, the maximum power disturbance is applied to the simulation of the system under two conditions: with or without energy storage. Then, the maximum frequency deviation is calculated. The results are shown in Figure 6.
Figure 6 illustrates that the operating frequency of the energy storage system remains within the safety limit, indicating that the system frequency is very safe. The analysis of the maximum frequency deviation of the system before and after adding energy storage shows a reduction in the maximum frequency deviation of the system after the configuration of energy storage compared with that without energy storage. Furthermore, energy storage effectively improves the frequency security of the system operation. In addition, the participation of energy storage devices makes more thermal power units with low declared frequency modulation capacity and relatively poor frequency modulation performance bid compared with the participation of energy storage in the frequency modulation market. Thus, the overall share of wind power in the frequency modulation market has been reduced, making wind power more capable of participating in the electricity energy market and enhancing the absorption of wind power. The FM market settlement price has changed as shown in Figure 7.
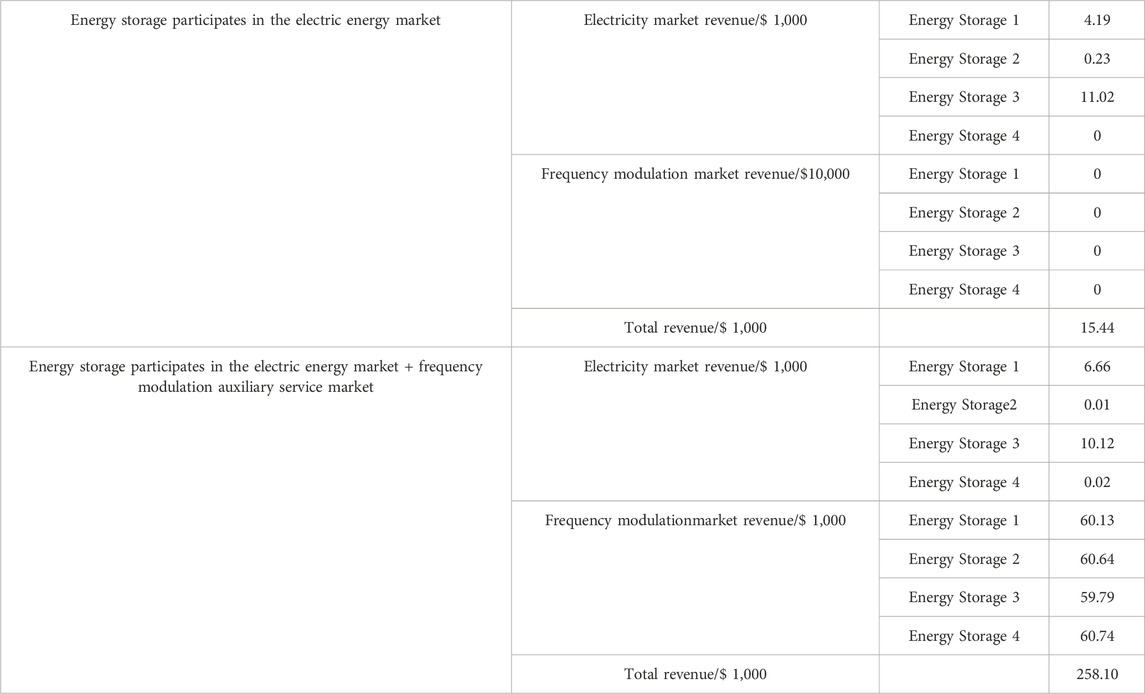
Table 8 compares the total costs with and without energy storage participating in primary frequency modulation. The total cost of primary frequency modulation with energy storage is generally lower than without energy storage because energy storage devices replace thermal power units to perform frequency modulation tasks during periods of high-frequency modulation demand, thereby reducing the total cost. Table 8 shows the revenue from the electricity market and frequency modulation ancillary services for energy storage devices under the two participation scenarios.
As seen in Table 8, energy storage can benefit from the energy market and the frequency modulation market to improve its earnings with excellent charge and discharge performance, which can increase the enthusiasm of energy storage to participate in the energy and auxiliary services markets, thereby improving the flexibility of system operation to enhance the frequency safety of system operation.
4.3 Frequency modulation performance index weight modification considering unit performance difference
Considering the difference infrequency modulation performance between new energy, energy storage, and conventional units, the weights of frequency modulation performance indicators of various frequency modulation resources are corrected. Therefore, different frequency modulation resources can better play their own performance advantages. The winning result of the frequency modulation market after the index weight correction is shown in Figure 8.
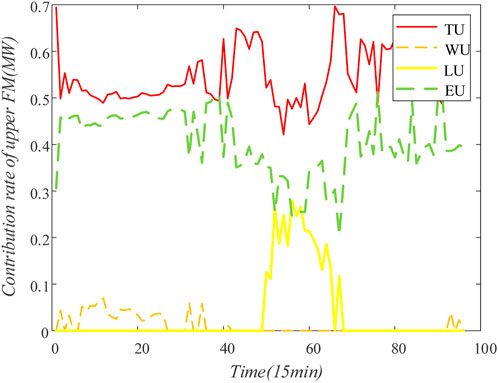
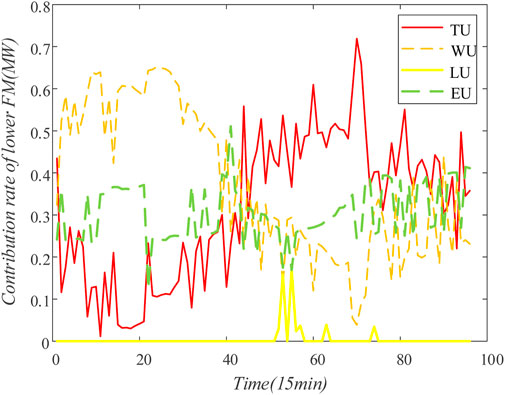
As shown in Figure 8, when considering the difference in frequency modulation performance of different frequency modulation resources, the clearance results show a significant decrease in the frequency modulation bid-winning capacity of thermal power units from 0:00 to 8:30. The reason is that the frequency modulation performance of this part of the thermal power unit is poor. Figure 9 displays the up-down contribution of different frequency modulation resources before and after considering the difference in frequency modulation performance. Meanwhile, the winning capacity of up-down frequency modulation is shown in Figure 10.
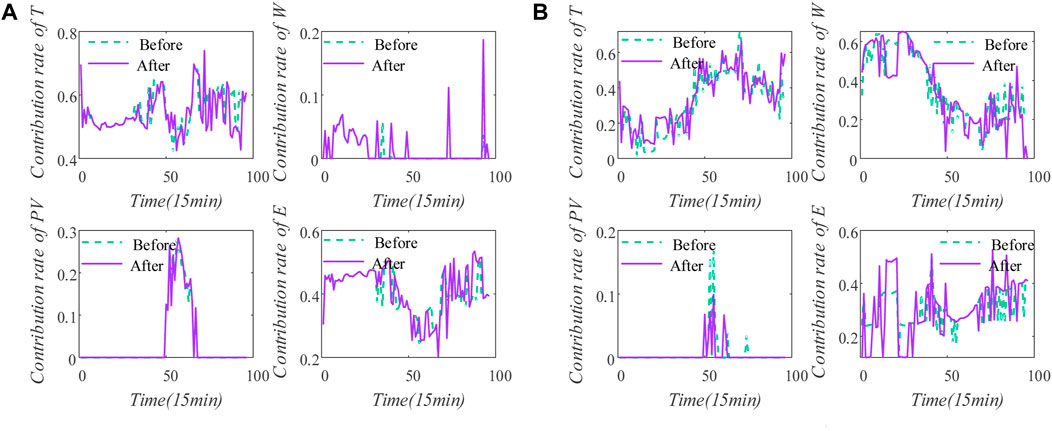
FIGURE 9. Contribution rate of (A) up modulation and (B) low modulation of modulation before and after AHP.
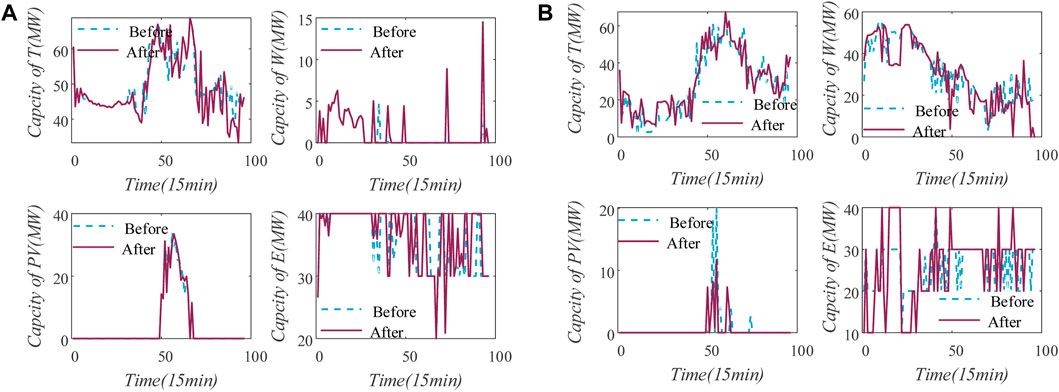
FIGURE 10. Bid capacity of (A) up modulation and (B) low modulation of modulation before and after AHP.
As can be seen, the frequency modulation capacity and contribution of new energy and energy storage are significantly improved by considering the performance differences. This enhancement is precisely attributed to the ability of the proposed method to purchase more frequency modulation resources with good performance and make them undertake more frequency modulation tasks, improving the overall frequency modulation performance of the system’s frequency modulation resources and the frequency security of the system.
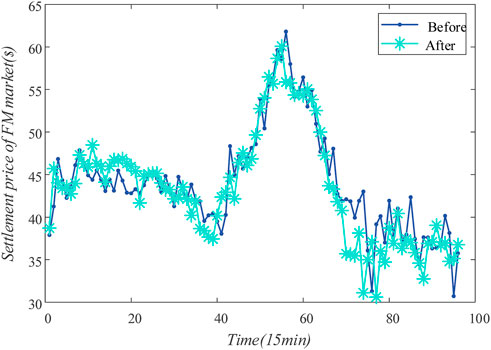
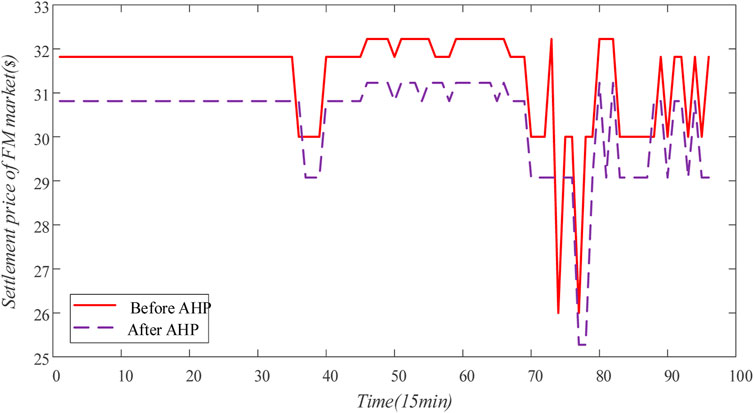
The price of the frequency modulation market before and after considering the difference in frequency modulation performance of various frequency modulation resources is shown in Figure 11. Additionally, the final settlement cost of the frequency modulation market can be found in Table 9.
As can be seen in the figure and table, considering the variations in frequency modulation performance of different frequency modulation resources results in a reduction in the total frequency modulation cost of the system.
Incorporating the difference in frequency modulation performance of various frequency modulation resources, the clearing model leads to a minor reduction in the bid capacity of conventional thermal power units in the primary frequency modulation market while slightly increasing the bid capacity of new energy and energy storage. This is due to considering both the load-shedding constraint of wind power and the improved frequency modulation performance of the modified independent energy storage device. Consequently, the lower frequency modulation scalar of wind power and the medium scalar of independent energy storage have been significantly improved. Furthermore, the fluctuation amplitude of the State of charge (SOC) in energy storage is reduced compared with the frequency before, which is conducive to enhancing the service life of the energy storage, thus further decreasing the frequency modulation cost of the system.
The clearing model, considering the difference infrequency modulation performance of diverse frequency modulation resources, reveals that the clearing sorting order changes due to the change of frequency modulation performance index for the secondary frequency modulation market. Within the existing rules, thermal power units struggle to prioritize winning bids and complete clearance, whereas new energy units can achieve complete clearance of frequency modulation capacity. This is because new energy and energy storage are adjusted faster than thermal power units. However, it is worth noting that the frequency modulation accuracy of new energy is poor. In light of the difference infrequency modulation performance among various frequency modulation resources, thermal power units can basically achieve full clearance of bid capacity in each period. In contrast with primary frequency modulation, secondary frequency modulation should pay more attention to the precision and accuracy of frequency regulation. Therefore, the weight of the adjustment accuracy part is further increased compared with the primary frequency modulation market when the AHP judgment matrix is written in the clearing model column considering the difference in frequency modulation performance of various frequency modulation resources. Thus, the comprehensive frequency modulation performance index can better reflect the frequency modulation accuracy performance of each unit.
The clearing model, considering the difference infrequency modulation performance among different frequency modulation resources, demonstrates that there are no significant changes in the overall clearing result for the electricity energy market. The majority of capacity storage is involved in frequency modulation auxiliary services. Additionally, the charging behavior of energy storage devices in the main energy market has increased relative to discharging. This allows the storage device to charge and apply the power profitably to the frequency modulation market when the main energy market has more energy than required.
5 Conclusion
The development of China’s auxiliary service power market is still in its infancy, and various rules and systems are gradually being improved. According to the existing frequency modulation auxiliary service market rules in China, this paper proposed a joint clearing model of new energy and the participation of energy storage in frequency modulation auxiliary service market considering performance differences. The following conclusions are drawn:
1) The integration of new energy and energy storage enriches the frequency modulation resources of the power system. Thus, the power system has more adjustment flexibility in dealing with the new energy with strong uncertainty. Moreover, this integration can alleviate the tight supply and demand of frequency modulation resources in the power system, leading to a reduction in the overall frequency modulation costs for the system.
2) Integrating energy storage with superior regulatory performance can optimize the overall frequency modulation capability of the system and alleviate the frequency modulation burden on thermal power units with less efficient performance. Participating in both the energy market and auxiliary service market simultaneously can boost the revenue of independent energy storage, thus improving the enthusiasm of energy storage to participate in system scheduling.
3) The comprehensive frequency modulation performance index quantifies the frequency modulation capabilities of each power unit type. AHP adjusts the weight of the three indicators, namely, adjustment speed, adjustment precision, and response time, according to the frequency modulation characteristics of different power unit types, which is conducive to giving full play to the characteristics of different frequency modulation resources to serve the system better and enhance the frequency security of the new power system.
Data availability statement
The original contributions presented in the study are included in the article/supplementary material, further inquiries can be directed to the corresponding author.
Author contributions
CW: Data curation, Methodology, Writing–original draft, Writing–review and editing. YJ: Data curation, Methodology, Writing–original draft, Writing–review and editing. HG: Methodology, Supervision, Writing–original draft, Writing–review and editing. KB: Methodology, Supervision, Writing–original draft. XZ: Supervision, Writing–review and editing. AW: Supervision, Writing–original draft.
Funding
The author(s) declare financial support was received for the research, authorship, and/or publication of this article. Technology Cost Innovation Project of State Grid Jibei Electric Power Economic Research Institute (B3018F230000).
Conflict of interest
Authors CW, YJ, HG, and KB were employed by Beijing Jingyan Electric Power Engineering Design Co.
The remaining authors declare that the research was conducted in the absence of any commercial or financial relationships that could be construed as a potential conflict of interest.
Publisher’s note
All claims expressed in this article are solely those of the authors and do not necessarily represent those of their affiliated organizations, or those of the publisher, the editors and the reviewers. Any product that may be evaluated in this article, or claim that may be made by its manufacturer, is not guaranteed or endorsed by the publisher.
References
CsereklyeiQu, Z. S., and Ancev, T. (2019). The effect of wind and solar power generation on wholesale electricity prices in Australia. Energy Policy 131, 358–369. doi:10.1016/j.enpol.2019.04.007
Cui, D., Shi, P. R., Chen, Q. X., He, G. N., Liu, J., and Su, F. (2016). Optimization strategy of wind power participation in energy-frequency modulation combined Market. Automation Electr. Power Syst. 40 (13), 8. doi:10.7500/aeps20151112004
Deng, X. D. Y., and Deng, Y. (2019). D-ahp method with different credibility of information. Soft Comput. A fusion Found. Methodol. Appl. 23 (2), 683–691. doi:10.1007/s00500-017-2993-9
De PaolaAngeli, A. D., and Strbac, G. (2017). Price-based schemes for distributed coordination of flexible demand in the electricity market. IEEE Trans. Smart Grid 2017, 3104–3116. doi:10.1109/tsg.2017.2707121
Hu, Z., Bi, X., Wang, K., Hu, H., and Guo, X. (2019). Design of peak regulation auxiliary service market for east China power grid to promote inter-provincial sharing of negative reserve. Dianli Xit. Zidonghua/Automation Electr. Power Syst. 43 (5), 175–182. doi:10.7500/aeps20180711007
Iliana, I., and Torjus, F. B. A. (2014). An econometric analysis of the regulation power market at the nordic power exchange. Energy Procedia 58, 58–64. doi:10.1016/j.egypro.2014.10.409
Jian-Wei, Z., and Jun-Jie, Y. (2006). Improved particle swarm optimization algorithm and its application to global optimization for complex function. J. Hubei Inst. Natl. Sci. Ed. 143, 683–690. doi:10.1007/978-3-642-27966-9_92
Li, Y. (2014). Performance indicators and calculation method in AGC units. Hebei Electr. Power 33 (06), 6–8+37. doi:10.3969/j.issn.1001-9898.2014.06.003
Liao, S. Y., and Dai, J. H. (2005). Design pattern and software framework for agent-based modeling and simulation of complex systems. Comput. Simul. doi:10.3969/j.issn.1006-9348.2005.05.072
MeeusPurchala, L. K., and Belmans, R. (2005). Development of the internal electricity market in europe. Electr. J. 18 (6), 25–35. doi:10.1016/j.tej.2005.06.008
Peng, S., Xin, Q. I., Yun, W., and Ting, L. I. (2019). Calculation and application of frequency modulation auxiliary service demand based on volatility analysis. Distribution Util. 2019. doi:10.19421/j.cnki.1006-6357.2019.05.012
Pjm manual energy and ancillary services market operations (2017). PJM manual 11:energy and ancillary services market operations. https://www.pjm.com/unexpected-error.aspx?aspxerrorpath=/-/media/%20documents/manuals/m11.ashx.
Santos, G., Pinto, T., Morais, H., Sousa, T. M., Pereira, I. F., Fernandes, R., et al. (2021). Multi-agent simulation of competitive electricity markets: autonomous systems cooperation for European market modeling. Energy Convers. Manag. 2015, 387–399. doi:10.1016/j.enconman.2015.04.042
U-DominicUjam, C. M. C. J., and Igbokwe, N. (2021). Applications of analytical hierarchy process (AHP) and knowledge management (km) concepts in defect identification: a case of cable manufacturing. Asian J. Adv. Res. Rep. 15 (5), 9–21. doi:10.9734/ajarr/2021/v15i530395
Yuan, J. H., and Xi, X. X. (2020). Current situation and problems of electric power auxiliary service market construction in China. China Electr. Power Enterp. Manag. 2020 (07), 34–38.
Keywords: renewable energy frequency modulation, energy storage frequency modulation, frequency modulation performance indicators, frequency modulation auxiliary services, AHP—analytic hierarchy process
Citation: Wang C, Jiang Y, Guo H, Bai K, Zhang X and Wang A (2023) A joint clearing model for the participation of renewable energy and energy storage in the frequency modulation ancillary service market considering performance differences. Front. Energy Res. 11:1332041. doi: 10.3389/fenrg.2023.1332041
Received: 02 November 2023; Accepted: 07 December 2023;
Published: 29 December 2023.
Edited by:
Kaiping Qu, China University of Mining and Technology, ChinaCopyright © 2023 Wang, Jiang, Guo, Bai, Zhang and Wang. This is an open-access article distributed under the terms of the Creative Commons Attribution License (CC BY). The use, distribution or reproduction in other forums is permitted, provided the original author(s) and the copyright owner(s) are credited and that the original publication in this journal is cited, in accordance with accepted academic practice. No use, distribution or reproduction is permitted which does not comply with these terms.
*Correspondence: Aoer Wang, MTMxOTYzODg4M0BxcS5jb20=
 Chang Wang1,2
 Aoer Wang
