- 1Key Laboratory of Modern Power System Simulation and Control and Renewable Energy Technology, Northeast Electric Power University, Jilin, Jilin, China
- 2State Grid Changchun Power Supply Company, Changchun, Jilin, China
- 3State Grid Hebi Power Supply Company, Hebi, Henan, China
- 4State Grid Wenzhou Power Supply Company, Wenzhou, Zhejiang, China
Aiming at the problem of wind curtailment caused by the lack of system flexibility, an optimal scheduling strategy for improving the flexibility of the electricity-gas-heat interconnection system by the coordinated operation of the gas network management and storage characteristics and the heat storage characteristics of the heat network is proposed. Firstly, the influence of gas network storage and heat network storage on improving flexibility is analyzed respectively. Then, an electricity-gas-heat interconnected system scheduling model considering the dynamic characteristics of gas network management and t the delay characteristics of heat storage in heat network, which greatly improves the imbalance between supply and demand of flexibility in space and time brought by the anti-peak regulation characteristics of wind power to the system. Finally, the IEEE-24 nodes power system, Belgium’s 20-node natural gas network and 6-node thermal network are used, for example, analysis. The results show that the proposed scheduling scheme improves the flexibility of the system while its operating cost and wind curtailment cost are the lowest, which promotes the consumption of wind power.
1 Introduction
The scheduling operation of traditional power, natural gas and thermal systems is completed independently in each system, and different forms of energy cannot be converted to each other. However, with the popularization of coupling equipment such as power to gas (P2G), gas turbines, and combined heat and power (CHP) units, the electricity, gas, and heat systems are gradually interconnected to form an integrated energy system (IES) in which three types of energy can be converted to each other (Li et al., 2019; Li et al., 2021). According to the complementary characteristics of various energy types such as electricity, heat, and gas, and the principle of energy cascade utilization, unified planning and coordinated optimization of multiple energy sources are performed to improve energy utilization (Li et al., 2021). In recent years, due to the increasing installed capacity of wind power and load demand, the problem of unbalanced supply and demand of power system flexibility has become more and more obvious (Wei et al., 2017a; Chai et al., 2020; Yang et al., 2020; Yang et al., 2023; Cao et al., 2023). The North American Electric Reliability Council (NERC) defines’ power system flexibility “as” the ability of supply-side and demand-side resources to respond to system changes and uncertainties’ (Adams et al., 2010). It is an important index to evaluate the power system’s absorption of renewable resources such as wind power. Because the supply and demand flexibility of natural gas system and thermal system has sufficient margin in most of the time, and its transmission network can be used as “virtual energy storage” to store and release energy, the potential flexibility in gas-heat network can provide help for the flexibility of power system, which can effectively solve the problem of supply and demand tension of power system flexibility.
The transmission of natural gas in the gas network pipeline is not instantaneous, and there is a time difference between its injection and output. The “virtual energy storage” function can be realized by using its “tube storage” characteristics. (Chen et al., 2019). The dynamic effect of gas network management and storage and the existence of P2G create space for mutual coordination among energy sources and improve the flexibility of power system. In (Yang et al., 2023), considering the dynamic characteristics of natural gas “management and storage” and the coordinated operation of P2G and gas turbine, a dynamic electricity-gas interconnection system scheduling model was constructed. In (Liu et al., 2011), considering the transient characteristics of natural gas transmission system, it is modeled as a set of partial differential equations and algebraic equations. From the perspective of independent system operators, the coordinated scheduling of power and natural gas systems is described as a bi-level programming problem. In (Keyaerts et al., 2011; Ai et al., 2018; Zhang et al., 2021), the gas network inventory is modeled, and the dynamic effect in the natural gas network is used to improve the flexibility of the power system. In (Fang et al., 2018) expounded the buffer principle of pipeline storage, and combined the transient characteristics of natural gas with the steady-state power flow to form the dynamic optimal energy flow of the integrated electricity-gas system. In (Zhai et al., 2021) shows that when the source of natural gas is disturbed or even stopped, the pipeline still has the ability to maintain the normal operation of the natural gas network for a short time. It can be seen that the gas network management inventory can be used as a flexible resource to participate in the optimal scheduling of the whole system, which not only makes the natural gas system considered more elaborate, but also improves the flexibility of the whole system scheduling.
The transmission of heat in the heat network is not instantaneous. The heat network can store the heat for a short time by using the delay characteristics. This “virtual energy storage” effect is referred to as heat storage in the heat network. The delayed heat storage characteristics of the thermal system can increase the renewable energy access space and improve the flexibility of the system by cooperating with the thermoelectric unit. In (Li et al., 2016) first proposed a thermal network heat storage energy storage model of the electric-heat interconnection system under steady-state energy flow, using Variables Flow and Variables Temperature (VF-VT) control method with CHP heat production to adjust the temperature of the pipe network to control the energy transmission of the heating network and improve the flexibility of the system. Based on the operation characteristics of CHP (Lv et al., 2014), used the CHP to configure the CHP to store heat in the feasible region of power generation and heating, so as to improve the flexibility of the CHP’s electric heating up and down, and give full play to the benefit of the CHP’s configuration of heat storage device to absorb wind power. In (Wang et al., 2020), the dynamic characteristics of the heating network are used as scheduling resources to participate in the optimal operation of the electric-heat IES, so as to realize the scheduling and utilization of the virtual energy storage in the heating network. In (Liu et al., 2021b), the resistance of water flow in the pipeline is taken into account on the basis of considering the transmission dynamics of the heating network, so that the temperature change in the water supply pipeline is more precise, and the accuracy of the unit output satisfying the heating energy flow is improved. In (Zhang et al., 2021), considering the fluctuation of load forecasting, and using the device with phase change energy storage characteristics in the electrothermal integrated energy system to cope with the load fluctuation, an electric-thermal linkage peak load shifting control strategy is proposed to minimize the net load fluctuation on the power side and the thermal side.
Therefore, aiming at the problem of insufficient flexibility caused by the anti-peaking characteristics of renewable energy, this paper takes into account the dual virtual energy storage effect of gas network storage and heat network storage, and uses coupling equipment such as P2G, gas turbine and CHP to realize the mutual conversion between the three kinds of energy, which effectively improves the flexibility of the system. Based on the above principles, an optimal scheduling model of electric-gas-heat system considering dual virtual energy storage of gas network management and heat network storage is constructed, and the effectiveness of the proposed method is proved by an example system.
The main contributions of this paper are as follows:
(1) From the perspective of electrical and thermal interconnection, a day-ahead optimal scheduling method for electrical heat is proposed to solve the problem of insufficient system flexibility to a certain extent;
(2) The dynamic model of natural gas network and the dynamic model of heat network are established, and the influence of their coordination on the dispatching of power system is analyzed;
(3) An electricity-gas-heat integrated energy system considering the dual virtual energy storage characteristics of gas-heat network is constructed, which further improves the overall wind power consumption capacity and unit reserve capacity of the system.
The rest of the paper is organized as follows:
Section 2 analyzes the influence of dual virtual energy storage of gas network storage and heat network storage on improving the flexibility of the system. Section 3 introduces the IES day-ahead optimal scheduling model considering gas-heat dynamic characteristics in detail. Section 4 constructs an electric-gas-heat integrated energy system model considering the dual virtual energy storage characteristics of gas-heat network. The effectiveness and economy of the source-storage-transmission coordinated optimization method are verified by simulation results. Finally, Section 5 concludes the paper.
2 Analysis of the influence of dual virtual energy storage of gas network storage and heat network storage on improving the flexibility of the system
With the widespread use of coupling equipment such as P2G, gas turbines, and CHP, the connection between power systems, natural gas systems, and thermal systems has become closer and closer. They have been interconnected to form an integrated energy system, so that the power grid, gas network, and heating network can achieve flexible mutual assistance to solve the problem of insufficient flexibility in the operation of a single system.
In the period when wind power generation cannot be fully consumed by the power system, the gas network uses pipe storage and P2G to convert the part of wind power that is not consumed by the electric load into natural gas stored in the natural gas pipeline, and the gas network pipe storage rises to improve the downregulation flexibility of the power system. During the period of large gas load demand, the stored natural gas is released, and CHP and gas-fired units are used to generate heat to meet the demand of the system’s electric heating gas. While the gas network storage and gas source cost are reduced, the load loss caused by the insufficient output limit of the thermal power unit is solved, and the flexibility of the power system is improved.
During the period of large wind power generation and large heat load demand, the CHP output is replaced by the heat release of the heat supply network, so as to give the discharge space for wind power to maximize the absorption of wind power to avoid wind abandonment and reduce the flexibility of the gas source output to improve the system. In the period of small wind power and small heat load demand, CHP releases heat and discharges in advance, reduces the output of high-cost gas units, and uses the heat storage capacity of the heating network to store heat, so as to prepare for the subsequent heat load peak and wind power discharge, and improve the flexibility of the system.
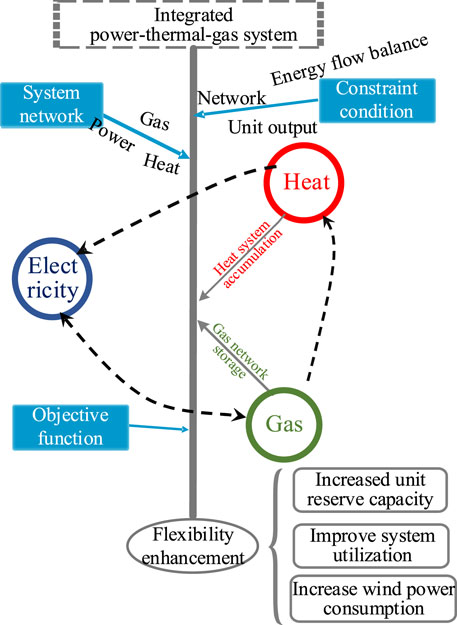
It can be seen that the dual virtual energy storage of gas network management and heat network storage can be used as a flexible resource to store excess wind power. The coordinated operation of the two further increases the utilization efficiency and storage energy of the virtual energy storage of the two networks. The interaction of the virtual energy storage of the two networks provides more energy conversion space for the P2G and CHP coupling units to realize the consumption of wind power. At the same time, the coordination of the two virtual energy storage can increase the adjustable space of the unit and improve the flexibility of the system. The principle of gas-heat dual virtual energy storage to improve the flexibility of electric-gas-heat system is shown in Figure 1.
3 A day-ahead optimal scheduling model of IES considering gas-heat dynamic characteristics
In this paper, an IES model considering the gas-heat dynamic characteristics is constructed to realize the dual virtual energy storage effect in the gas and heat networks. The gas network management and storage characteristics are used to solve the difference between the wind power trough and the gas load time during P2G operation. The delay characteristics of the heat network are used to solve the problem of wind curtailment caused by CHP “heat-determined power” when the wind power peak-valley and heat load peak-valley differences. The gas network storage and heat network storage are used as the carrier of IES energy storage and release to improve the system’s wind power consumption and meet the load demand. CHP, P2G and gas turbine can realize heterogeneous energy conversion and flexibility as three kinds of energy network coupling equipment of electricity-gas-heat.
3.1 Objective function
The scheduling model proposed in this paper fully considers various operating costs in the electricity-gas-heat system as shown in Formula 1, including the unit operating cost in the power system, the gas source purchase cost in the natural gas system, and the CHP operating cost in the thermal system. At the same time, in order to fully consider the upregulation flexibility and downregulation flexibility of the system, the wind curtailment penalty cost and various load shedding penalty costs are introduced, so that the system can achieve optimal economy under the premise of meeting the needs of electricity, gas and heat.
In the formula: T is the scheduling cycle; C is the operation cost of the selected scheduling scheme; Ωh is the set of conventional unit nodes;
3.2 Power network constraints
In this paper, DC power flow constraints are adopted. The constraints are as follows:
3.2.1 Generator output constraints
The output constraints and climbing constraints of thermal power units are shown in Eqs 2, 3:
In the formula:
3.2.2 Power balance constraints
Power balance constraints are shown in Formula 4:
In the formula: a and b are the first and last nodes of the power grid branch respectively; ΩqL for the grid branch set; PLab,t and PLba,t are the inflow and outflow power of ab branch at time t;
3.2.3 Line power constraints
Line power flow constraints are shown in Eqs 5, 6:
In the formula: PmaxL the upper limit of the transmission power of the line; Xab is the node reactance; θa,t, θb,t is the node voltage of a and b at time t.
3.3 Natural gas network constraints
3.3.1 Gas source constraints
The gas source output constraint is shown in Eq. 7.
In the formula: Qк,max and Qк,min are the upper and lower limits of the output of the gas source respectively.
3.3.2 Natural gas energy flow constraints
The flow balance diagram of each node in the natural gas network is shown in Figure 2.
The mathematical equilibrium equation of energy flow in natural gas network is shown by Eq. 8.
In the formula:
3.3.3 Pipeline flow constraints
The flow rate of natural gas in the pipeline is related to the parameters of natural gas itself, environmental factors and pipeline related parameters. The properties of natural gas itself include gas pressure p, gas density ρ, gas flow rate v, gas flow rate F, environment-related parameters include standard gas density ρ0 and temperature T; the properties of gas pipeline include friction coefficient fr, pipeline diameter D, gas constant R and compression coefficient Z. The material balance equation and gas momentum equation are as follows:
In the formula: t and x are the time dimension and the spatial dimension respectively.
Through the finite implicit difference method (Liu et al., 2021a), the partial differential equation is transformed into an algebraic form of Weymouth equation, as shown in Eq. 13.
The flow calculation formula is shown in Formula 14.
In the formula: pm,t and pn,t are the pressure of nodes m and n at time t respectively; among them, the gas source node pressure is constant; Lmn and Dmn are the length and diameter of the pipeline between the mn nodes of the pipeline; Fmn,t is the average flow rate of mn pipeline at time t. In order to conveniently express the relationship between the two state variables of natural gas flow and pressure, the intermediate variable is represented by CM.
3.3.4 Second-order cone relaxation model
Due to the existence of the square term and the absolute value term in Formula 13, this paper uses the second-order cone relaxation model in (Yang et al., 2023) to solve the nonlinear problem in the model. As shown in Eqs 15–17.
In the formula (Keyaerts et al., 2012; Ansari et al., 2021): Ψ is the penalty coefficient of the node pressure difference; θp is the penalty cost of node pressure difference. The second-order cone relaxation method in (Yang et al., 2023) is used to deal with the Weymouth equation without considering the pipeline flow loss and compressor flow loss, and the influence of the pressure error of the gas network pipeline node on the system scheduling result under the minimum operating cost target can be ignored.
3.3.5 Compressor constraints
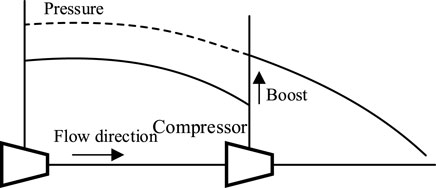
With the flow of natural gas in the pipeline, the gas pressure will gradually decrease. In order to maintain the pressure required for gas flow in the pipeline, it is necessary to install compressors on some gas network nodes to increase the pressure required for gas flow. The principle of the compressor is shown in Figure 3.
Compressor constraints are as follows:
In the Formula 18, Gmn,t is the gas consumption of mn branch of compressor at time t; ηp is the consumption coefficient of the compressor. In this paper, the compressor loss is not taken into account, and ηp is 0 (Ansari et al., 2021).
3.4 Thermal network constraints
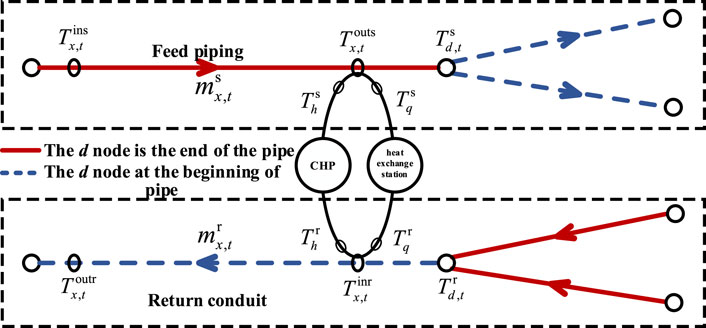
The thermal system is an energy system that provides heat supply to users. It is mainly composed of three parts: heat source (CHP unit), thermal network and residential users (heat load). Among them, the heating network in the thermal system is composed of two network waterways: the water supply network starting from the heat source and the return water network starting from the user side. The spatial structure of the two waterways is exactly the same. The heat in the hot water network is transmitted in the form of liquid or water vapor through the heat carrier, and the heat is transmitted to the heat load side through the thermal network pipeline for users (Li et al., 2016). The structure of the thermal system is shown in Figure 4.
As a medium of heat transmission, heat supply network is an important part of the thermal system. The heat supply network is divided into primary pipe network and secondary pipe network from the transmission level, and inlet pipe network and return water pipe network from the spatial structure. Among them, the primary pipe network, the secondary pipe network, the inlet pipe network and the return water pipe network take the heat exchange station as the connection point, and the spatial structure of the pipe network is exactly the same. The heat source heats the water to a certain temperature and then transmits it to the primary pipe network. After the hot water flows through the heat exchange station, the water temperature is converted into the temperature required by the user, and then it flows into the secondary pipe network and is transmitted to the thermal user. After the hot water is used by the user, the water temperature decreases, and the partially cooled water flows back to the heat source through the heat exchange station through the return water pipe to achieve recycling. The secondary pipe network in the thermal system is small in scale and short in transmission distance, so only the primary pipe network is considered and the secondary pipe network is ignored in the analysis of the thermal system.
In addition to the basic structure of the thermal system, the hydraulic model is used to represent the flow and temperature relationship of the head and end of each water supply and return pipe network, the flow and temperature relationship of the connection node and the temperature constraint of the mixed node in the system. The node temperature of the heating network can be divided into two categories: water supply temperature and return water temperature. In this paper, it is assumed that the mass flow rate in the heating pipe network is constant, and the primary heating network quality adjustment method is adopted, that is, the mass flow rate of hot water in the heating network is not changed, and the water temperature is only adjusted. This adjustment method is adopted in the thermal network in most areas of northern China (Li et al., 2016).
3.4.1 Heat source (CHP) node constraints
The heat output of the CHP unit at the heat source node can be expressed as:
In Eqs 20,
3.4.2 Heat load (heat exchange station) constraints
The relationship between the thermal power of the load node and the node temperature can be expressed as:
In Eq. 21, Φq is the heat load demand of the user node;
In operation, the heating network of the thermal system needs to meet the upper and lower limits of the temperature of supply and return water at the node of the heat exchange station, as shown in Formula 22.
3.4.3 Thermal network constraints
The nodes connecting more than two pipelines in the thermal network are called intersection nodes. Different thermal pipelines flowing through the nodes converge here. The temperature of the mixed nodes is determined by the flow and temperature of the intersection pipelines. The total heat energy of the intersection node determines the temperature, and the temperature of the node can be calculated by the weighted average of the temperature and flow of all the injected pipes. The flow diagram of heating network is shown in Figure 5.
The temperature of the junction node in the heating network is shown by Formula 23, 24.
In the formula: Ωpipe- and Ωpipe+ are the heat pipes with node d as the end node and the head node in the heat network.
In the formula:
3.5 Coupling device constraints
3.5.1 Gas turbine constraints
In this paper, the gas turbine unit model uses gas source purchase and P2G gas production as fuel to convert natural gas in the gas network into electrical energy without pollution (Wei et al., 2017b). The relationship between the gas turbine ε output PGT ε, t and its gas consumption
The calculation formula of gas turbine output is shown in Formula 27:
In the formula: μGT is the conversion efficiency coefficient; its power and climbing constraints, the same type (2), (3).
3.5.2 Power-to-gas equipment constraints
The power-to-gas equipment can cooperate with the gas network storage to convert the excess electricity into natural gas and store it in the gas network, reducing the system abandoned wind and improving the flexibility of the system downregulation. The specific principle of electricity-to-gas is divided into two parts: electrolysis and methanation, as shown in Figure 6.
The energy conversion efficiency of P2G is 45%–60%, and the value is 50%. This paper focuses on the impact of P2G wind power on the flexibility of the system, ignores the reaction process of each fine link, and adopts the total conversion reaction formula (Zhang et al., 2018). The output calculation formula of P2G equipment is shown in Formula 28 and 29.
In the formula: φ is the energy conversion coefficient; HGV is the high calorific value of natural gas; ηP2G is conversion efficiency;
3.5.3 Cogeneration unit (CHP) constraints
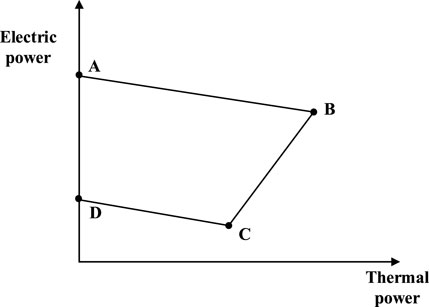
Cogeneration units consume natural gas to generate heat and electricity input to the heating network and the power grid, and have a flexible operating area range, which is an important heating source in the thermal system. The operating region of the CHP unit is very flexible, which is composed of the operating boundary of the back pressure and condensation modes. The electric and thermal operating regions can be represented by a planar quadrilateral, as shown in Figure 7.
The mathematical expressions of CHP feasible region are shown in Eqs 30, 31.
In the formula:
Among them, the natural gas supply required for CHP operation to generate heat and generate electricity is shown in the following Formula 32:
Among them, the efficiency of the ηCHP production unit.
3.6 Natural gas dynamic model constraints
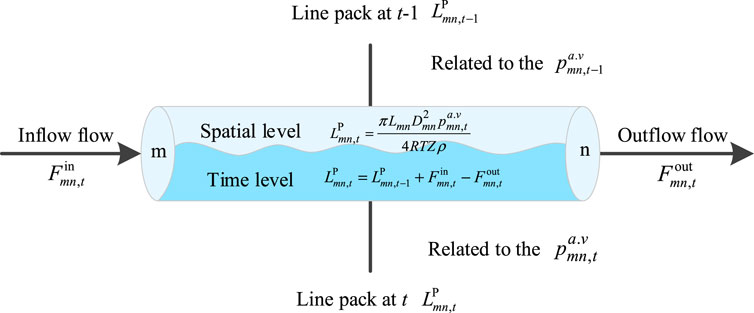
The traditional natural gas steady-state model believes that the inflow and outflow of natural gas are equal at all times, which is contrary to the delay and buffer of the actual flow of natural gas in the pipeline. Making full use of this dynamic characteristic can not only refine the gas network model, but also participate in the system scheduling as a flexible resource to improve the flexibility of the system. The natural gas dynamic model is shown in Figure 8.
The expression of pipeline inventory considering the dynamic effect of natural gas (Correa-Posada and Sánchez-Martín, 2015; Liu et al., 2022) is as follows:
Eq. 33 is the calculation formula of pipe storage
3.7 Thermal network dynamic model constraints
3.7.1 Dynamic hydraulic model of heating network
In the heating network water pipeline, the temperature change of the inlet is slowly transmitted to the outlet, and the time consumed is about the transportation time of the unit mass flow through the pipeline (Li et al., 2016). The heat has transfer delay and temperature loss in the dynamic transmission process of the heating network (Jiang et al., 2020; Jiang et al., 2021; Xu et al., 2021), and the principle of transfer delay is shown in Figure 9.
Without considering the temperature loss and pipeline delay, the temperature at the end of the heating network pipeline at time t is equal to the temperature at the beginning of the pipeline at the same time. As shown in Formula 36.
In Eq. 37, if the pipeline delay time τ caused by the heat transfer delay is considered, the pipeline delay time calculation formula is τ:
If the pipeline delay time τ caused by the heat transfer delay is considered, the pipeline delay time calculation formula is τx:
In Eq. 38, considering the time delay of pipeline transmission, the outlet temperature should be corrected as follows:
3.7.2 Dynamic thermal model of heating network
In the hot water pipe network, the flow process of hot water from the inlet to the outlet will produce heat loss. In Eq. 39, the temperature at the outlet of the pipe is:
In the formula: λ is the thermal conductivity of the heat network pipeline, Ta,t is the external temperature. When the length of the thermal network pipe network is short, the heat loss generated during the flow process can be ignored.
4 Case study
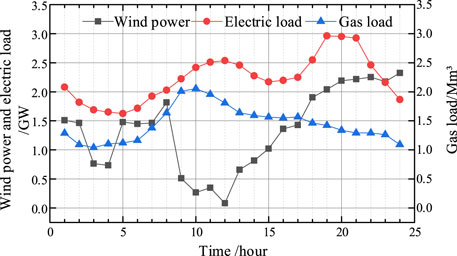
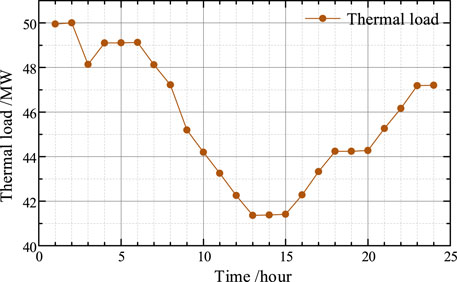
The structure of the example in this paper is shown in Supplementary Figure SA1, including a 24-node power system, 20-node natural gas network and 6-node thermal network. Power grid data (Correa-Posada and Sánchez-Martín, 2015), natural gas network data (De Wolf and Smeers, 2000), heating network data are shown in the Supplementary Table. The day-ahead electricity, gas load and wind power forecast data are shown in Figure 10, and the heat load data are shown in Figure 11. The second-order cone relaxation method used in this paper to deal with the Weymouth nonlinear equation avoids the generation of a large number of 0–1 variables, so that the overall solution model has good computational efficiency, and the system operation time is 47.74 s.
4.1 Analysis of scheduling results
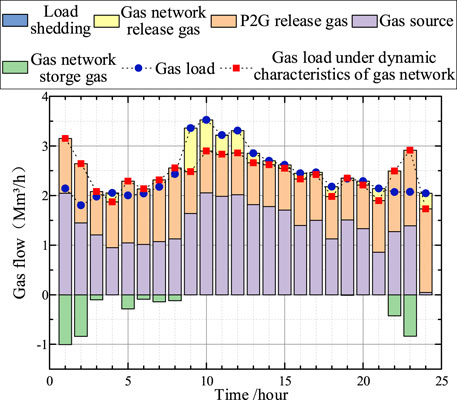
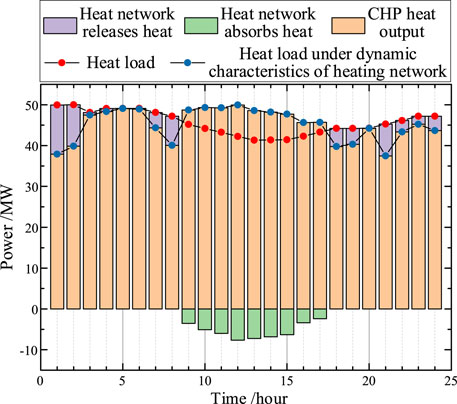
In this paper, the optimal scheduling model of electric heating system considering the dual virtual energy storage effect of gas network storage and heat network storage is adopted. The scheduling results of electric, gas and heat systems are shown in Figures 12–14.
In the figure, the pipeline storage of the natural gas network increases from 01:00–08:00 and 22:00–23:00. Because this period is the stage of wind power generation with low gas load and electricity load, during this period, P2G equipment will convert wind power not absorbed by the grid into natural gas and store it in the natural gas pipeline. The pipeline storage of natural gas pipeline will increase to improve the flexibility of the system to be used when the gas load increases later, and at the same time, the demand for gas source output will be reduced to reduce the gas purchase cost. From 09:00 to 21:00 and 24:00, the pipeline storage of the natural gas network decreases. As the wind power output decreases and the demand for electric load and gas load increases during this period, it is necessary to increase the output of gas and thermal power units to meet the power load demand of the system and supplement the lack of upward adjustment flexibility of the power system. As a result, the gas load demand is greater, requiring the natural gas network to release the previously stored natural gas, while the gas source output is increased to meet the gas load demand of the system, and the two work together to cope with the load cutting risk caused by the insufficient flexibility of the system.
In the figure, heat is released by the thermal network during the hours of 01:00–08:00 and 18:00 to 24:00. Because the heat load demand is large during this period, it is necessary for the heat supply network to release the stored heat during this period, and consume natural gas through CHP (heat source) and a small number of gas units to generate a large amount of heat to meet the heat load demand at this time. From 09:00 to 17:00, heat storage is carried out in the thermal network. Because the heat load demand is the lowest and the wind power output is the lowest during this period, in order to reduce the pressure of heat load and electricity load increase at night, the remaining heat source output is stored in the thermal network to improve the flexibility of the power system.
4.2 Analysis of dynamic characteristics of dual virtual energy storage of gas network storage and heat network storage
In order to study the influence of gas network storage characteristics and heat network storage characteristics on the flexibility of IES, this paper sets up four schemes for comparative analysis, which are as follows:
Scheme 1: Do not consider the dynamic characteristics of gas network storage, the dynamic characteristics of heat network storage.
Scheme 2: Without considering the dynamic characteristics of gas network storage, considering the dynamic characteristics of heat network storage.
Scheme 3: Consider the dynamic characteristics of gas network storage, do not consider the dynamic characteristics of heat network storage.
Scheme 4: Considering both the dynamic characteristics of gas network management and the dynamic characteristics of heat storage in heating network.
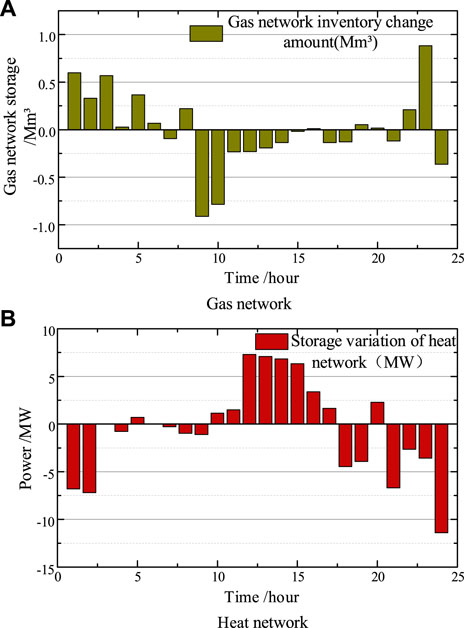
In this section, the dynamic characteristics of gas network management and storage and the dynamic characteristics of heat network storage are analyzed separately, and the operation characteristics of network “virtual energy storage” characteristics in the IES constructed in this paper under the conditions of Scheme 2 and Scheme 3 are explored respectively. The changes of storage energy in thermal network and natural gas network are shown in Figure 15.
Firstly, the energy change of the thermal network under the action of the heat storage characteristics of the thermal network delay transmission is analyzed, that is, the heat charge and discharge change of the thermal network in Scheme 2 is shown in Figure 15A. It can be seen from the figure that the thermal network releases heat during the period of 1: 00–9: 00. This is because the wind power in this period belongs to the peak period as a whole. At this time, P2G converts part of the wind power into natural gas and injects it into the natural gas network. This is because P2G can only convert wind power that meets the transient natural gas load demand without considering the storage effect of the gas network. In order to reduce the cost of wind curtailment in the system, the thermal network presents an exothermic trend, which makes CHP reduce the thermal output and reduce the generated electric power, so as to absorb more wind power and reduce the amount of wind curtailment in the system to improve the flexibility of the system. During the period of 10: 00–17: 00, the thermal network began to enter the heat storage stage, which corresponded to the trough stage of wind power.
In this period, the wind power is small. In order to meet the demand of electric load, CHP increases the output electric power while the output heat power also increases. However, the heat load in this period belongs to the excess heat production of CHP in the trough period. In order to absorb the excess heat generated by CHP, the thermal network is used for heat storage to improve the flexibility of the system. However, the lack of gas network storage will lead to the decrease of the amount of natural gas provided to CHP, which will affect the heat storage efficiency. The 18: 00–24: 00 period is also the peak period of wind power and heat load. Like the 10: 00–17: 00 period, the heat storage and energy storage characteristics of the delayed transmission of the thermal network are used to release heat and consume more wind power.
Then, the energy change of the natural gas network under the separate action of the pipe storage effect of the dynamic characteristics of the natural gas network is analyzed, that is, the change of the pipe storage of the natural gas network in Scheme 3 is shown in Figure 15B. The natural gas network stores energy during the period of 1: 00–8:00. At this time, the wind power is at its peak, and P2G converts the remaining part that is not used by the electric load into natural gas injected into the natural gas network to increase the pipe storage and improve the flexibility of the system. However, because the dynamic characteristics of the heating network are not taken into account, the CHP needs to generate higher heat during the peak period of the heat load and still generates electric power into the power grid. Therefore, the failure to continue to consume wind power after the P2G reaches the rated capacity will cause a lot of wind power waste. During the 9:00–18:00 period, the wind power is reduced, and the gas network storage is in a release state to provide gas turbines and CHPs to meet the electric load demand to improve the system’s upregulation flexibility. However, CHP can only generate a small amount of electricity associated with heat, so that the gas turbines with high operating costs account for the main output, resulting in increased operating costs. The 19:00–24:00 period is the same as the larger stage of wind power. P2G operation converts redundant wind power into natural gas injection into the natural gas network and restores the initial pipe stock at the end of the scheduling cycle.
4.3 Analysis of dual virtual energy storage characteristics of gas network storage and heat network storage
4.3.1 Scheme 2 compared with Scheme 4
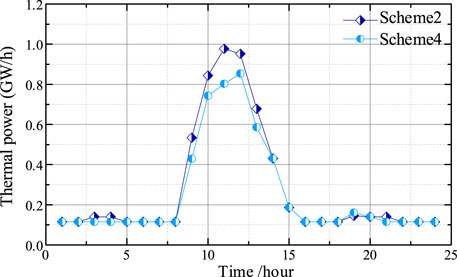
This section studies the impact of dual virtual energy storage formed by the combination of gas network dynamic characteristics and heat network dynamic characteristics on IES scheduling. Firstly, the influence of the system with or without the gas network storage characteristics under the heat storage characteristics of the heat network is analyzed, and the Scheme 4 is compared with the Scheme 2. Figure 16 is the heat storage comparison diagram of the heat network of Scheme 2 and Scheme 4.
It can be seen from Figure 16 that the charging and releasing capacity of the heat supply network is improved after taking into account the storage effect of the gas network. The improved charging and releasing capacity of the heat supply network makes the decoupling effect of CHP during operation more obvious. During 1:00–9:00, the wind power heating network releases heat, but there is still a heat storage working period in Scheme 2, which is because the heat release cannot be carried out due to the overall constraints of the system, leading to the heat storage state of the heat network at that time. In Scheme 4, P2G can absorb more wind power after adding the storage characteristics of gas management, so that the heat release efficiency of the thermal network in the stage of wind power generation can be improved, and the flexibility of the heat network can be improved.
In the 10: 00–17: 00 period, in order to solve the large power load during the low wind power period, the CHP emits electric power and produces heat at the same time, so that the thermal network is in the heat storage stage. It can be seen from the figure that Scheme 4 improves the heat storage capacity of the thermal network after adding the gas network storage. This is because the power generation cost of CHP is less than that of the gas turbine, and more natural gas can be supplied after adding the pipe storage characteristics, which saves the cost of CHP operation. The 18: 00–24: 00 period and the 1: 00–8: 00 period are the same as the heat release stage of large wind power generation and small electric load, which will not be repeated here. It should be noted that the heat release of Scheme 2 is greater than that of Scheme 4 at the end of the scheduling period. This is because the gas network management needs to consume more natural gas than the initial storage to restore the initial value, and further heat release cannot be performed.
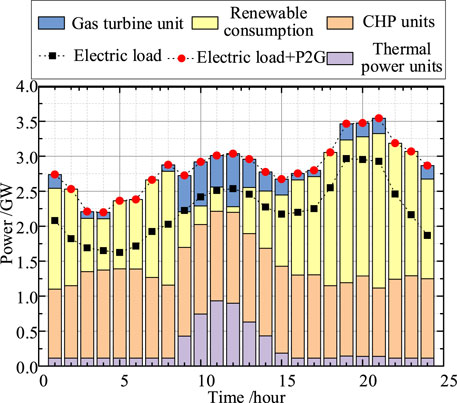
Figure 17 compares the output of the generator set of Scheme 2 and Scheme 4. It can be seen clearly that the output of the generator set of Scheme 4 is significantly smaller than that of Scheme 2 during the peak power consumption period of 8: 00–13: 00. This is because the gas network storage can release additional natural gas so that CHP has greater operating power to meet the power load during this period. This shows that considering the characteristics of gas network management and heat storage characteristics of heat network, the power generation rate of CHP during the peak period of power load can be increased, so that CHP with lower power generation cost can give priority to power generation to meet the power demand, so that the system cost is reduced and the overall economy is improved.
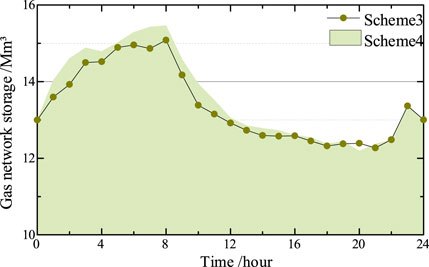
Next, the influence of the dynamic heat storage characteristics of the system with or without the heat network under the characteristics of the gas network management is analyzed, and the comparison between Scheme 3 and Scheme 4 is carried out. Figure 18 is the comparison diagram of gas network management and storage between Scheme 3 and Scheme 4.
4.3.2 Scheme 3 compared with Scheme 4
In Figure 18, it can be seen that the overall gas network management storage of Scheme 4 is larger than that of Scheme 3. Firstly, in the 1: 00–8: 00 period of wind power generation, Scheme 3 does not take into account the dynamic heat storage characteristics of the heat network. CHP can only follow the heat load change operation in strict accordance with the way of heat power determination, which makes the electric power generated by CHP make the wind power can’t be fully utilized, resulting in a large number of abandoned wind phenomena. Scheme 4 considers the dynamic heat storage characteristics of the heating network. At this time, the CHP heat production of the wind power peak heating network is reduced in the exothermic state, so that the wind power is consumed as much as possible by the power grid. The P2G operation converts the wind power into natural gas and enters the natural gas pipeline network, resulting in an increase in pipe storage. During this period, the thermal network and the natural gas network form a dual energy storage, which increases the upper limit of the gas network management and storage operation of Scheme 4, and enables more natural gas to be stored in the network to be used during the peak demand of power supply load.
At 9: 00–15: 00, the gas network inventory showed a downward trend, which was caused by the decrease of wind power and the increase of electric load demand. At this time, the thermal network in Scheme 4 is in a state of heat storage, but the gas network management stock in Scheme 3 is still smaller than that in Scheme 4. This is because Scheme 4 uses more CHP than Scheme 3, and CHP The amount of natural gas required to emit the same amount of electricity is much smaller than the amount of natural gas required by the gas turbine and the price is cheaper. At 16: 00–24: 00, the gas network inventory showed a gradual downward trend, and the initial storage value was restored after a small range of growth fluctuations. Similar to the period of 1: 00–8: 00, the gas network management stock of Scheme 4 is still larger than the gas network management stock of Scheme 3 as a whole, but it is limited by the recovery of initial storage. It is impossible to have a large natural gas storage difference like the pipe stock of the first wind power generation period.
It can be seen that the heat storage characteristics of the heat network combined with the characteristics of the gas network management and storage can transform the operation-limited CHP from a heat-determined operation mode to a more flexible and economical operation mode, and improve the utilization efficiency of the gas network management and storage. And natural gas energy can be converted into electrical energy and thermal energy, thereby enhancing the energy reserve capacity of the system, so that the overall flexibility and energy reserve of the system have been greatly improved.
From the comparison of gas source output in Figure 19, it can be seen that the gas source output in Scheme 3 without considering the dynamic heat storage characteristics of the heat network is larger than that in Scheme 4 as a whole. Although both Scheme 3 and Scheme 4 take into account the dynamic storage characteristics of the gas network, there is still a large gap between the gas source output of the two schemes, which shows that the dynamic heat storage characteristics of the heat network affect the operation state of the whole natural gas network in IES. In the period of 1: 00–8: 00 during the peak period of wind power, the gas source output of Scheme 3 is larger than that of Scheme 4, while the increase of pipeline storage of Scheme 4 is larger than that of Scheme 3. This is because the heat released by the thermal network of Scheme 4 at this time reduces the gas consumption of CHP, thus reducing the gas source output and increasing the pipeline storage.
During the period of 9: 00–15: 00, due to the thermal network of Scheme 4 is in the state of heat storage, CHP emits more thermal power. At this time, Scheme 3 does not take into account the heat storage characteristics of the heat network and the CHP output is small when the thermal load is at the valley, which leads to the gas turbine with large gas consumption to make up for the power required at the peak of the electric load. Therefore, Scheme 2 will have a large natural gas demand in this period. However, the gas network inventory can only provide a part of natural gas due to constraints such as endpoint pressure, so the gas source output in Scheme 3 is still greater than that in Scheme 4. The working principle of the gas source in the 16: 00–24: 00 period is the same as that in the 1: 00–8: 00 period. Therefore, considering the dynamic heat storage characteristics of the heating network, the gas source output is effectively reduced, and the gas source reserve capacity is increased to make the system have more energy sources as a whole, thereby improving the system flexibility.
4.4 Analysis of the influence of dual virtual energy storage characteristics of gas-heat network on IES scheduling results
Through the demonstration and analysis in the previous section, it can be seen that IES makes the system realize the flexibility mutual benefit between the two kinds of network energy through the dual virtual energy storage characteristics of the natural gas network and the thermal network, and further exploits the flexibility potential of the delayed transmission energy network. Next, the wind power consumption capacity of the system under the four operation schemes and the economy of each operation scheme are analyzed. Finally, by adjusting the wind power penetration rate, whether the dual network virtual energy storage scheduling scheme proposed under the condition of multi-scenario wind power penetration rate still has the advantages of flexibility and economy compared with other schemes is tested.
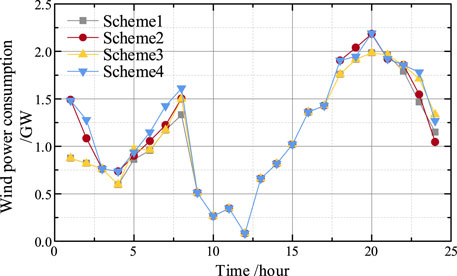
Firstly, the results of wind power consumption under the four schemes set in this paper are analyzed, as shown in Figure 20.
It can be seen from Figure 20 that the scheduling scheme considering the dual virtual energy storage characteristics of gas network dynamic pipe storage and heat network dynamic heat storage proposed in this paper is that Scheme 4 has the largest wind power consumption in the scheduling period, and Scheme 1 without considering the dynamic characteristics of the network has the smallest wind power consumption in the scheduling period. Scheme 2 and Scheme 3 are affected by network structure constraints, coupling equipment constraints and objective functions. The comparison of wind power consumption in the scheduling period is different, but the wind power consumption efficiency of the two schemes is greater than that of Scheme 1.
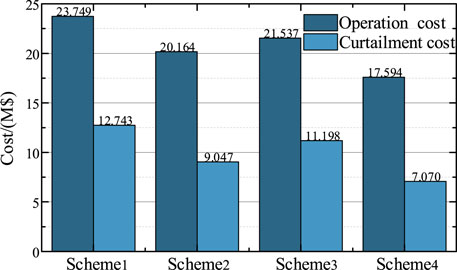
The scheduling cost comparison of the system under the four schemes is analyzed below, as shown in Figure 21.
Figure 21 shows that different scheduling schemes not only affect the system operation cost, but also affect the wind power curtailment cost (wind power consumption). The scheme proposed in this paper has the smallest operation cost and wind power curtailment cost. The system operation cost is mainly related to the cost of each unit and the gas source. Table 1 is the average operation data comparison of each unit and the gas source in the 24 h scheduling cycle under the four operation schemes.
It can be seen from the data in the table that the average operating power of the proposed thermal power unit considering the dynamic energy storage characteristics of the network is reduced compared with the average operating power of the thermal power unit in Scheme 1, so that the standby capacity is increased. The increase in the average operating power of the power to gas can absorb more wind power, and it can be seen that the natural gas generated by the power to gas can reduce the output of the gas source to reduce the cost. This fully demonstrates the impact of virtual energy storage in both natural gas and thermal networks on improving system flexibility and reducing operating costs. In general, after taking into account the virtual energy storage characteristics of the network, the energy in the network can be fully utilized. The network consumes excess wind power by changing the energy storage state, and meets the load demand by releasing the energy state and reducing the operation output of each unit equipment to improve the flexibility of the unit.
In order to verify whether the dual virtual energy storage characteristics of gas-heat network proposed in this chapter can still have high wind power consumption rate and good economy under different wind power penetration rates, the scheduling Scheme 4 and Scheme 1 proposed in this chapter are selected for comparison and verification. Five kinds of wind power penetration scenarios are set up for analysis and comparison, so that the wind power penetration rate increases gradually from 80% to 120% with a step size of 20%, and the comparison between operation cost and wind curtailment cost is shown in Figure 22.
It is shown in the figure that the scheduling scheme proposed in this chapter considering the dual storage characteristics of gas-heat network can have the lowest operating cost and wind abandonment cost under different wind power penetration rates, which verifies that the scheduling scheme proposed in this question can effectively adapt to changes in wind power penetration rates and cope with the instability factors that may be brought by environmental changes in actual projects.
5 Conclusion
Based on the dynamic pipe-storage characteristics of natural gas network and the dynamic delay characteristics of heating network, this paper constructs an electric-gas-heat integrated energy system considering the dual virtual energy storage characteristics of gas-heat network, which further improves the overall wind power consumption capacity and unit reserve capacity of the system, thus improving the flexibility of the system. The conclusions obtained through the example analysis are as follows:
(1) In IES, the dual virtual energy storage of gas network storage and heat storage of heat network can improve the wind power absorption capacity of the system at the peak of wind power, and raise the valley value of the system net load curve to improve the flexibility of the system. Under the premise of meeting the system load demand, the conventional unit output is reduced, and the standby capacity of the unit is increased to improve the upregulation flexibility of the system.
(2) By comparing Scheme 4 with Scheme 2 and Scheme 3, it can be seen that the IES scheduling strategy considering the dual virtual energy storage characteristics can significantly improve the charging and discharging efficiency of the gas-heat network. The coordination of the two networks greatly improves the limitations of the network storage characteristics when they act alone, and fully mobilizes the flexibility of various resources of electricity, gas and heat.
(3) It is verified that the scheduling schemes of different network virtual energy storage characteristics affect the wind power consumption capacity of IES and the average output of the unit, thus affecting the overall operating cost of the system. In addition, the scheme in this paper has the optimal system scheduling cost and the highest wind power utilization rate under different wind power penetration rates, so that IES has the flexibility to deal with uncertain factors such as wind power and load.
The next research will focus on the scheduling method combining the dynamic partial differential model based on fluid dynamics with a finer time scale and the multi-time scale day-ahead-day rolling scheduling, and further explore the flexibility relationship between the electricity-gas-heat interconnected system and the operability of the double-layer virtual energy storage to cope with load fluctuations and flexible supply and demand adjustment.
Data availability statement
The original contributions presented in the study are included in the article/Supplementary Material, further inquiries can be directed to the corresponding author.
Author contributions
XY: Funding acquisition, Methodology, Resources, Writing–original draft, Writing–review and editing. YL: Methodology, Writing–original draft. HZ: Investigation, Methodology, Writing–original draft. QG: Methodology, Writing–original draft. XL: Writing–original draft. JS: Writing–original draft.
Funding
The author(s) declare financial support was received for the research, authorship, and/or publication of this article. This study was supported by State Grid Corporation headquarters technology project (4000-202399368A-2-2-ZB).
Acknowledgments
I express my heartfelt thanks to teacher XY and my classmates. I was very touched by their kind help in revising my paper. Without their supervision and guidance, I couldn’t accomplish this task.
Conflict of interest
Author HZ was employed by State Grid Changchun Power Supply Company. Authors QG and XL were employed by State Grid Hebi Power Supply Company. Author JS was employed by State Grid Wenzhou Power Supply Company.
The remaining authors declare that the research was conducted in the absence of any commercial or financial relationships that could be construed as a potential conflict of interest.
Publisher’s note
All claims expressed in this article are solely those of the authors and do not necessarily represent those of their affiliated organizations, or those of the publisher, the editors and the reviewers. Any product that may be evaluated in this article, or claim that may be made by its manufacturer, is not guaranteed or endorsed by the publisher.
Supplementary material
The Supplementary Material for this article can be found online at: https://www.frontiersin.org/articles/10.3389/fenrg.2023.1331428/full#supplementary-material
References
Adams, J., O’malley, M., and Hanson, K. (2010). Flexibility requirements and potential metrics for variable generation: implications for system planning studies. Princeton, NJ: NERC, 14–17.
Ai, X., Fang, J., Xu, S., and Wen, J. (2018). An optimal energy flow model in integrated gas-electric systems considering dynamics of natural gas system. J. Power Syst. Technol. 42, 409–416. doi:10.13335/j.1000-3673.pst.2017.1372
Ansari, M., Zadsar, M., Zareipour, H., and Kazemi, M. (2021). Resilient operation planning of integrated electrical and natural gas systems in the presence of natural gas storages. Int. J. Electr. Power & Energy Syst. 130, 106936. doi:10.1016/j.ijepes.2021.106936
Cao, Y., Zhou, B., Chung, C. Y., Shuai, Z., Hua, Z., and Sun, Y. (2023). Dynamic modelling and mutual coordination of electricity and watershed networks for spatio-temporal operational flexibility enhancement under rainy climates. IEEE Trans. Smart Grid 14, 3450–3464. doi:10.1109/tsg.2022.3223877
Chai, G., Yang, X., Xu, T., Xu, M., and Chai, R. (2020). Flexibility planning method for electric power system based on Bi-level scene reduction. J J. Northeast Electr. Power Univ. 40, 11–20. doi:10.19718/j.issn.1005-2992.2020-06-0011-10
Chen, S., Wei, Z., Sun, G., Wang, D., and Zang, H. (2019). Review on security analysis and optimal control of electricity-gas integrated energy system. J. Electr. Power Autom. Equip. 39, 3–11. doi:10.16081/j.epae.201908025
Correa-Posada, C. M., and Sánchez-Martín, P. (2015). Integrated power and natural gas model for energy adequacy in short-term operation. IEEE Trans. Power Syst. 30, 3347–3355. doi:10.1109/tpwrs.2014.2372013
De Wolf, D., and Smeers, Y. (2000). The gas transmission problem solved by an extension of the simplex algorithm. Manag. Sci. 46, 1454–1465. doi:10.1287/mnsc.46.11.1454.12087
Fang, J., Zeng, Q., Ai, X., Chen, Z., and Wen, J. (2018). Dynamic optimal energy flow in the integrated natural gas and electrical power systems. IEEE Trans. Sustain. Energy 9, 188–198. doi:10.1109/tste.2017.2717600
Jiang, Y., Wan, C., Botterud, A., Song, Y., and Shahidehpour, M. (2021). Convex relaxation of combined heat and power dispatch. IEEE Trans. Power Syst. 36, 1442–1458. doi:10.1109/tpwrs.2020.3025070
Jiang, Y., Wan, C., Botterud, A., Song, Y., and Xia, S. (2020). Exploiting flexibility of district heating networks in combined heat and power dispatch. IEEE Trans. Sustain. Energy 11, 2174–2188. doi:10.1109/tste.2019.2952147
Keyaerts, N., D'haeseleer, W., and Proost, S. (2012). Gas balancing and line-pack flexibility. Concepts and Methodologies for Organizing and Regulating Gas Balancing in Liberalized and Integrated EU Gas Markets.(Gasbalancering en netwerkflexibiliteit. Leuven: Concepten en methodologieën voor de organisatie en regulering van gasbalancering in vrijgemaakte en geïntegreerde EU gasmarkten.
Keyaerts, N., Hallack, M., Glachant, J.-M., and D’haeseleer, W. (2011). Gas market distorting effects of imbalanced gas balancing rules: inefficient regulation of pipeline flexibility. Energy Policy 39, 865–876. doi:10.1016/j.enpol.2010.11.006
Li, J., Zhu, M., Lu, Y., Huang, Y., and Wu, T. (2021a). Review on optimal scheduling of integrated energy systems. J. Power Syst. Technol. 45, 2256–2272. doi:10.13335/j.1000-3673.pst.2021.0020
Li, Y., Gao, D. W., Gao, W., Zhang, H., and Zhou, J. (2021b). A distributed double-Newton descent algorithm for cooperative energy management of multiple energy bodies in energy internet. IEEE Trans. Industrial Inf. 17, 5993–6003. doi:10.1109/tii.2020.3029974
Li, Y., Zhang, H., Liang, X., and Huang, B. (2019). Event-triggered-based distributed cooperative energy management for multienergy systems. IEEE Trans. Industrial Inf. 15, 2008–2022. doi:10.1109/tii.2018.2862436
Li, Z., Wu, W., Wang, J., Zhang, B., and Zheng, T. (2016). Transmission-constrained unit commitment considering combined electricity and district heating networks. IEEE Trans. Sustain. Energy 7, 480–492. doi:10.1109/tste.2015.2500571
Liu, C., Shahidehpour, M., and Wang, J. (2011). Coordinated scheduling of electricity and natural gas infrastructures with a transient model for natural gas flow. Chaos Interdiscip. J. Nonlinear Sci. 21, 025102. doi:10.1063/1.3600761
Liu, H., Shen, X., Guo, Q., Sun, H., Shahidehpour, M., Zhao, W., et al. (2021a). Application of modified progressive hedging for stochastic unit commitment in electricity-gas coupled systems. CSEE J. Power Energy Syst. 7, 840–849. doi:10.17775/CSEEJPES.2020.04420
Liu, H., Zhao, C., Ge, S., Li, J., and Liu, J. (2021b). Sequential power flow calculation of power-heat integrated energy system based on refined heat network model. J Automation Electr. Power Syst. 45, 63–72. doi:10.7500/AEPS20200312009
Liu, P., Wu, Z., Gu, W., and Lu, Y. (2022). An improved spatial branch-and-bound algorithm for non-convex optimal electricity-gas flow. IEEE Trans. Power Syst. 37, 1326–1339. doi:10.1109/tpwrs.2021.3101883
Lv, Q., Chen, T., Wang, H., Li, L., Lv, Y., and Li, W. (2014). Combined heat and power dispatch model for power system with heat accumulator. J. Electr. Power Autom. Equip. 34, 79–85. doi:10.3969/j.issn.1006-6047.2014.05.012
Wang, C., Wei, W., Wang, J., Bai, L., Liang, Y., and Bi, T. (2018). Convex optimization based distributed optimal gas-power flow calculation. IEEE Trans. Sustain. Energy 9, 1145–1156. doi:10.1109/tste.2017.2771954
Wang, M., Mu, Y., Meng, X., Jia, H., Wang, X., and Huo, X. (2020). Optimal scheduling method for integrated electro-thermal energy system considering heat transmission dynamic characteristics. J. Power Syst. Technol. 44, 132–142. doi:10.13335/j.1000-3673.pst.2019.1097
Wei, W., Yan, X., Ni, Y., Luo, F., Zeng, Y., and Xu, R. (2017a). Power system flexibility scheduling model for wind power integration considering heating system, in 2017 IEEE Power & Energy Society General Meeting), Chicago, IL, USA, 16-20 July 2017, 1–5.
Wei, Z., Zhang, S., Sun, G., Zang, H., Chen, S., and Chen, S. (2017b). Power-to-gas considered peak load shifting research for integrated electricity and natural-gas energy systems. J Proc. CSEE 37, 4601–4609+4885. doi:10.13334/j.0258-8013.pcsee.161361
Xu, J., Hu, J., Liao, S., Ke, D., Wang, Y., and Sun, R. (2021). Coordinated optimization of integrated energy system considering dynamic characteristics of network and integrated demand response. J Automation Electr. Power Syst. 45, 40–48. doi:10.7500/AEPS20200629002
Yang, D., Wang, X., Chen, W., Yan, G. G., Jin, Z., Jin, E., et al. (2023a). Adaptive frequency droop feedback control-based power tracking operation of a DFIG for temporary frequency regulation. IEEE Trans. Power Syst., 1–10. doi:10.1109/tpwrs.2023.3277009
Yang, X., Mu, G., Chai, G., Yan, G., and An, J. (2020). Source-storage-grid integrated planning considering flexible supply-demand balance. J. Power Syst. Technol. 44, 3238–3246.
Yang, X., Sun, J., Liu, Y., Zhang, M., and Liu, J. (2023b). Scheduling strategy of coordinated operation of gas network linepack and P2G for flexibility improvement of integrated electricity-gas system. J. Power Syst. Technol. 47, 236–247. doi:10.13335/j.1000-3673
Zhai, J., Zhou, X., Li, Y., Li, F., and Yang, X. (2021). Transforming their lives: post-traumatic growth experience in Chinese women with breast cancer-a grounded theory study. J Proc. CSEE 41, 1–15. doi:10.1080/07399332.2021.1959594
Zhang, C., Feng, Z., Deng, S., Jia, C., and Lu, S. (2021a). Multi-energy complementary collaborative peak-load shifting strategy based on electro-thermal hybrid energy storage system. J Trans. CHINA Electrotech. Soc. 36, 191–199. doi:10.19595/j.cnki.1000-6753.tces.L90405
Zhang, H., Cheng, Z., Jia, R., Zhou, C., and Li, M. (2021b). Economic optimization of electric-gas integrated energy system considering dynamic characteristics of natural gas. J. Power Syst. Technol. 45, 1304–1311. doi:10.13335/j.1000-3673.pst.2020.1997
Zhang, R., Jiang, T., Li, G., Chen, H., Li, X., and Ning, R. (2018). Bi-Level optimization dispatch of integrated electricity-natural gas systems considering P2G for wind power accommodation. J Proc. CSEE 38, 5668–5678+5924. doi:10.13334/j.0258-8013.pcsee.172310
Nomenclature
Keywords: flexibility, gas network management, heat network heat storage, wind power consumption, electricity-gas-heat interconnection system
Citation: Yang X, Liu Y, Zhang H, Guo Q, Liu X and Sun J (2024) Optimal scheduling of electric-gas-heat system considering dual virtual energy storage of gas network management and heat network storage. Front. Energy Res. 11:1331428. doi: 10.3389/fenrg.2023.1331428
Received: 01 November 2023; Accepted: 04 December 2023;
Published: 11 January 2024.
Edited by:
Liansong Xiong, Xi’an Jiaotong University, ChinaReviewed by:
Yushuai Li, University of Oslo, NorwayXiong Wu, Xi’an Jiaotong University, China
Bin Zhou, Hunan University, China
Copyright © 2024 Yang, Liu, Zhang, Guo, Liu and Sun. This is an open-access article distributed under the terms of the Creative Commons Attribution License (CC BY). The use, distribution or reproduction in other forums is permitted, provided the original author(s) and the copyright owner(s) are credited and that the original publication in this journal is cited, in accordance with accepted academic practice. No use, distribution or reproduction is permitted which does not comply with these terms.
*Correspondence: Xiuyu Yang, eWFuZ3hpdXl1MjAxMUAxNjMuY29t
 Xiuyu Yang
 Yuxuan Liu1