 Wang Jianyuan*
 Sun Yibo
- Key Laboratory of Modern Power System Simulation and Control and Renewable Energy Technology, Ministry of Education, Northeast Electric Power University, Jilin, China
Non-intrusive load identification can improve the interaction efficiency between the power supply side and the user side of the grid. Applying this technology can alleviate the problem of energy shortage and is a key technique for achieving efficient management on the user side. In response to the cumbersome process of manually selecting load features and the low accuracy of identification in traditional machine learning algorithms for non-intrusive load identification, this paper proposes a method that transforms the one-dimensional reactive electric signal of the load into a two-dimensional image using Gram coding and utilizes the Residual Attention Network (RAN) for load classification and recognition. By transforming the one-dimensional electrical signal into a two-dimensional image as the input to the RAN network, this approach retains the original load information while providing richer information for the RAN network to extract load features. Furthermore, the RAN network effectively addresses the poor performance and gradient vanishing issues of deep learning networks through bottleneck residual blocks. Finally, experiments were conducted on a public dataset to verify the effectiveness of the proposed method.
1 Introduction
The current energy shortage problem is extremely severe, and the proportion of electricity consumption by urban and rural residents has been increasing year by year in our country (Lianwei and Wen, 2021; Linna et al., 2023). In this context, improving the efficiency of electricity usage for urban and rural residents can partially solve the energy shortage problem and bring significant economic benefits (Xing Nan, Xu Feng, 2017; Teng Jialun, Li Hongzhong, 2023). To optimize the efficiency of electricity utilization, non-intrusive load monitoring (NILM) technology can be considered. NILM is a technique that decomposes household electrical data to obtain specific operating states of appliances. Studies have shown that this technology can save 10%–20% of electricity for individual users (Darby, 2006).
NILM mainly consists of three main components: event detection, feature extraction, and load identification. Among them, the efficient identification of loads is the core issue in NILM research (Guo et al., 2021). Early NILM mainly applied machine learning algorithms for load feature extraction and identification classification. Reference (Figueiredo et al., 2012) proposed an algorithm to identify the step change in the electrical signal by extracting load features through step changes in active power, reactive power, and power factor. It used Support Vector Machine (SVM) and 5-nearest Neighbors (5-NN) classification algorithms for load classification, showing a certain level of accuracy. However, this algorithm is limited to triggering the identification process only when there is a step change in the power signal when the appliance is turned on or off. Reference (Gillis et al., 2015) introduced a new concept based on wavelet design and applied it to NILM by finding wavelet functions matching the load patterns. It used a decision tree classifier to establish a classification model for wavelet coefficient energy prediction of loads. However, as the number of loads to be detected increased, the accuracy decreased. Reference (Wang Jianyuan, Hou Guangzhu, Zhang Hongming, 2021) used steady-state current waveforms as features to build a database and completed the matching identification of household appliances to be detected through mutual approximate entropy values. These algorithms mainly used traditional load features such as voltage, current, and power, or machine learning algorithms like SVM and decision trees. The process was cumbersome due to manual feature selection and had certain limitations. Although the computational workload was small, the recognition accuracy was low in practical applications.
In recent years, deep learning methods have rapidly developed. They can autonomously extract key features from databases through their unique network structure and learning patterns (Kelly and Knottenbelt, 2015). Because of its outstanding performance in image classification, some scholars have begun to transform certain one-dimensional electrical quantity data of loads into two-dimensional images suitable for deep learning methods and have achieved high accuracy.
Reference (Liu et al., 2021) first analyzed the electricity usage patterns of loads, expanded the receptive field through convolutional operations, simplified the feature extraction process, and extracted richer features. Finally, load identification was carried out based on the time convolutional neural network model, achieving satisfactory recognition accuracy. Reference (De Baets et al., 2018) constructed grayscale voltage-current (V-I) trajectories, and it was verified that this construction method improved the recognition accuracy to some extent. However, due to the lack of color information and the influence of the granularity of the two-dimensional images, the recognition accuracy was still not ideal. References (Faustine et al., 2020; Faustine and Pereira, 2020) used improved recursive graphs as the two-dimensional images to be recognized, achieving better recognition results. Reference (Zhao et al., 2023) combined particle swarm optimization with convolutional neural networks to establish a load identification model. A load feature library was built based on pixelated images of V-I trajectories of various appliances. The model was validated on public datasets, showing excellent recognition capability. Although the methods based on deep learning networks have greatly improved the load recognition effect using the method of recognizing two-dimensional images, the information carried by two-dimensional images like V-I trajectories is limited. Additionally, problems such as gradient disappearance with the deepening of network layers have not been resolved, and there is still room for improvement in terms of recognition accuracy.
To address these issues and further improve recognition accuracy, this paper utilizes readily available current data as the original load information. The one-dimensional current signal of the load is transformed into Gramian Angular Fields (GAF) through Gramian matrix encoding to establish a load feature library (Wang and Oates, 2015). A deep residual network that performs well in the field of image classification was selected as the recognition model. The proposed method was validated on the public dataset PLAID (Plug-Load Appliance Identification Dataset) (Gao et al., 2014). The harmonic mean reached 98.24%, proving the effectiveness of the proposed method.
2 Non-intrusive load identification method overview
2.1 Intrusive load and non-intrusive load
Intrusive load identification involves installing sensors at various electrical devices to monitor the operational status of the load, thereby obtaining information about household electricity usage, as depicted in Figure 1. Intrusive load identification typically features complex hardware and relatively simple software. While it provides accurate data, the installation and maintenance are challenging and resource-intensive, making it unsuitable for widespread adoption and online applications.
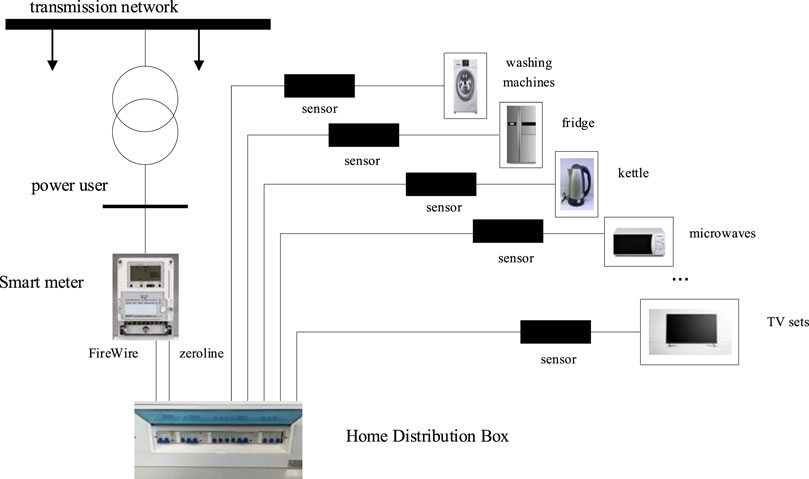
FIGURE 1. Intrusive load.
Non-intrusive load identification eliminates the need for individually installing sensors on each electrical device. Instead, a single smart meter installation allows for the monitoring of the operational status of various electrical devices. In comparison to intrusive methods, non-intrusive identification offers relatively lower economic costs, higher reliability, simpler implementation, and greater controllability. It can effectively protect data integrity, making it a convenient, efficient, and universally applicable monitoring method, as illustrated in Figure 2.
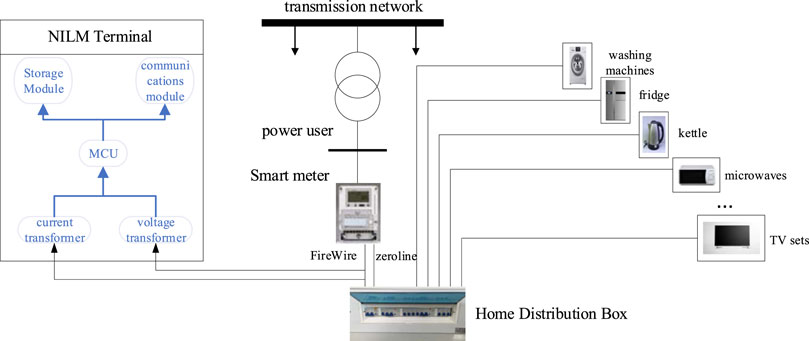
FIGURE 2. Non-intrusive load.
2.2 Non-intrusive load identification process
NILM primarily consists of four steps: data acquisition and preprocessing, event detection, feature extraction, and load identification. The algorithmic process is briefly depicted in Figure 3.
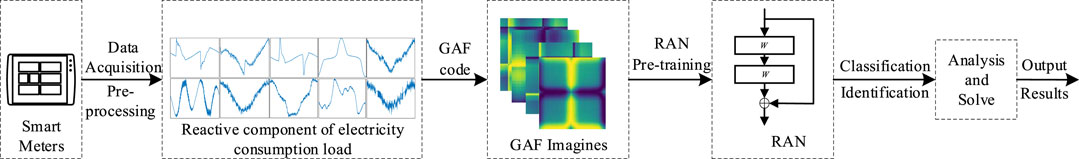
FIGURE 3. Overall process of load identification.
The algorithm proposed in this paper begins by utilizing a data acquisition device, namely, a smart meter, to gather load data. The obtained load data undergoes preprocessing, involving the extraction of the reactive power component from the current data. Subsequently, the reactive power component is transformed into a two-dimensional image using a Gramian Angular Field. A pre-trained RAN networks is then employed to extract the load features from the two-dimensional image. Finally, the load is classified and identified based on different device categories, and the results are transmitted to the smart monitoring terminal for load monitoring.
3 Event detection
Event detection is a crucial step in implementing NILM. Its purpose is to determine the exact occurrence time and basic characteristics of load-switching events. Concise and efficient event detection is a prerequisite for the successful classification in subsequent steps. To achieve this goal, this paper implements event detection based on the significant fluctuation in the root mean square (RMS) current during load-switching events. The process of event detection is illustrated in Figure 4.
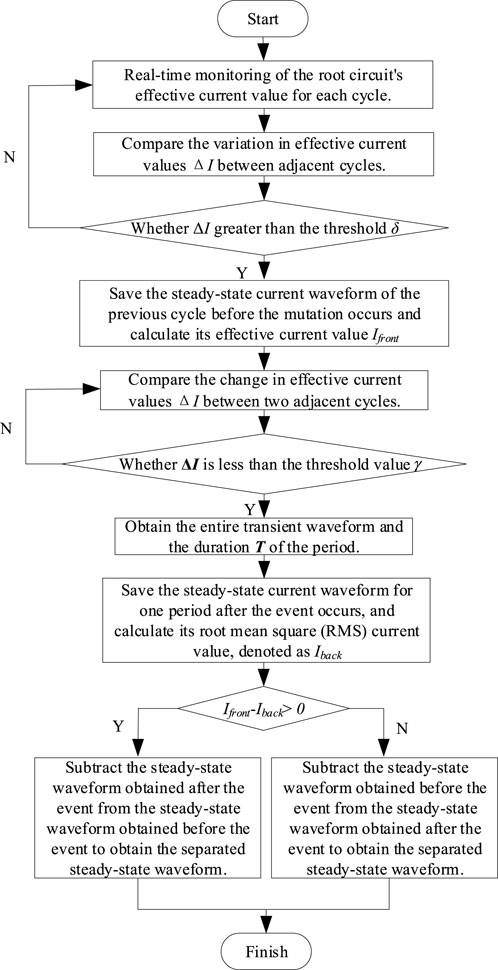
FIGURE 4. Event detection flowchart.
To determine whether an event has occurred, the calculation is performed using Eqs (1)-(3).
In the equation:
-
-
-
-
4 Two-dimensional image encoding
4.1 Data extraction and preprocessing
Firstly, the current data captured by the smart meter terminal for individual electrical appliances is separated. Then, based on the Fryze power theory, the steady-state current of a single unit of electrical data is split into active and reactive components within one unit cycle (Teshome et al., 2016). As the waveform of the reactive component of the load current varies with different loads and the waveform of the active component is close to a sine wave and similar for different loads, the load label is set based on the reactive component of the load current signal. Finally, the reactive component of the load current signal is normalized, encoded into GAF matrices, and assigned color information to complete the transformation from one-dimensional electrical signals to two-dimensional image signals.
Smart meters on the residential side can capture the electricity usage data of all user appliances, including total power, voltage, current, etc. The fluctuations in total power and total current typically indicate the occurrence of load-switching events. It is assumed that when one appliance is turned on or off, other appliances remain unchanged, maintaining a steady state before this moment. By analyzing the data fluctuations, appliances being turned on or off can be identified. Due to the stable power supply provided by the electrical grid, the voltage signals of various appliances can always remain stable and approximate a sine wave. However, the current signals are affected by different types of load-switching events, leading to distortion in the waveforms, meaning they deviate from a sine waveform. Therefore, load labels can be calibrated based on the distorted state of the current signal waveforms caused by different load-switching events.
Let’s denote the current data for a single load-switching event before and after separation by
After obtaining the current data of the load switching event, to further extract distinguishing characteristics of different appliances, the acquired current data is decomposed into active and reactive components based on the Fryze power theory. The active component is positively correlated with the stable power supply voltage waveform, whereas the reactive component reflects the non-resistive information of the load and has no positive correlation with the power supply voltage waveform. Therefore, the reactive component can be used as the load label for identification. The decomposition process is as follows:
In the equations:
-
-
-
-
-
-
The input for constructing the GAFimages ultimately represents the reactive current component of the electrical load under steady-state operation, and Eqs 4–7 illustrate the decomposition of the reactive current component of the electrical load.
4.2 Transformation of GAF images
GAF encoding was initially applied in the field of computer vision for classifying time series data (Wang, Z., and Oates, T.J.a.e.-p, 2015). Electrical signals are typical examples of time series data. Therefore, GAF encoding can be applied to the reactive current signals of loads, adding color information. This process transforms the data into richer two-dimensional images for classifier recognition and classification. The specific encoding process is as follows:
1)
2) Encode the processed reactive current signal in a polar coordinate system, as shown in Eq. 9:
Therefore, the range of
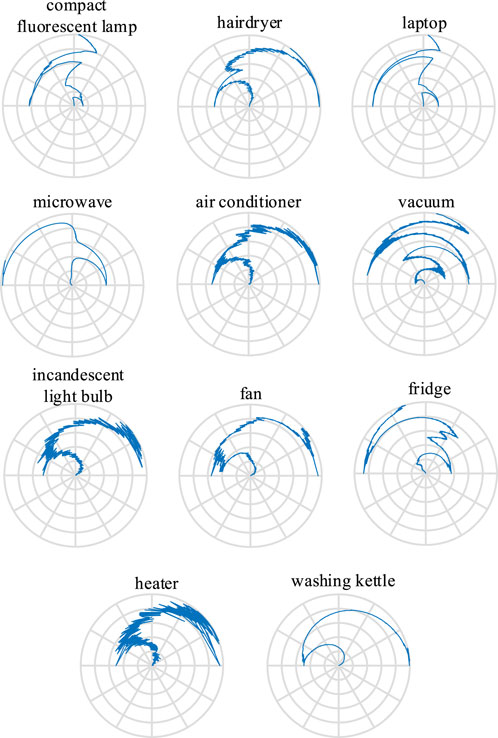
FIGURE 5. Polar coordinate encoding of current and reactive power components.
3) GAF Encoding
After completing the polar coordinate encoding, the one-dimensional time series of reactive power signals are transformed into two-dimensional images using GAF through a Gramian matrix. The GAF matrix is defined as Eq. (10).
Utilizing GAF to transform one-dimensional reactive power signals into two-dimensional images offers two advantages:
1) Rich Image Information: The mapping between one-dimensional reactive power signals and two-dimensional GAF images is ideal. It preserves all the information from the original one-dimensional signal while enriching the feature information among different appliances. This enrichment makes it easier to distinguish between different appliances, enhancing the recognition process.
2) Invariance: The temporal correlation of the one-dimensional reactive power signal is preserved. Regardless of whether the input signals have the same phase, the resulting two-dimensional images corresponding to the same type of appliance exhibit similar texture features. This invariance reduces the impact of signal phase changes on classification results, improving the robustness of the model.
In the subsequent steps, a residual network model will be employed to achieve load recognition and classification, leveraging the enriched and invariant features obtained through GAF encoding.
5 The load recognition model
The input to the load recognition model comprises two-dimensional Gramian Angular Field (GAF) images with rich texture and color information. In order to enable the model to swiftly extract more image features and make accurate identification classifications, classic image recognition networks such as the Convolutional Neural Network (CNN) series and AlexNet are often employed. To meet the aforementioned requirements, these networks often adopt the strategy of increasing the depth of the network layers. However, it is not guaranteed that increasing the depth of the network layers will necessarily improve accuracy; on the contrary, it may lead to a decline in network performance (K. He et al., 2016). This approach evidently has limitations and may not adequately address the varied appliance classifications faced in practical applications within NILM field, where more image features are required.
5.1 The residual attention network
To address the issue of gradient disappearance that occurs as the network depth increases, this study is based on the pre-trained RAN (Wang et al., 2017), which has demonstrated outstanding performance in the field of computer vision. RAN combines multiple attention modules within a residual network framework, comprising two main components: the backbone and the soft mask.
The backbone consists of bottleneck residual blocks, which are the core residual operations. The schematic diagram of the structure is shown in Figure 6:
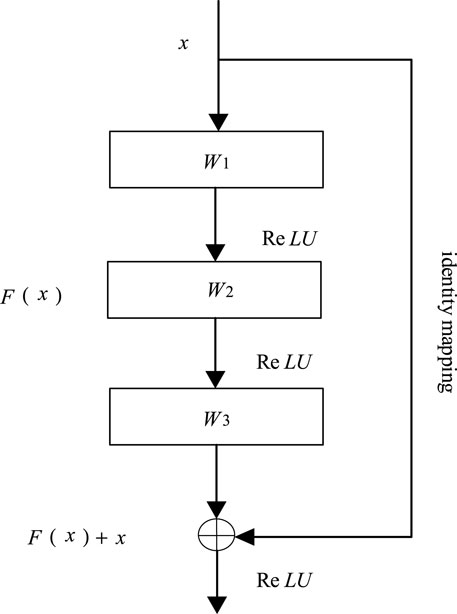
FIGURE 6. Schematic diagram of bottleneck residual block.
In the description provided,
-
-
-
ReLU (Rectified Linear Unit) serves as the activation function. ReLU is a nonlinear activation function that is faster computationally compared to other activation functions like sigmoid and tanh, as it does not involve complex exponential computations.
The identity mapping involves adding the input directly to the output of the final convolutional layer. This process avoids information loss and ensures that the current network layer can always learn the training results from any preceding layer through identity mapping, facilitating effective cross-layer propagation.
The soft mask component is used to generate attention factors, enabling the selective capture of essential features from the input image while ignoring redundant information. Unlike the conventional stacking of attention blocks, this study adopts the concept of residual learning, where the output of the backbone is added to the result combined with attention. Here, the output of the backbone is considered the identity mapping
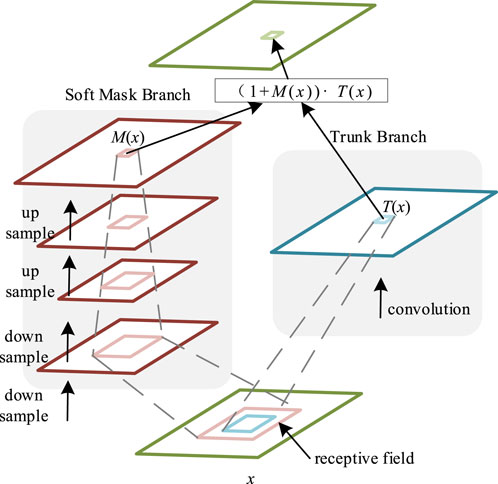
FIGURE 7. The receptive field comparison between mask branch and trunk branch.
The soft mask component consists of fast feedforward scanning and top-down feedback steps. In the soft mask part, an expanded receptive field is utilized to quickly capture more image features while collecting information from the entire image. This process mimics the behavior of the human eye, where one first scans the entire object to gather overall information and then focuses on specific local features. Subsequently, the scanned and collected information is combined with the original image, which contains labeled information.
5.2 Evaluation metrics
The harmonic mean, often used to evaluate the classification accuracy of binary models, is also widely applied in the NILM domain. As shown in Eqs (11)-(13).
In the equation:
-
-
-
-
-
6 Experimental results and analysis
6.1 Experimental conditions
The method proposed in this paper is based on offline system testing. It employs the TensorFlow 2.0 deep learning framework on the Python 3.8 platform. The hardware platform utilized consists of a 2.70 GHz Intel® Core™ i5-10210U CPU with 16 GB RAM.
According to the preprocessing of the collected bus current data, which converts one-dimensional reactive power signals into two-dimensional images as described in Section 4, and the pretraining using the RAN detailed in Section 5.
The processing of input in our study is based on the Fryze power theory, which involves handling the current in PLAID and extracting the non-active component sequences of the current for one steady-state cycle (500 sampling points) after the device starts. This sequence is used to construct a two-dimensional Gramian Angular Field (GAF) plot, which serves as the final input to the RAN network.
In this study, the effectiveness of the proposed algorithm is validated using the publicly available dataset PLAID. This dataset comprises current and voltage data from household appliances, including energy-saving lamps, washing machines, air conditioners, microwave ovens, and other common appliances used in 55 households in Pittsburgh, Pennsylvania, United States. The dataset was collected in 2014, consisting of 1,074 samples with a sampling frequency of 30 kHz. Due to its high sampling frequency, it captures richer information about the original current and voltage changes compared to low-frequency sampling. Hence, this dataset is commonly used in the NILM field to evaluate the effectiveness of non-intrusive load recognition methods. Methods for detecting appliance switching moments and separating them have been extensively discussed in practical applications; therefore, this paper does not delve into these discussions.
6.2 Experimental results of PLAID
According to the Fryze Power Theory described in Section 4, the steady-state current of each household appliance load is decomposed into active and reactive components within one electrical cycle. Subsequently, the reactive power components are normalized, as illustrated in Figure 8.
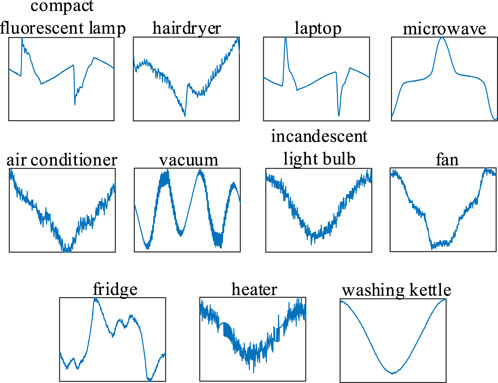
FIGURE 8. Visualization of the reactive component of the current.
From Figure 8, it is evident that there is a certain degree of distinction between loads. However, there are still some appliances that are easily confused. For instance, air conditioners, incandescent lamps, and fans are challenging to differentiate, as are energy-saving lamps and laptops. Therefore, further feature extraction is required. Consequently, the one-dimensional reactive power signals of household appliances are transformed into two-dimensional images. The transformation of the 11 types of household appliances in PLAID into their respective GAF images is illustrated in Figure 9.
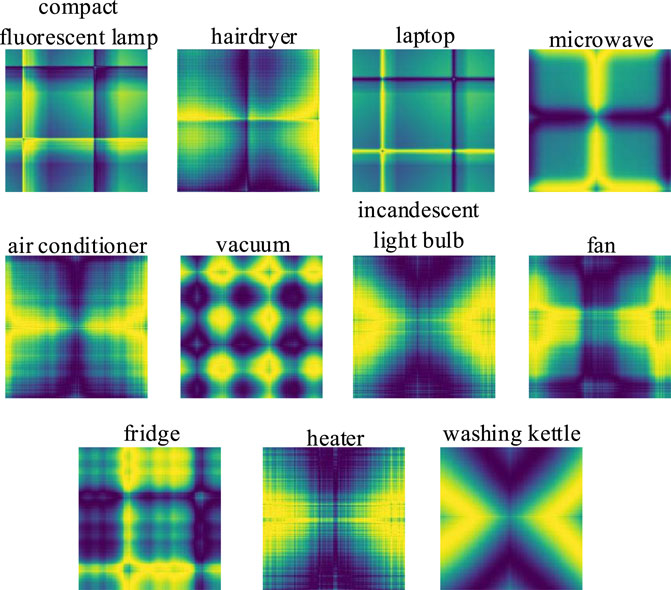
FIGURE 9. GAF diagram of 11 electrical appliances in PLAID.
From Figure 9, it can be observed that the GAF images corresponding to different household appliances exhibit distinct patterns and significant differences. This leads to a considerable improvement in recognizability compared to single-dimensional reactive power signals. Although there is a slight overall similarity in the color layout of GAF images for a few household appliances, such as incandescent lamps and water heaters, they can still be distinguished based on detailed patterns. Moreover, the attention factors included in the soft mask part of the pre-trained RAN contribute to detailed recognition. The experimental results on PLAID are presented through confusion matrices. Figure 10 shows the results based on one-dimensional reactive power signals, while Figure 11 displays the results based on GAF images. In the confusion matrices, the row labels represent the predicted appliance category labels, the column labels represent the actual appliance category labels, and the values on the main diagonal represent the number of appliances correctly recognized. The off-diagonal values correspond to the number of appliances incorrectly classified as other appliance categories.
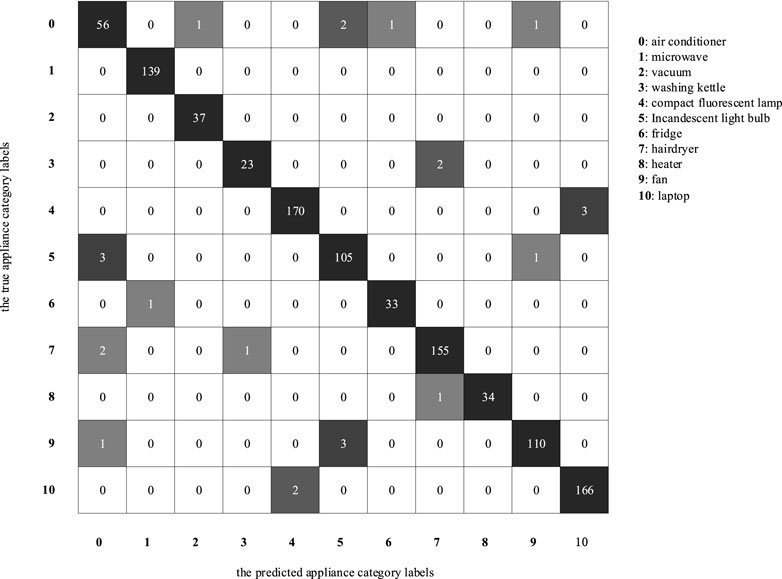
FIGURE 10. Confusion matrix based on one-dimensional reactive electrical signal.
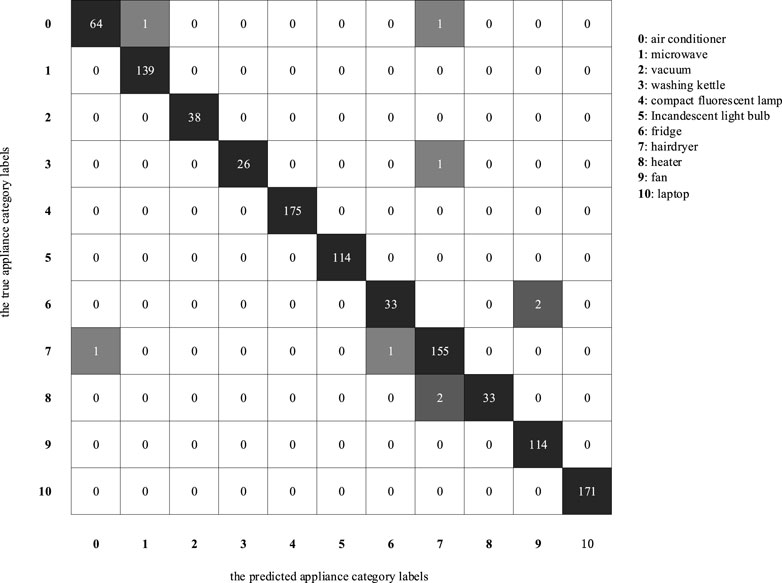
FIGURE 11. Confusion matrix Based on 2D GAF Graph.
Taking the example of air conditioners from Figure 11:
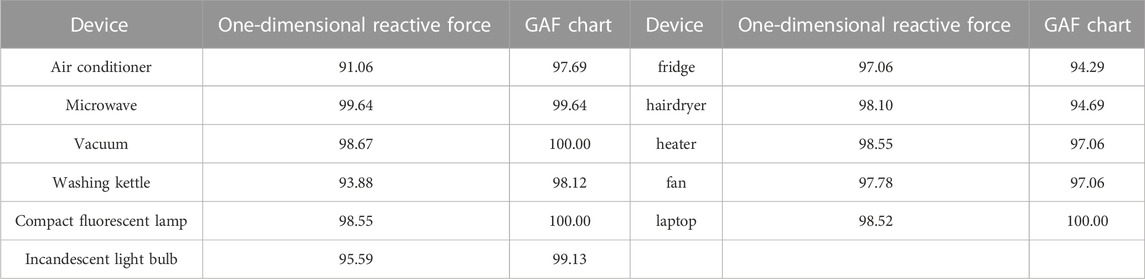
TABLE 1. The Fscore values of 11 electrical appliances based on different feature extraction.
From Table 1, it can be observed that the F-scores for air conditioners, vacuum cleaners, washing machines, energy-saving lamps, incandescent lamps, fans, and laptops have all been improved. Among them, the F-scores for vacuum cleaners, energy-saving lamps, fans, and laptops are 100.00%. This demonstrates that non-intrusive load recognition based on feature extraction from two-dimensional GAF, images outperforms recognition based on a single feature, the reactive power component.
The relatively low F-scores for certain household appliances such as refrigerators, hairdryers, water heaters, and air conditioners, even after integrating the features from two-dimensional GAF images with the one-dimensional reactive power signals, can be attributed to the fact that these four types of household appliances often operate in multiple different states alternately. This variation in load characteristics leads to confusion with other appliances. Consequently, there is a need for further research into classifiers capable of recognizing loads with multiple state transitions. Currently, this area of research is still under development and has not reached maturity.
The smaller the loss value, the better the model’s performance in the task. As observed from Figure 12, the training set curve exhibits a relatively smooth descending trend, and the similarity between the testing set curve trend and the training set descent indicates that the model demonstrates favorable generalization performance. The precision value steadily increases with the number of training iterations, eventually stabilizing. Notably, there is no evidence of overfitting, and the overall performance is deemed satisfactory.
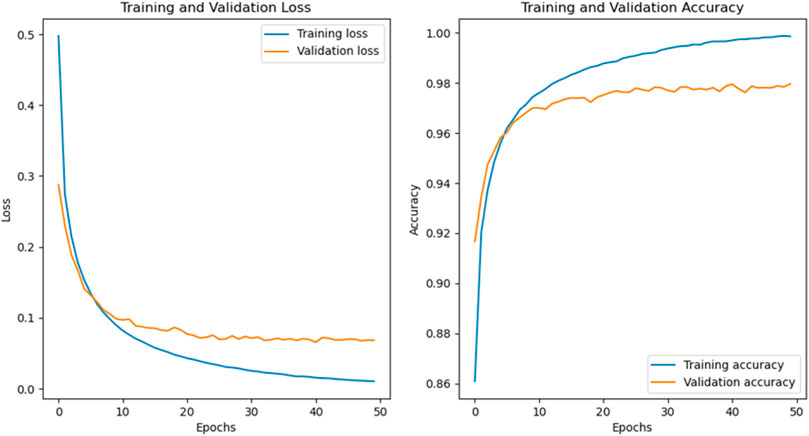
FIGURE 12. The evaluation results of RAN network.
6.3 Comparative analysis of different methods
To compare the performance of different methods in NILM, this study conducted a comparison using the same PLAID dataset, as shown in Table 2:
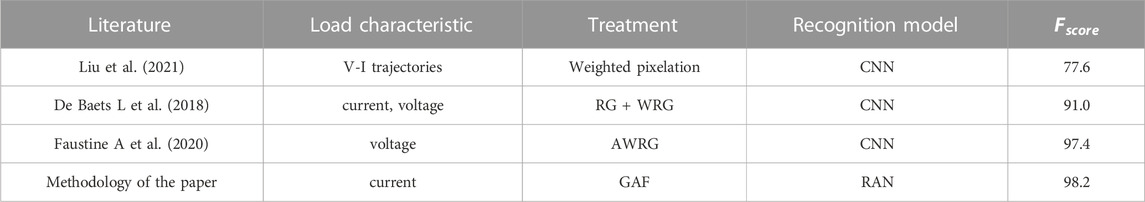
TABLE 2. Comparison of different methods.
In the comparison, Reference (Liu et al., 2021) utilized weighted pixel images of V-I trajectories as input data for Convolutional Neural Networks (CNNs), allowing for the automatic extraction of key load classification features. However, this method achieved a relatively low recognition accuracy. Reference (De Baets L et al., 2018) used one cycle of current and voltage data for each load and applied Recurrence Graph (RG) techniques to generate Weighted Recurrent Graphs (WRG) as input for CNNs. Compared to V-I trajectories, this significantly improved the classification performance. Still, optimizing the relevant hyperparameters for WRG proved to be tedious in practical experiments. Reference (Faustine A et al., 2020) further proposed Adaptive Weighted Recurrence Graph Blocks (AWRG) based on the work of (De Baets L et al., 2018), optimizing hyperparameter selection and enhancing recognition accuracy.
In comparison, the method employed in this paper, utilizing GAF encoding, is simpler and more efficient. It avoids the complexity of hyperparameter selection while ensuring rich load characteristic information for the RAN model to extract. On the same dataset, it achieved higher recognition accuracy compared to the methods (De Baets L et al., 2018; Faustine A et al., 2020).
7 Conclusion
The proposed method addresses the challenges in the field of NILM related to insufficient information in two-dimensional image data, performance degradation in network optimization, and the issue of gradient disappearance. This approach combines GAF encoding and RAN to enhance non-intrusive load recognition. By transforming one-dimensional reactive power signals into two-dimensional images using GAF matrices, the method effectively integrates NILM with computer vision, thereby improving the information content in two-dimensional images. The inclusion of attention factors in the RAN network, coupled with GAF images, enables accurate recognition of household appliance loads. The bottleneck residual blocks effectively mitigate network performance degradation and gradient disappearance issues.
However, the accuracy of the proposed method decreases when identifying loads with multiple state transitions. Future research will focus on studying the electrical quantity variations during the state transitions of such loads, aiming to further enhance the recognition accuracy in these scenarios LIU et al., 2023, Tu et al., 2018.
Data availability statement
The datasets presented in this study can be found in online repositories. The names of the repository/repositories and accession number(s) can be found below: https://figshare.com/articles/dataset/PLAID_2014/11605074.
Author contributions
WJ: Writing–original draft, Writing–review and editing. SY: Data curation, Visualization, Writing–original draft.
Funding
The author(s) declare financial support was received for the research, authorship, and/or publication of this article. The authors declare that this study received funding from Jilin Lingzhan Technology Co., Ltd. The funder was not involved in the study design, collection, analysis, interpretation of data, the writing of this article, or the decision to submit it for publication.
Conflict of interest
The authors declare that the research was conducted in the absence of any commercial or financial relationships that could be construed as a potential conflict of interest.
Publisher’s note
All claims expressed in this article are solely those of the authors and do not necessarily represent those of their affiliated organizations, or those of the publisher, the editors and the reviewers. Any product that may be evaluated in this article, or claim that may be made by its manufacturer, is not guaranteed or endorsed by the publisher.
References
Darby, S. J. (2006). The effectiveness of feedback on energy consumption. A Review for Defra of the Literature on Metering. 486,
De Baets, L., Ruyssinck, J., Develder, C., Dhaene, T., and Deschrijver, D. J. E. (2018). Appliance classification using VI trajectories and convolutional neural networks. Energy Build. 158 (1), 32–36. doi:10.1016/j.enbuild.2017.09.087
Faustine, A., Pereira, L., and Klemenjak, C. J. I. T. (2020). Adaptive weighted recurrence graphs for appliance recognition in non-intrusive load monitoring. IEEE Trans. Smart Grid (99), 1. doi:10.1109/TSG.2020.3010621
Faustine, A., and Pereira, L. J. E. (2020). Improved appliance classification in non-intrusive load monitoring using weighted recurrence graph and convolutional neural networks. Energies 13, 3374. doi:10.3390/en13133374
Figueiredo, M., de Almeida, A., and Ribeiro, B. (2012). Home electrical signal disaggregation for non-intrusive load monitoring (NILM) systems. Neurocomputing 96, 66–73. doi:10.1016/j.neucom.2011.10.037
Gao, J., Giri, S., Kara, E. C., and Acm, M. B. J. (2014). PLAID: a public dataset of high-resoultion electrical appliance measurements for load identification research: demo abstract. ACM. 58, doi:10.1145/2674061.2675032
Gillis, J. M., Alshareef, S. M., and Morsi, W. G. J. I. T. O. S. G. (2015). Non-intrusive load monitoring using wavelet design and machine learning. IEEE Transanctions Smart Grid 7, 320–328. doi:10.1109/TSG.2015.2428706
Guo, H., Lu, J., and Yang, P. (2021). Review on key techniques of non-intrusive load monitoring. Electr. Power Autom. Equip. 41 (1), 135–146. doi:10.16081/j.epae.202011001
He, K., Zhang, X., Ren, S., and Sun, J. (2016). Deep residual learning for image recognition, Proceedings of the IEEE conference on computer vision and pattern recognition (CVPR). Las Vegas, NV, USA, June 2016, doi:10.1109/CVPR.2016.90
Kelly, J., and Knottenbelt, W. J. (2015). Neural NILM: deep neural networks applied to energy disaggregation. Intell. Distrib. Comput. 8. doi:10.1145/2821650.2821672
Lianwei, Z., and Wen, X. (2021). Urban household energy consumption forecasting based on energy price impact mechanism. Front. Energy Res. 9. doi:10.3389/fenrg.2021.802697
Linna, H., Yi, B., and Juning, S. (2023). Process simulation on the planning of wind-PV storage for near-zero carbon emission. Front. Energy Res. 11. doi:10.3389/fenrg.2023.1217279
Liu, Z., Hou, K., Gao, J., and Wang, Z., (2021). Non-intrusive residential electricity load disaggregation based on temporal convolutional neural network. Electr. Power Constr. 42 (3), 97–106. doi:10.12204/j.issn.1000-7229.2021.03.012
Liu, K., Li, B., and Liang, Q. I. N. (2023). Review on the application of deep learning object detection algorithms in insulator defect detection of overhead transmission lines. High. Volt. Eng. 49 (9), 3584–3595. doi:10.13336/j.1003-6520.hve.20220273
Teng, J., and Li, H. (2023). Analysis on development and key technologies of integrated intelligent energy in the context of carbon neutrality. Integr. Intell. Energy 45 (8), 53–63. doi:10.3969/j.issn.2097-0706.2023.08.007
Teshome, D. F., Huang, T. D., Lian, K. L. J. I. P., and Journal, E. T. S. (2016). Distinctive load feature extraction based on fryze's time-domain power theory. IEEE Power & Energy Technol. Syst. J. 3 (2), 60–70. doi:10.1109/JPETS.2016.2559507
Tu, J., Zhou, M., and Song, X. (2018). Comparison of non-intrusive load monitoring algorithms based on supervised learning. Electr. Power Autom. Equip. 38 (12), 128–134. doi:10.16081/j.issn.1006-6047.2018.12.019
Wang, F., Jiang, M., Qian, C., Yang, S., Li, C., and Zhang, H., (2017). Residual attention network for image classification. Proceedings of the IEEE conference on computer vision and pattern recognition, San Juan, PR, USA, June 2017, doi:10.1109/CVPR.2017.683
Wang, J., Hou, G., and Zhang, H. (2021). Non-intrusive household load rapid identification method based on steady-state current waveform matching. Jilin Electr. Power 49 (1), 1–5. doi:10.16109/j.cnki.jldl.2021.01.001
Wang, Z., and Oates, T. J. (2015). Imaging time-series to improve classification and imputation. https://arxiv.org/abs/1506.00327. doi:10.48550/arXiv.1506.00327
Xing, N., and Xu, F. (2017). Study on urban residents' electricity behavior and electricity consumption elasticity. CHINA Popul. Resour. Environ. 27 (1), 207–210.
Keywords: non-intrusive load identification, gram code, one-dimensional reactive electric signal, residual attention net, bottleneck residual blocks
Citation: Jianyuan W and Yibo S (2023) Non-intrusive load identification method based on GAF and RAN networks. Front. Energy Res. 11:1330690. doi: 10.3389/fenrg.2023.1330690
Received: 31 October 2023; Accepted: 04 December 2023;
Published: 29 December 2023.
Edited by:
Deepak Kumar, Birla Institute of Technology, IndiaReviewed by:
Masoud Dashtdar, Islamic Azad University, Bushehr, IranZiming Yan, Nanyang Technological University, Singapore
Copyright © 2023 Jianyuan and Yibo. This is an open-access article distributed under the terms of the Creative Commons Attribution License (CC BY). The use, distribution or reproduction in other forums is permitted, provided the original author(s) and the copyright owner(s) are credited and that the original publication in this journal is cited, in accordance with accepted academic practice. No use, distribution or reproduction is permitted which does not comply with these terms.
*Correspondence: Wang Jianyuan, d2FuZ2p5QG5lZXB1LmVkdS5jbg==