- 1School of Transportation Engineering, Chang’an University, Xi’an, Shaanxi, China
- 2Key Laboratory of Highway Engineering in Special Region of Ministry of Education, Chang’an University, Xi’an, Shaanxi, China
- 3Jiaoke Transport Consultants Ltd., Beijing, China
With the deepening of the concept of green, low-carbon, and sustainable development, the continuous growth of the ownership of new energy vehicles has led to increasing public concerns about the traffic safety issues of these vehicles. In order to conduct research on the traffic safety of new energy vehicles, three sampling methods, namely, Synthetic Minority Over-sampling Technique (SMOTE), Edited Nearest Neighbours (ENN), and SMOTE-ENN hybrid sampling, were employed, along with cost-sensitive learning, to address the problem of imbalanced data in the UK road traffic accident dataset. Three algorithms, eXtreme Gradient Boosting (XGBoost), Light Gradient Boosting Machine (LightGBM), and Categorical Boosting (CatBoost), were selected for modeling work. Lastly, the evaluation criteria used for model selection were primarily based on G-mean, with AUC and accuracy as secondary measures. The TreeSHAP method was applied to explain the interaction mechanism between accident severity and its influencing factors in the constructed models. The results showed that LightGBM had a more stable overall performance and higher computational efficiency. XGBoost demonstrated a balanced combination of computational efficiency and model performance. CatBoost, however, was more time-consuming and showed less stability with different datasets. Studies have found that people using fewer protective means of transportation (bicycles, motorcycles) and vulnerable groups such as pedestrians are susceptible to serious injury and death.
1 Introduction
As society continues to develop, people strive to implement the concept of sustainable development and high-level protection of the ecological environment in all aspects. There is a strong push for energy conservation and environmental protection, and a transformation of the economic development model of traditional industries. Therefore, the use of new energy vehicles in daily travel has become a necessary condition for promoting social and environmental development. With the increase in the number of new energy vehicles, there has also been a corresponding rise in the number of accidents involving these vehicles, making the safety of new energy vehicles a focus of concern for scholars. However, currently, there is limited research on the road traffic safety of new energy vehicles, and the existing studies have certain limitations. There are significant discrepancies among the research findings, making it difficult to reach consistent conclusions.
New energy vehicles primarily use electric motors for power output in most scenarios, resulting in lower vehicle noise compared to internal combustion engine vehicles. This difference in sound may pose a safety threat to drivers or other road users. Wogalter et al. investigated public attitudes and concerns regarding hybrid vehicles, and found that the majority of participants considered the “quietness” of hybrid vehicles to be a safety threat for pedestrians (Wogalter et al., 2014). Goodes et al. conducted perception studies related to electric vehicles specifically targeting visually impaired individuals (Goodes et al., 2009). The research showed that the sound conditions of vehicles significantly affected the perception abilities of visually impaired individuals. It also confirmed that the use of additional sound devices can help visually impaired individuals detect electric vehicles earlier. Similarly, studies conducted by Garay-Vega, Parizet, and Fleury obtained similar conclusions (Garay-Vega et al., 2010; Wall Emerson et al., 2011; Parizet et al., 2014; Fleury et al., 2016). Chen et al. proposed an improved, contextually-coordinated approach to enhance traffic safety measures by utilizing drivers’ inherent visual perceptual characteristics, further improving the overall safety of the roadway environment (Chen Yunteng et al., 2023). Cocron et al. conducted a study on the issue of low noise in electric vehicles from the driver’s perspective (Cocron and Krems, 2013). The research indicated that severe incidents related to low noise electric vehicles were rare and mostly occurred during low-speed driving. As driving experience increases, drivers perceive the low noise characteristics of electric vehicles as a more comfortable driving experience and do not consider it to pose a higher safety threat to other road users.
On the other hand, the analysis of factors influencing the severity of traffic accidents has also received significant attention. Chen et al. used a ridge regression model to study the effect of economic development indicators on road traffic accident fatality rates in China and five European and American countries, and found that the results were completely different due to differences in economic development (Chen Xiyang et al., 2023). AlKheder et al. compared three data mining models used for accident severity analysis and found that Bayesian networks had more accurate predictive performance (AlKheder et al., 2020). Wang Lei et al. used random forest, Bayesian, BP neural network, and support vector machine to analyze the road environmental factors affecting the prediction of highway tunnel traffic accidents. The results showed that random forest had better reliability (Wang et al., 2019). Similarly, Lee et al. found that the random forest model performed the best in the analysis of traffic accident models (Lee et al., 2020). Xu proposed a one-way traffic organization scheme demonstration and evaluation method using VISSIM, which has certain practical significance (Xu, 2022). Bokaba, T et al. analyzed machine learning algorithms like AdaBoost, logistic regression, naive Bayes, and random forest in analyzing the severity of traffic accidents (Bokaba et al., 2022). They also employed the SMOTE algorithm to address data imbalance issues and obtained similar results, with random forest having higher prediction accuracy and better performance. Zhou et al. combined methods such as SMOTE-ENN and cost-sensitive learning to address data imbalance issues and used the SHAP method for model interpretation (Zhou et al., 2018). The research found that cost-sensitive learning yielded the best results in handling data imbalance problems. Islam et al. proposed a new data augmentation technique called variational autoencoder (VAE) to address class imbalance issues in traffic accident data (Islam et al., 2021). They compared it with other methods such as SMOTE and adaptive synthetic sampling (ADASYN) and found that VAE showed improved specificity and sensitivity to varying degrees while better overcoming overfitting issues. Su et al. quantitatively analyzed the severity of traffic accidents under different types and proposed a new evaluation index, which is of some reference and significance (Su and Niu, 2022).
Based on the extensive research conducted by different scholars on the factors influencing the severity of accidents involving new energy vehicles, this study aims to utilize a larger dataset of UK traffic accidents involving new energy vehicles and their associated factors. With the use of ensemble learning algorithms and data balancing techniques, the study will explore the influencing factors of accident severity. Additionally, the study will use explanations methods based on machine learning to reveal the underlying mechanisms between accident severity and its influencing factors.
2 Methodology
2.1 Ensemble learning
Ensemble learning refers to the algorithm that combines multiple learners to accomplish a learning task. It typically involves generating multiple individual learners and then combining them using certain strategies. Based on different approaches in forming individual learners, ensemble learning methods are mainly divided into Boosting and Bagging. Boosting is a type of method that can boost weak learners into strong learners, focusing on reducing bias, which represents the deviation between the expected predictions of the learning algorithm and the true results. Some commonly used Boosting algorithms include AdaBoost (Adaptive Boosting) (Freund and Schapire, 1996), GBDT (Gradient Boosting Decision Tree) (Friedman, 2001), XGBoost (Extreme Gradient Boosting) (Chen et al., 2020), LightGBM (Light Gradient Boosting Machine) (Bentéjac et al., 2021), and CatBoost (Gradient Boosting + Categorical Features) (Dorogush et al., 2018). In this study, we select XGBoost, LightGBM, and CatBoost, which are based on the GBDT algorithm framework, as the modeling algorithms. Overall, the use of numerical simulation for road and traffic accident research is a hot topic today (Prokhorenkova et al., 2018).
2.1.1 XGBoost
XGBoost is a machine learning algorithm that can perform stably and effectively in different scenarios (Chen et al., 2020). Regularized boosting is one of its core techniques, and the regularization objective function used is represented as follows:
where
where
Next, we need to calculate the optimal solution of the objective function. The following equation represents the error function for the i-th sample at the t-th iteration:
By performing a second-order Taylor expansion and simplification of the objective function, we obtain:
where,
Next, given a fixed tree structure, in order to minimize the objective function, we set the derivative of Equation 4 to zero. This yields the optimal predicted score for each leaf:
where
Substituting Equation 5 into the objective function, we can solve for the optimal solution:
After determining the loss function and the optimal solution, the next step is to determine the tree structure, specifically how to select the optimal splitting node. The basic idea of the splitting criterion in XGBoost is consistent with decision trees: using a greedy algorithm to enumerate all nodes, calculate the information gain before and after each node split, and select the node with the maximum information gain. Let
2.1.2 LightGBM
LightGBM borrows some of the histogram algorithms used in GBDT (Bentéjac et al., 2021). This algorithm finds the best split point based on feature histograms. The computational complexity is mainly influenced by the cost of constructing histograms, which is O (sample size × feature size). Therefore, the key to reducing computational complexity is to reduce the number of samples and features. As a result, LightGBM proposes two new techniques to reduce the number of features and samples, thus improving the computational efficiency of the algorithm. These techniques are Gradient-based One-Side Sampling (GOSS) and Exclusive Feature Bundling (EFB).
The GOSS algorithm focuses on reducing the number of samples by using the calculated information gain as the judging criterion. It discards samples with small gradients that have little impact on the information gain and retains samples with larger gradients that have a greater impact on the information gain. Let O be the training dataset at a fixed node in the decision tree, and let
where,
GOSS first sorts the absolute values of the gradients of the training samples. It then selects the top “a” sample with the largest gradients as subset A. Next, it randomly samples “b” samples from the remaining samples with smaller gradients
where,
High-dimensional data is often sparse, and in a sparse feature space, many features are mutually exclusive. One possible approach to reduce the number of features is to bind mutually exclusive features together, and the EFB algorithm is based on this idea. The problem of binding mutually exclusive features can be divided into two parts: binding rules and binding methods. EFB introduces the greedy bundling rule, which transforms the problem of feature binding into a graph coloring problem to solve. The graph coloring problem belongs to the NP-hard problem class. Once the feature binding rules are determined, the binding method needs to be defined. EFB proposes the Merge Exclusive Features method to address this issue.
Based on the above methods, the LightGBM algorithm significantly reduces the computational complexity of the training task while ensuring model performance. This leads to faster computation speed and reduced memory usage. The advantages of LightGBM are even more significant in large-scale data tasks.
2.1.3 CatBoost
CatBoost is a gradient boosting decision tree (GBDT) framework algorithm that uses oblivious decision trees as base learners (Dorogush et al., 2018). It aims to address gradient bias and prediction shift issues and directly handles categorical features. In order to tackle gradient bias, CatBoost optimizes the GBDT algorithm by using unbiased estimates of the gradient step to compute leaf values at the first step.
Machine learning tasks involve a wide variety of feature types, such as categorical features, continuous features, and so on. Categorical features refer to a set of discrete category data with no inherent ordering, such as categories for accident vehicles, colors, animals, etc. Most machine learning algorithms cannot directly process data with categorical features as training data. They first require encoding the categorical data into numerical form. Common encoding methods include ordinal encoding and one-hot encoding. One-hot encoding creates a binary feature for each category within a feature. It adds a new binary feature to the data, representing whether or not it belongs to that category. When the cardinality of the categorical feature is low, such as for gender, one-hot encoding expands the feature space and avoids the issue of meaningless order in category values. However, when the cardinality of the categorical feature is high, using one-hot encoding can result in too many new features, greatly increasing data dimensionality and computational complexity. Considering the similarity between different categories within a categorical feature, it is possible to reclassify the feature by clustering, reducing the number of categories. After that, one-hot encoding can be applied. Target statistics (TS) is one such method. In the simple TS method, the mean value of each category within the categorical feature is used as the basis for reclassification. This method is known as greedy TS. In this method, the classification of the k-th training sample for categorical feature i.
whereas a is a constant greater than 0, p is the average target value of the dataset, and
The drawback of this method is that the constant
The meaning of the parameters in the formula is the same as above.
After addressing the conditional shift caused by target leakage, another issue that needs to be dealt with is prediction shift. CatBoost proposes an approach called ordered boosting, similar to the ordered TS method, to overcome this problem. The key feature of symmetric decision trees is that they use the same splitting criteria throughout the entire tree. This ensures that the tree’s leaves are more balanced, less prone to overfitting, and significantly speeds up computation during testing. It not only efficiently handles categorical features but also forms new features by combining different features for analysis, maximizing the utilization of data information and improving model performance.
2.2 Class imbalance handling
When using machine learning algorithms for classification tasks, it is generally assumed that the distribution of data classes is balanced. However, when training models using real-world traffic accident data, it is common to encounter a phenomenon where the model achieves high prediction accuracy but poor overall performance. For instance, in traffic accident data, the proportion of fatal accidents is usually lower compared to non-fatal accidents. During the training process, the algorithm may tend to predict all accidents as non-fatal to improve overall prediction accuracy. However, this can result in the model performing poorly in predicting the minority class, which in this case is the fatal accidents. This issue is known as class imbalance (Johnson and Khoshgoftaar, 2019). On the other hand, there are scenarios where the importance of the minority class samples far outweighs that of the majority class samples. For example, accurately predicting a fatal accident holds significantly higher practical value and social impact compared to the other class. Effectively addressing imbalanced data is one of the key challenges in machine learning. Currently, there are two main methods for handling data imbalance that are relatively mature: data resampling and cost-sensitive learning (Ofek et al., 2017). Data resampling methods primarily include oversampling, undersampling, ensemble sampling, and a combination of oversampling and undersampling. This article will mainly introduce oversampling, undersampling, combination sampling, and cost-sensitive learning.
2.2.1 Oversampling
The basic idea of oversampling is to increase the number of minority class samples based on the existing minority class samples. This can be achieved through random sampling or artificial synthesis, aiming to balance the data distribution between minority and majority class samples. The most typical oversampling method is synthetic minority oversampling technique (SMOTE) (Chawla et al., 2002).
The SMOTE algorithm is an improvement over the random oversampling algorithm. The former approach, which uses a strategy of randomly duplicating samples to increase the minority class samples, can lead to overfitting and poor generalization of the model. SMOTE addresses this issue by automatically synthesizing new samples based on the minority class samples. The algorithm follows these steps: using the Euclidean distance as the criterion, calculate the distance between each minority class sample
2.2.2 Undersampling
Unlike oversampling, undersampling focuses on reducing the number of majority class samples through random discarding or specific rules to achieve data balance. Depending on the rules used for discarding, undersampling methods can be divided into random majority under-sampling with replacement, Edited Nearest Neighbours (ENN) (Wilson, 1972), Extraction of majority-minority Tomek links (Tomek links) (Tomek, 1976), and other techniques.
ENN is a data cleaning technology that aims to achieve undersampling by removing data with overlapping relationships based on certain rules. For any sample in the dataset, if more than half of its k nearest neighbors have a different class, this sample will be selectively removed.
2.2.3 Combination sampling
Although the above two methods partially address the problem of data imbalance, they also have limitations. For example, the SMOTE algorithm can cause the boundaries between classes to become blurry, and the ENN algorithm has limited ability to clean up majority class samples and cannot control the quantity discarded. One such method is SMOTE-ENN, which combines the SMOTE and ENN sampling techniques. It first uses the SMOTE algorithm to oversample the minority class samples and then cleans the data using the ENN algorithm. The advantage of this approach is that it addresses the issue of blurry boundaries caused by the SMOTE algorithm through the data cleaning process of the ENN algorithm. Additionally, since SMOTE increases the number of data samples, the ENN algorithm can clean up more samples.
2.2.4 Cost-sensitive learning
Cost-sensitive learning (CSL) is a machine learning approach that considers the costs or losses associated with different classification errors during model training and prediction (Johnson and Khoshgoftaar, 2019). In cost-sensitive learning, each class’s classification error is assigned a different cost value. These costs can be pre-determined or adjusted based on specific problem domains and requirements. This article focuses on implementing cost-sensitive learning by increasing the weights of misclassified classes. Compared to resampling methods, cost-sensitive learning is computationally efficient and maintains good model performance. It offers more significant advantages in large data scenarios.
In this paper, cost-sensitive learning is implemented using the third-party library scikit-learn in Python (Fabian et al., 2011). It achieves cost-sensitive learning by altering the weights of each class, and the weight calculation method for each class is as follows:
where,
2.3 SHAP principle
SHAP (Shapley Additive Explanation) is a game theory method based on the classical Shapley value and its related extensions (Shapley, 1953). It establishes a connection between optimal credit allocation and local explanations, and can be used to explain the outputs of various machine learning models. Typically, simple models with fewer parameters have good global interpretability, meaning they can recognize the interaction relationships between independent variables and the target variable on the complete dataset. On the other hand, complex models (such as ensemble models) have less transparent modeling processes and are difficult to interpret globally. Therefore, local methods are often used to bypass the complexity of the model itself and analyze the predictive behavior of individual samples or groups of samples in order to obtain the mechanisms of interaction between independent variables and the target variable, which is also known as the local interpretability of the model. SHAP is based on the second type of explanation strategy, which uses a relatively simple but interpretable model as an explanation model for complex models. This is also a model-agnostic explanation method. However, due to the large number of feature subsets, obtaining the model outputs for each feature subset requires a huge computational cost and is time-consuming. Therefore, Lundberg subsequently proposed TreeSHAP to improve the computation speed of tree-based ensemble models (Lundberg et al., 2020). TreeSHAP optimizes the computation method of Shapley values by calculating them based on the nodes of the tree model, rather than generating subsets through sampling all features. Additionally, TreeSHAP enhances analysis of the dependencies between variables, allowing for the identification of feature interaction relationships within the model. The XGBoost, LightGBM, and CatBoost models used in this study are all tree-based ensemble models, so TreeSHAP is used for visualizing explanations of the established accident severity model.
3 Accident severity modeling based on ensemble learning
3.1 Data preprocessing
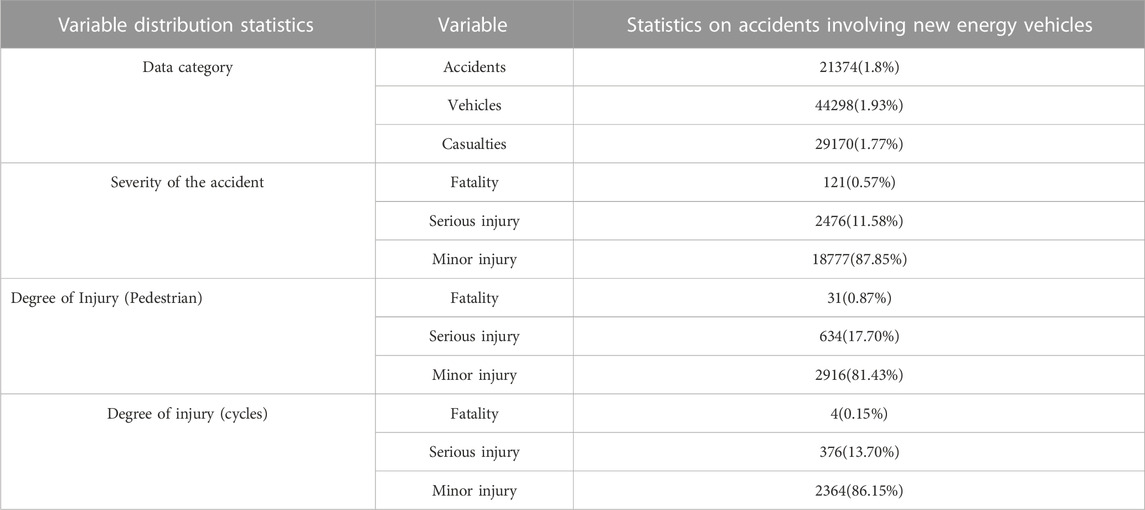
Considering the background of the development of new energy vehicles, this study selected road safety data from 2009 to 2019 in the United Kingdom. After a simple screening and exclusion of some variables, the statistical results are shown in Table 1.
Due to the large amount of accident data involving new energy vehicles in the dataset used in this study, as well as the large number of accident groups, the computation efficiency is low when using resampling methods to address data imbalance issues. If the model tuning process is added, the computational power is severely insufficient. Moreover, ensemble algorithms typically construct models with performance close to the optimal model under default parameters, and the performance improvement brought by tuning is limited. On the other hand, different data imbalance handling methods can bring greater performance improvement to the model. Therefore, in the stage of selecting data balancing methods, no tuning is performed. Instead, tuning is carried out after obtaining the best data balancing method. In this study, Bayesian search, which is faster and performs better, is selected as the main tuning method. The model selection is based primarily on G-mean, with AUC and accuracy as secondary evaluation criteria, as shown in Eqs 14–18.
The meanings of TN, TP, FP, and FN are shown in Table 2.
where i represents the i-th sample in the positive examples,
3.2 Analysis of accident modeling involving new energy vehicles
3.2.1 Comprehensive accident modeling and analysis for new energy vehicles
3.2.1.1 Road and environmental factors
Results of performance evaluation for the comprehensive accident modeling of new energy vehicles, considering road and environmental factors, are shown in Table 3. Before parameter tuning, the maximum G-mean value was 59.01%, the maximum AUC value was 60.23%, and the highest accuracy for classifying severe injury accidents was 48.15%. Compared to the 2.14% without addressing data imbalance, it represents an increase of 46.01%. These maximum values were obtained using the LightGBM model with cost-sensitive learning for data balancing. Furthermore, through comparative analysis of models using the same modeling algorithm but different data balancing methods, it was found that the model with cost-sensitive learning performed better in classifying minority class samples (severe injury accidents), and this gap is difficult to compensate for through parameter tuning. However, the differences between different modeling algorithms were relatively small and could be easily leveled off through hyperparameter optimization. Therefore, considering efficiency and performance comprehensively, this paper only conducted parameter tuning for models using cost-sensitive learning, and then selected the best-performing model. The tuning results show that the performance of all models has slightly improved. Among them, the model constructed by LightGBM and CSL performed the best. After tuning, the G-mean increased by 2.32%, the AUC value increased by 1.15%, and the accuracy of severe injury accidents classification improved by 10.68%. Therefore, this model is the optimal model in this round.
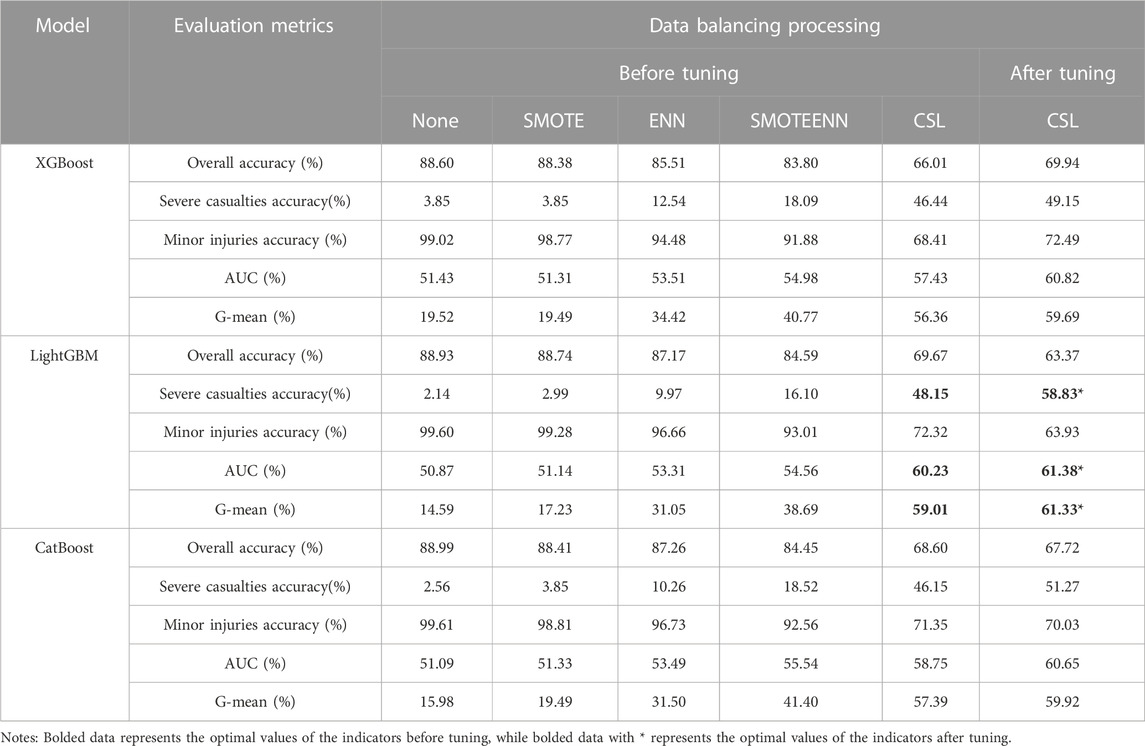
TABLE 3. Performance measurement table of comprehensive accident road and environmental factor classification model for new energy vehicles.
3.2.1.2 Vehicle factors
In the performance evaluation results of the comprehensive accident modeling for the entire fleet of new energy vehicles, considering vehicle factors (as shown in Table 4), the maximum G-mean value was 61.04%, the maximum AUC value was 61.09%, and the highest accuracy for classifying severe injury accidents was 58.61%. These maximum values were obtained using the LightGBM model with cost-sensitive learning for data balancing. The tuning results indicate that the model constructed by CatBoost and CSL is the optimal model. After tuning, the G-mean increased to 61.65%, the AUC value increased to 61.65%, and the accuracy of severe injury accidents classification improved to 61.80%.
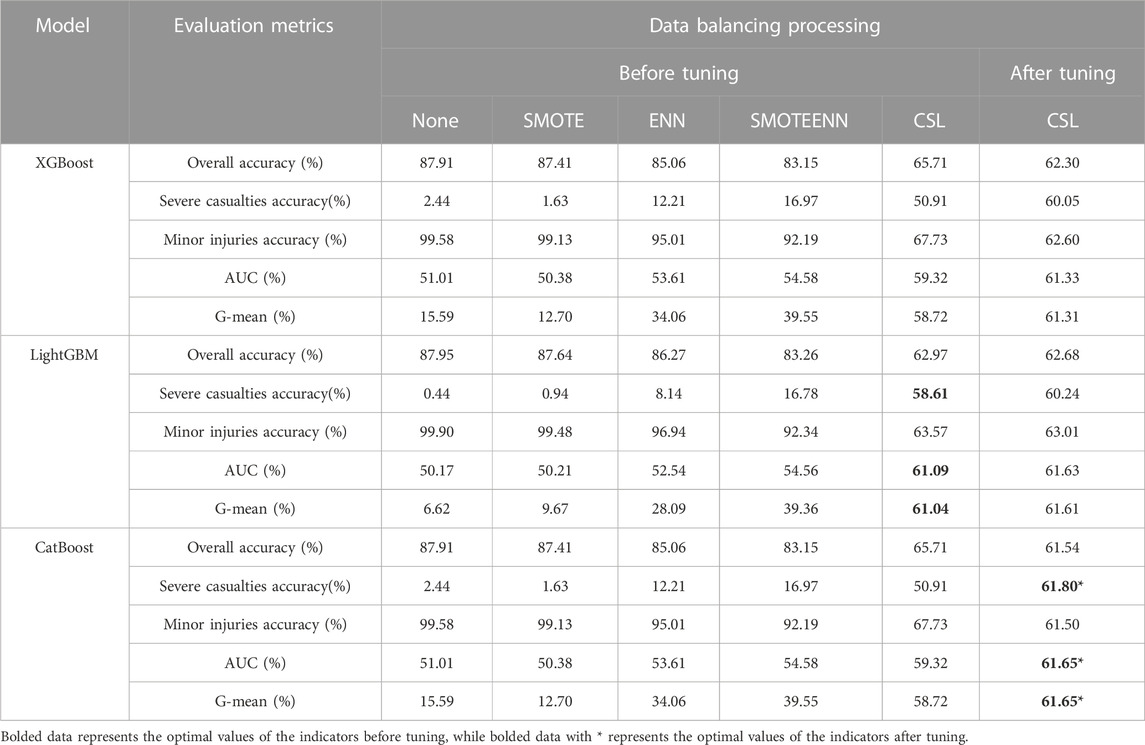
TABLE 4. Performance measurement table of comprehensive accident vehicle factor classification model for new energy vehicles.
3.2.1.3 Casualty factors
In the performance evaluation results of the comprehensive accident modeling for casualty factors of the entire fleet of new energy vehicles (as shown in Table 5), the maximum G-mean value was 62.48%, the maximum AUC value was 62.91%, and the highest accuracy for classifying severe injury accidents was 55.57%. These maximum values were obtained using the LightGBM model with cost-sensitive learning for data balancing. However, the optimal model after tuning has changed to a model based on the CatBoost algorithm, with a G-mean increasing to 64.63%, an AUC value increasing to 64.68%, and an improved accuracy of severe injury accidents classification to 62.20%.
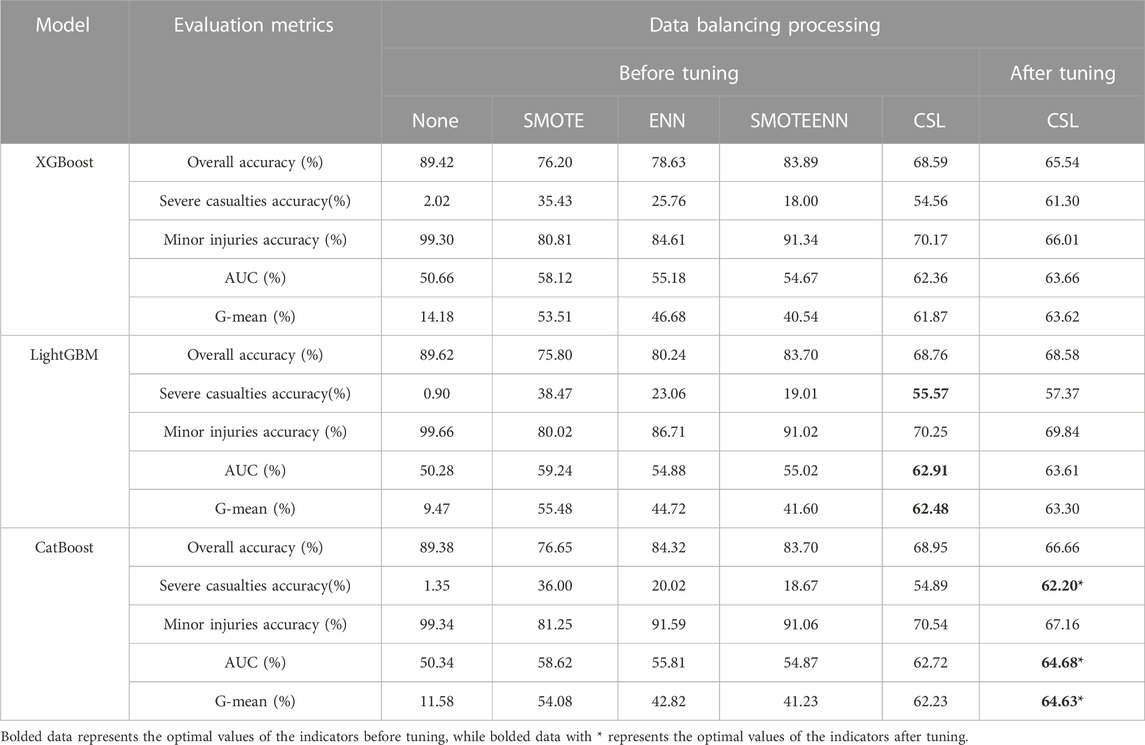
TABLE 5. Performance measurement table of comprehensive accident casualty factor classification model for new energy vehicles.
3.2.2 Analysis of accidents between new energy vehicles and pedestrians
3.2.2.1 Road and environmental factors
In the performance evaluation results of the road and environmental factors modeling for accidents between new energy vehicles and pedestrians (as shown in Table 6), the maximum G-mean value was 52.63%, the maximum AUC value was 54.39%, and the highest accuracy for classifying severe injury accidents was 40.64%. These maximum values were obtained using the LightGBM model with cost-sensitive learning for data balancing. The tuning results showed that the model built by LightGBM and CSL performed the best, serving as the optimal model in this round. After tuning, the G-mean increased by 7.24%, the AUC value increased by 5.87%, and the accuracy for classifying severe injury accidents improved by 12.84%.
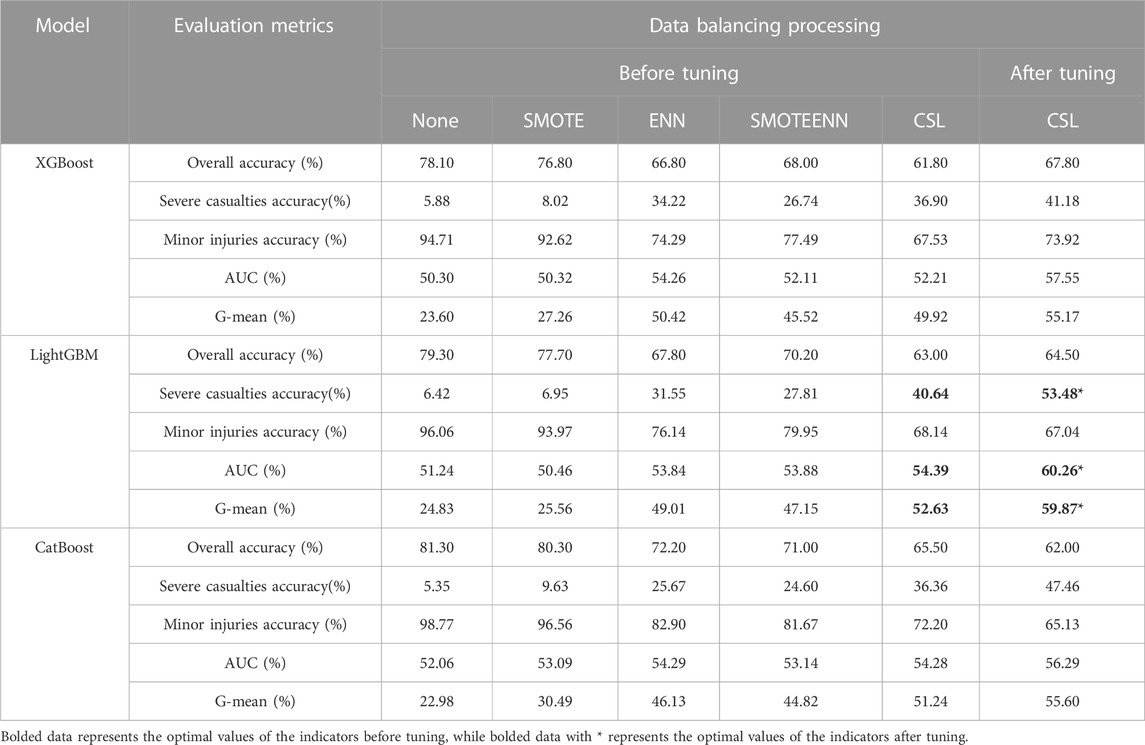
TABLE 6. Performance measurement table of comprehensive accident road and environmental factor classification model for new energy vehicles-pedestrian accidents.
3.2.2.2 Vehicle factors
In the performance evaluation results of the vehicle factors modeling for accidents between new energy vehicles and pedestrians (as shown in Table 7), the maximum G-mean value was 55.73%, the maximum AUC value was 57.33%, and the highest accuracy for classifying severe injury accidents was 43.86%. These maximum values were obtained using the XGBoost model with cost-sensitive learning for data balancing. After tuning, the model that combined cost-sensitive learning and the CatBoost algorithm demonstrated the best overall performance. Its G-mean increased to 56.56%, the AUC value of 56.66% was close to the maximum value (57.04%), and the accuracy for classifying severe injury accidents increased by 53.21%, showing a remarkable improvement of 14%. Therefore, this model was selected as the optimal model for this round.
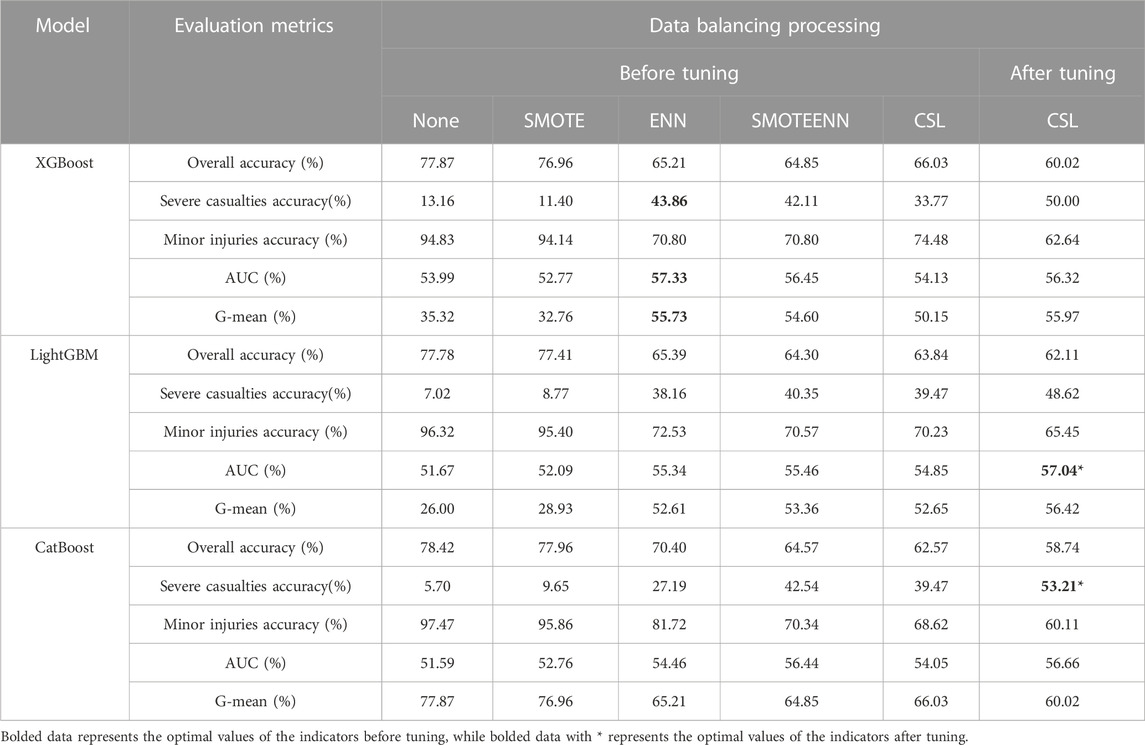
TABLE 7. Performance measurement table of comprehensive accident vehicle factor classification model for new energy vehicles-pedestrian accidents.
3.2.2.3 Casualty factors
In the performance evaluation results of the injury factors modeling for accidents between new energy vehicles and pedestrians (as shown in Table 8), the maximum G-mean value was 54.62%, the maximum AUC value was 58.50%, and the highest accuracy for classifying severe injury accidents was 42.86%. These maximum values were obtained using the LightGBM model with cost-sensitive learning and undersampling for data balancing. After tuning, the maximum values for G-mean, AUC, and accuracy for classifying severe injury accidents were 56.91%, 57.78%, and 47.78%, respectively. These values were achieved by combining cost-sensitive learning with the XGBoost model. Therefore, this model was selected as the optimal model for this stage.
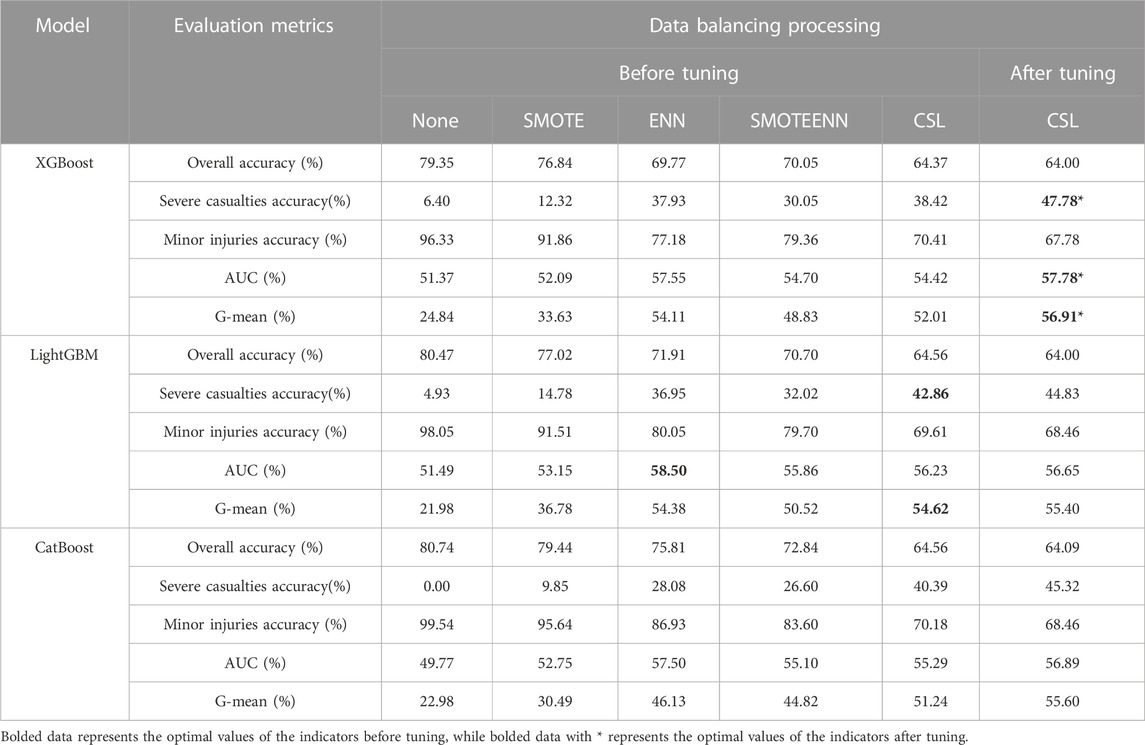
TABLE 8. Performance measurement table of comprehensive accident casualty factor classification model for new energy vehicles-pedestrian accidents.
3.2.3 Analysis of modeling accidents between new energy vehicles and bicycles
3.2.3.1 Road and environmental factors
As shown in Table 9, the performance evaluation results of the road and environmental factors model for accidents between new energy vehicles and bicycles, the maximum G-mean value is 49.61%, the maximum AUC value is 57.26%, and the highest accuracy rate for classifying severe and fatal accidents is 30.56%. These maximum values are obtained from the LightGBM model and the CatBoost model, both of which use a hybrid sampling method and cost-sensitive learning for data balancing. After parameter tuning, the optimal model that combines cost-sensitive learning and the XGBoost algorithm achieves a G-mean of 59.72%, an increased AUC value of 59.87%, and an improved accuracy rate of 55.56% for classifying severe and fatal accidents, with an increase of approximately 94%.
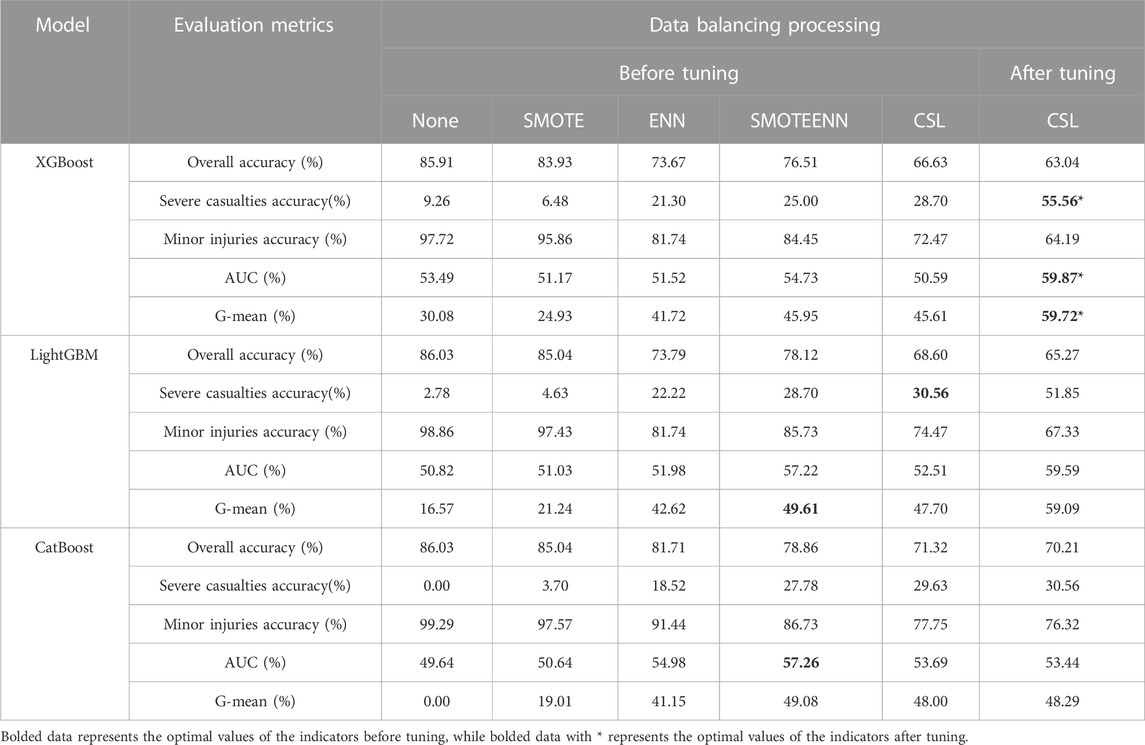
TABLE 9. Performance measurement table of comprehensive accident road and environmental factor classification model for new energy vehicles-bicycle accidents.
3.2.3.2 Vehicle factors
As shown in Table 10, in the performance evaluation results of the vehicle factors model, the maximum G-mean value is 54.68%, the maximum AUC value is 57.12%, and the highest accuracy rate for classifying severe and fatal accidents is 40.60%. All these maximum values are obtained from the CatBoost model, which uses cost-sensitive learning for data balancing. After parameter tuning, the optimal model that combines cost-sensitive learning and the XGBoost algorithm achieves a G-mean of 55.27%, an increased AUC value of 56.00%, and an improved accuracy rate of 47.01% for classifying severe and fatal accidents, with an increase of approximately 16%.
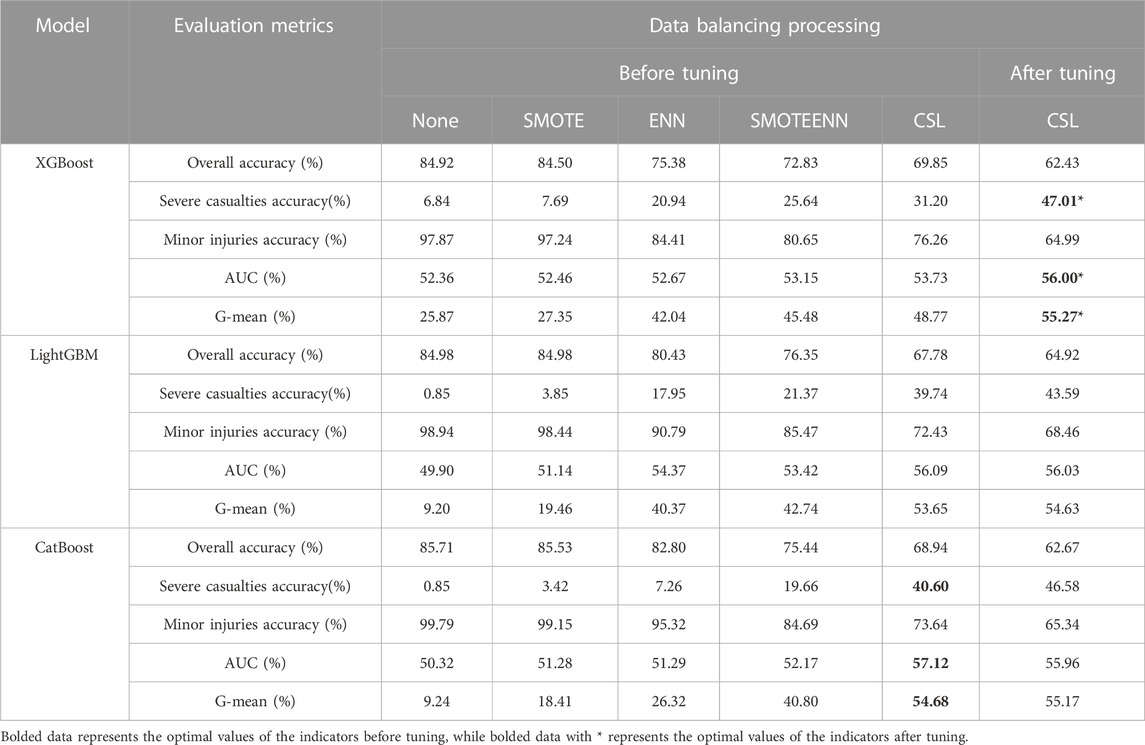
TABLE 10. Performance measurement table of comprehensive accident vehicle factor classification model for new energy vehicles-bicycle accidents.
3.2.3.3 Casualty factors
As shown in Table 11, in the performance evaluation results of the vehicle factors model, the maximum G-mean value is 49.64%, the maximum AUC value is 52.36%, and the highest accuracy rate for classifying severe and fatal accidents is 40.74%. These maximum values are obtained from the LightGBM and CatBoost models, both of which use cost-sensitive learning and hybrid sampling for data balancing. After parameter tuning, the data shows that the model constructed by LightGBM and cost-sensitive learning is the best model. It achieves an increase of 1.35% in G-mean, an increase of 1.30% in AUC value, and an improvement of 0.93% in accuracy rate for classifying severe and fatal accidents.
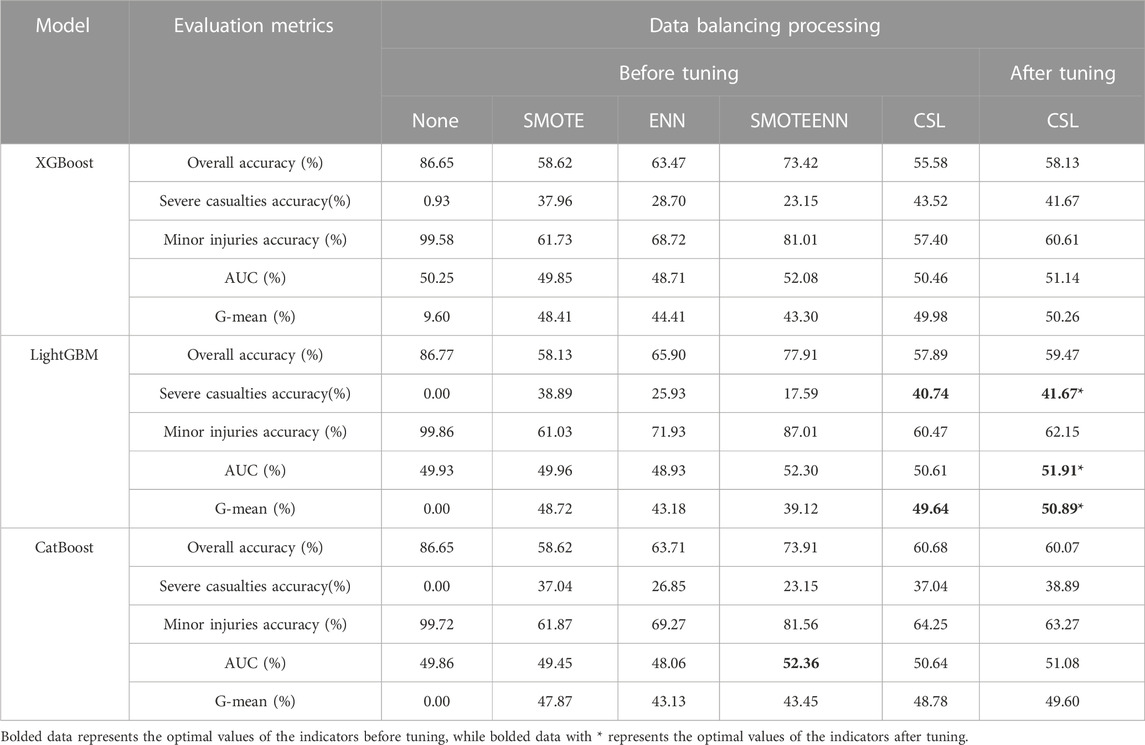
TABLE 11. Performance measurement table of comprehensive accident casualty factor classification model for new energy vehicles-bicycle accidents.
4 Explanation of the severity model for new energy vehicle accidents
4.1 Overall accident analysis
4.1.1 Road and environmental factors
As shown in Figure 1, in the overall analysis of accidents involving new energy vehicles, the presence of police at the scene generally indicates a higher severity level, often resulting in serious injuries or fatalities. Compared to accidents involving two vehicles colliding, accidents involving bicycles and multiple vehicles tend to be more severe. In terms of spatial dimension, the incidence of traffic accidents is higher in urban areas, but the severity level is often minor injuries. On the other hand, accidents occurring in suburban areas, ramps, and near pedestrian facilities tend to have more severe casualties. The severity level of accidents on road segments with speed limits higher than 30 mph is also higher. From a temporal perspective, there has been an increase in the number of accidents involving new energy vehicles in recent years, and they generally show higher severity levels. Additionally, accidents occurring at the end of the month, end of the year, and during early morning hours are generally more severe.
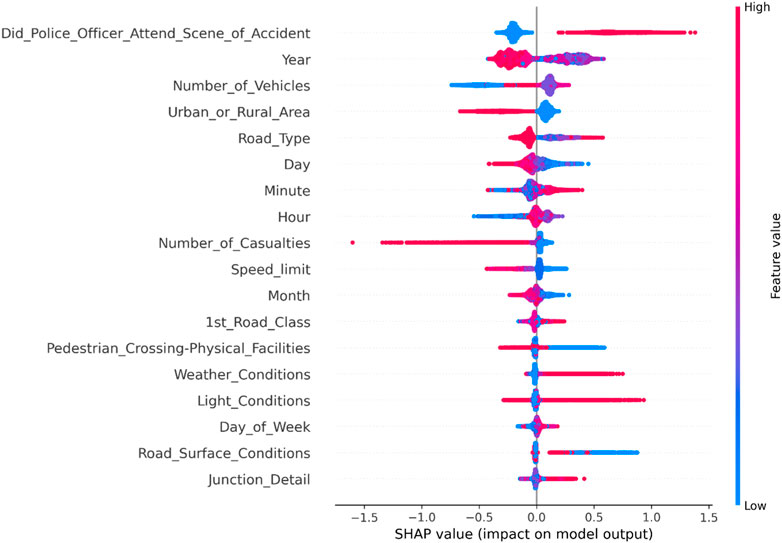
FIGURE 1. Summary diagram of road and environmental factors in overall accidents involving new energy vehicles.
4.1.2 Vehicle factors
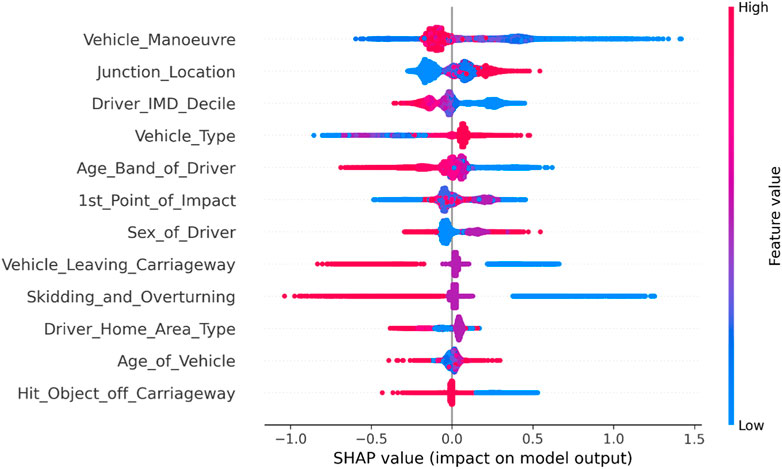
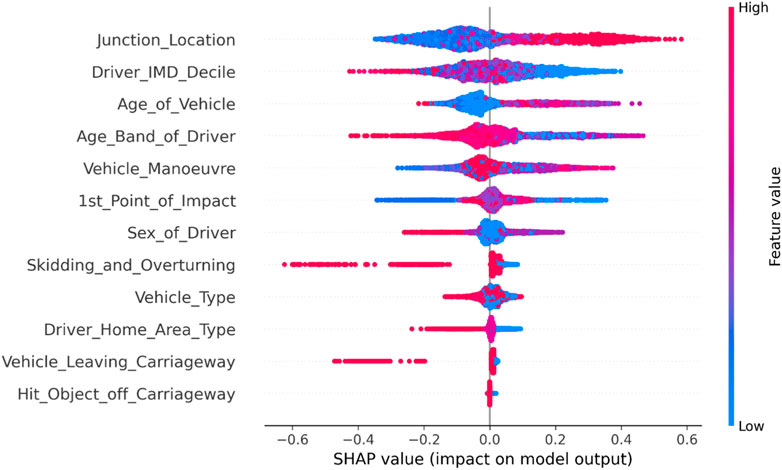
From Figure 2, it can be observed that accidents involving new energy vehicles are more severe during high-speed maneuvers (lane changing, overtaking), and the severity level is often higher when accidents occur in non-intersection areas. Furthermore, drivers of new energy vehicles from families with better socioeconomic conditions are more prone to serious and fatal accidents during their travel. The presence of more vulnerable modes of transportation (bicycles) among the vehicles involved in the accident also leads to higher severity levels. Moreover, older drivers are more likely to increase the severity level of traffic accidents. On the other hand, collisions occurring at the front of the vehicle, or when the vehicle hits roadside objects (curbs, barriers), objects outside the lane (walls, ditches, etc.), or rollovers, are more likely to result in casualties.
4.1.3 Casualty factors
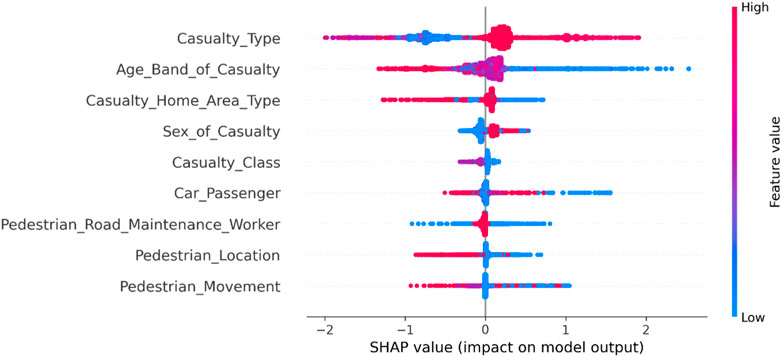
As shown in Figure 3, among the factors affecting casualties in overall accidents involving new energy vehicles, the type of injured individuals has the most significant impact on the severity of the accidents. Individuals driving or riding in less protective modes of transportation are more prone to severe injuries and fatalities. Additionally, traffic accidents tend to cause more severe harm to older individuals. The severity of injuries also varies among individuals from different regions, with residents of suburban areas being more prone to severe injuries and fatalities. When the injured individual is a pedestrian, the severity of injuries is generally higher, leading to a higher likelihood of severe injuries or fatalities.
4.2 Analysis of pedestrian accidents
4.2.1 Road and environmental factors
From Figure 4, it can be seen that in new energy vehicle-pedestrian accidents, whether the police are present or not remains the primary indicator of the severity of the accidents. From a spatial perspective, it is observed that accidents in suburban areas and on high-speed limit sections are more likely to result in severe injuries or fatalities, consistent with the overall characteristics of accidents involving new energy vehicles. However, there are also differences, such as when a new energy vehicle-pedestrian accident occurs at an intersection, it is more likely to cause serious injuries or fatalities. From a temporal perspective, recently occurring accidents of this nature have shown higher severity and greater quantity, but with overall stability. Similarly, serious traffic accidents are more likely to occur at the end of the month, year-end, midnight, and early morning. Additionally, accidents that occur at night in unlit areas tend to have a higher severity.
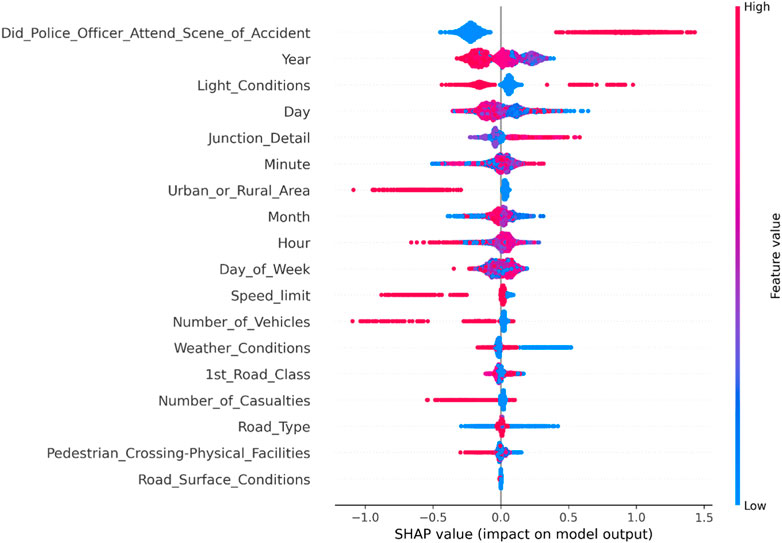
FIGURE 4. Summary diagram of road and environmental factors in new energy vehicle-pedestrian accidents.
4.2.2 Vehicle factors
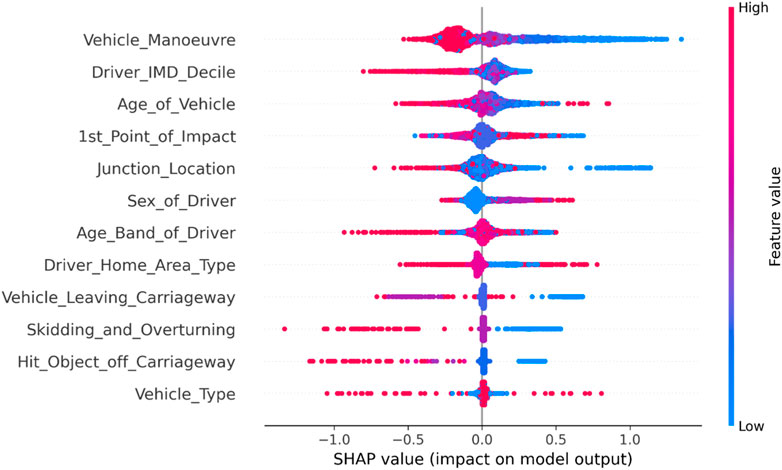
From Figure 5, it can be seen that in terms of vehicle factors in new energy vehicle-pedestrian accidents, vehicles in high-speed motion, vehicles controlled by drivers with better economic conditions or older age, and vehicles with older age are more likely to be involved in severe traffic accidents. Additionally, accidents are more likely to occur when vehicles are inside intersections or when vehicles collide with lane edges, objects outside the road, or experience rollovers. These characteristics are consistent with the overall characteristics of accidents involving new energy vehicles.
4.2.3 Casualty factors
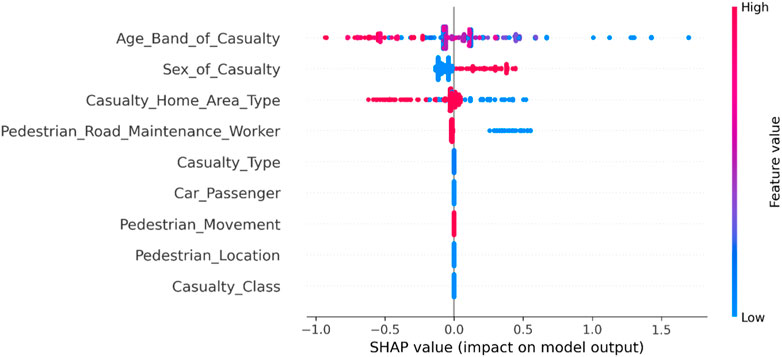
Through the analysis of Figure 6, it is found that in new energy vehicle-pedestrian accidents, the age of the injured individuals has a significant impact on the severity of the accidents. Younger victims tend to have lower injury severity, while older individuals generally suffer more severe injuries. Additionally, more serious traffic accidents are prone to occur in the vicinity of pedestrian sidewalks undergoing construction work, and male gender or victims residing in suburban areas generally have more severe injuries.
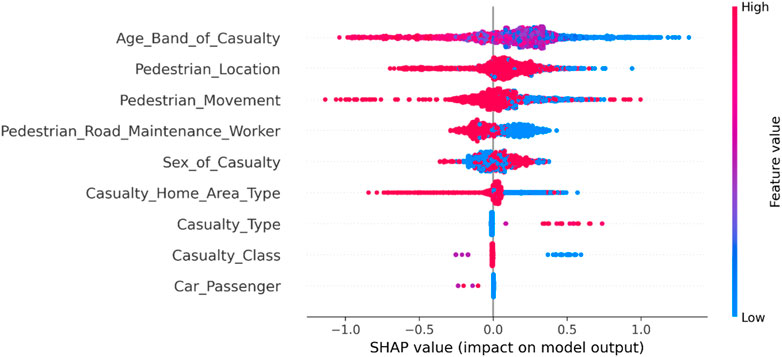
FIGURE 6. Summary diagram of factors related to casualties in new energy vehicle-pedestrian accidents.
4.3 Analysis of bicycle accidents
4.3.1 Road and environmental factors
From Figure 7, it can be observed that in new energy vehicle-bicycle accidents, the year has a greater impact on the severity of the accidents compared to the presence of police at the scene. In addition to similar findings, weekdays versus weekends also have a significant influence on such accidents, with higher severity in new energy vehicle-bicycle accidents occurring on weekends.
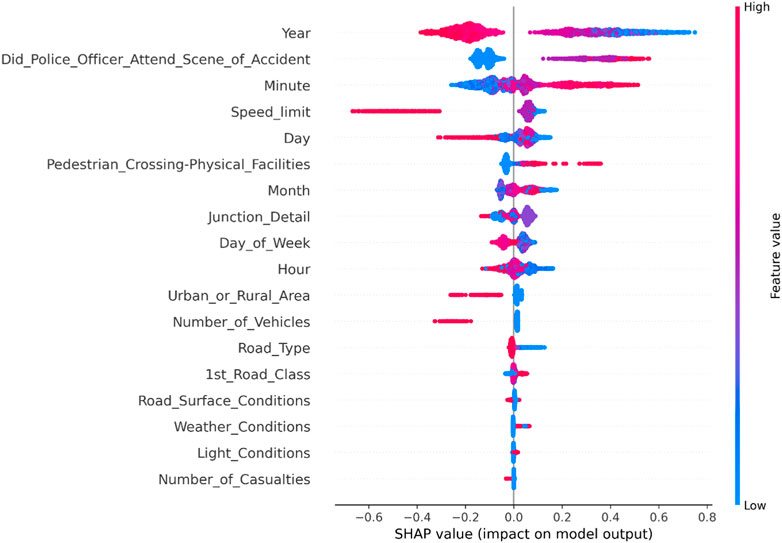
FIGURE 7. Summary diagram of road and environmental factors related to new energy vehicle-bicycle accidents.
4.3.2 Vehicle factors
As shown in Figure 8, in new energy vehicle-bicycle accidents, factors such as whether it occurred at an intersection, driver’s economic condition, vehicle age, driver’s age, and vehicle’s motion state have a significant impact on the severity of the accidents. Vehicles traveling outside intersections, younger vehicles in terms of age, or vehicles controlled by older drivers are more prone to severe traffic accidents. Similarly, accidents involving vehicles in high-speed motion, collisions with lane edges, or rollovers tend to have higher severity.
4.3.3 Casualty factors
From Figure 9, it can be observed that in new energy vehicle-pedestrian accidents, older individuals and male individuals tend to have higher severity of injuries, and victims residing in suburban areas generally have more severe injuries. On the other hand, the severity of new energy vehicle-pedestrian accidents can also be increased when pedestrian walkways are under construction.
5 Conclusion
1) During the process of model building, it was found that cost-sensitive learning is more effective and efficient in handling imbalanced data issues compared to resampling methods. When comparing tree-based ensemble algorithms, LightGBM demonstrated overall stability and higher computational efficiency. XGBoost showed a balance between computational efficiency and model performance. CatBoost, on the other hand, was more time-consuming and exhibited less stability in performance across different datasets.
2) New energy vehicles are more common in urban areas, but they tend to have lower accident severity. On the other hand, accidents that occur in towns or suburban areas may be less frequent but often more severe. Additionally, accidents involving older vehicles, vehicles in high-speed maneuvers (overtaking, changing lanes, etc.), vehicles deviating from lanes, colliding with road edges (curbs, median barriers, etc.), or vehicles overturning tend to have higher severity. Furthermore, vehicles driven by male drivers or drivers with better economic conditions are more prone to serious traffic accidents. This is because male drivers or drivers with better economic conditions tend to focus more on driving experience and may exhibit aggressive driving behaviors. Elderly individuals (drivers or passengers) or individuals using vehicles with poor protection (bicycles, motorcycles) and pedestrians are also prone to serious traffic accidents. This is due to the weaker adaptability and recovery ability of elderly individuals, making them more susceptible to severe injuries or fatalities. Additionally, bicycles and pedestrians are in a vulnerable position in traffic accidents, lacking sufficient protective measures, which can result in serious injuries or fatalities.
3) In pedestrian and bicycle accidents involving new energy vehicles, in addition to the aforementioned characteristics, it has been observed that serious traffic accidents are more likely to occur when pedestrian walkways are under construction. Furthermore, in pedestrian accidents, it has been found that poorly illuminated sections at night are prone to serious traffic accidents. Additionally, when pedestrians engage in improper crossing behaviors (e.g., jaywalking), serious injuries and fatalities are more likely to occur. On the other hand, an anomalous finding has been observed in new energy vehicle-bicycle accidents. It has been found that vehicles with a shorter service time and better condition are more prone to serious traffic accidents, which differs significantly from the influencing mechanisms in other types of accidents.
Data availability statement
The original contributions presented in the study are included in the article/supplementary materials, further inquiries can be directed to the corresponding author.
Author contributions
ZZ: Writing–original draft, Writing–review and editing. ZN: Investigation, Software, Writing–review and editing. YL: Methodology, Writing–original draft. XM: Project administration, Validation, Conceptualization, Writing–review and editing. SS: Writing–original draft.
Funding
The authors declare that no financial support was received for the research, authorship, and/or publication of this article.
Conflict of interest
Author XM was employed by Jiaoke Transport Consultants Ltd.
The remaining authors declare that the research was conducted in the absence of any commercial or financial relationships that could be construed as a potential conflict of interest.
Publisher’s note
All claims expressed in this article are solely those of the authors and do not necessarily represent those of their affiliated organizations, or those of the publisher, the editors and the reviewers. Any product that may be evaluated in this article, or claim that may be made by its manufacturer, is not guaranteed or endorsed by the publisher.
References
AlKheder, S., AlRukaibi, F., and Aiash, A. (2020). Risk analysis of traffic accidents’ severities: an application of three data mining models. ISA Trans., 106. doi:10.1016/j.isatra.2020.06.018
Bentéjac, C., Csörgő, A., and Martínez-Muñoz, G. (2021). A comparative analysis of gradient boosting algorithms. Artif. Intell. Rev. 54, 1937–1967. doi:10.1007/s10462-020-09896-5
Bokaba, T., Doorsamy, W., and Paul, B. S. (2022). Comparative study of machine learning classifiers for modelling road traffic accidents. Appl. Sci. 12 (2), 828. doi:10.3390/app12020828
Chawla, N. V., Bowyer, K. W., Hall, L. O., and Kegelmeyer, W. P. (2002). SMOTE: synthetic minority over-sampling technique. J. Artif. Intell. Res. 16, 321–357. doi:10.1613/jair.953
Chen, J., Zhao, F., Sun, Y., and Yin, Y. (2020). Improved XGBoost model based on genetic algorithm. Int. J. Comput. Appl. Technol. 62 (3), 240–245. doi:10.1504/ijcat.2020.106571
Chen, X., Qu, W., and Liu, C. (2023b). Research on correlations between national economic development and road traffic safety based on the ridge regression. J. Munic. Technol. 41 (7), 1–6. doi:10.19922/j.1009-7767.2023.07.001
Chen, Y., Zhang, L., and Zhou, J. (2023a). Optimization of traffic safety facilities in highway tunnels based on driver’s visual perception. J. Intelligent Constr. doi:10.26599/JIC.2023.9180028
Cocron, P., and Krems, J. F. (2013). Driver perceptions of the safety implications of quiet electric vehicles. Accid. Analysis Prev. 58, 122–131. doi:10.1016/j.aap.2013.04.028
Dorogush, A. V., Ershov, V., and Gulin, A. (2018). CatBoost: gradient boosting with categorical features support. Available at: https://arxiv.org/abs/1810.11363.
Fabian, P., Gaël, V., Alexandre, G., Vincent, M., Bertrand, T., Olivier, G., et al. (2011). Scikit-learn: machine learning in Python. J. Mach. Learn. Res. 12, 2825–2830. doi:10.5555/1953048.2078195
Fleury, S., Jamet, É., Roussarie, V., Bosc, L., and Chamard, J. C. (2016). Effect of additional warning sounds on pedestrians’ detection of electric vehicles: an ecological approach. Accid. Analysis Prev. 97, 176–185. doi:10.1016/j.aap.2016.09.002
Freund, Y., and Schapire, R. E. (1996) Experiments with a new boosting algorithm. Proceedings of the 13th International Conference on Machine Learning, Bari, Italy, July 1996.
Friedman, J. H. (2001). Greedy function approximation: a gradient boosting machine. Ann. Statistics 29 (5), 1189–1232. doi:10.1214/aos/1013203451
Garay-Vega, L., Hastings, A., Pollard, J. K., Zuschlag, M., and Stearns, M. (2010). Quieter cars and the safety of blind pedestrians: phase I. Washington, D.C: National Highway Transportation Safety Agency, 1–151.
Goodes, P., Bai, Y. B., and Meyer, E. (2009). Investigation into the detection of a quiet vehicle by the blind community and the application of an external noise emitting system. SAE Tech. Pap., 4970. doi:10.4271/PT-143/4
Islam, Z., Abdel-Aty, M., Cai, Q., and Yuan, J. (2021). Crash data augmentation using variational autoencoder. Accid. Analysis Prev., 151. doi:10.1016/j.aap.2020.105950
Johnson, J. M., and Khoshgoftaar, T. M. (2019). Survey on deep learning with class imbalance. J. Big Data 6 (1), 27–54. doi:10.1186/s40537-019-0192-5
Lee, J., Yoon, T., Kwon, S., and Lee, J. (2020). Model evaluation for forecasting traffic accident severity in rainy seasons using machine learning algorithms: seoul city study. Appl. Sci. Switz. 10 (1), 129. doi:10.3390/app10010129
Lundberg, S. M., Erion, G., Chen, H., DeGrave, A., Prutkin, J. M., Nair, B., et al. (2020). Explainable AI for trees: from local explanations to global understanding. Nat. Mach. Intell. 2 (1), 2522–5839. doi:10.48550/arXiv.1905.04610
Ofek, N., Rokach, L., Stern, R., and Shabtai, A. (2017). Fast-CBUS: a fast clustering-based undersampling method for addressing the class imbalance problem. Neurocomputing 243, 88–102. doi:10.1016/j.neucom.2017.03.011
Parizet, E., Ellermeier, W., and Robart, R. (2014). Auditory warnings for electric vehicles: detectability in normal-vision and visually-impaired listeners. Appl. Acoust. 86, 50–58. doi:10.1016/j.apacoust.2014.05.006
Prokhorenkova, L., Gusev, G., Vorobev, A., Dorogush, A. V., and Gulin, A. (2018). Catboost: unbiased boosting with categorical features. Adv. Neural Inf. Process. Syst., 6638–6648. doi:10.5555/3327757.3327770
Shapley, L. S. (1953). A value for n-person games. Contributions Theory Games 28 (2), 307–317. doi:10.7249/P0295
Su, W., and Niu, X. (2022). Safety evaluation model of mixed traffic flow at plane intersections. J. Munic. Technol. 90 (5), 50–54. doi:10.19922/j.1009-7767.2022.05.050
Tomek, I. (1976). Two modifications of CNN. IEEE Trans. Syst. Man Cybern. 6 (11), 769–772. doi:10.1109/TSMC.1976.4309452
Wall Emerson, R., Naghshineh, K., Hapeman, J., and Wiener, W. (2011). A pilot study of pedestrians with visual impairments detecting traffic gaps and surges containing hybrid vehicles. Transp. Res. Part F Traffic Psychol. Behav. 14 (2), 117–127. doi:10.1016/j.trf.2010.11.007
Wang, L., Qiu, F., Xia, Y., and Han, X. (2019). Traffic accident prediction of highway tunnel based on road environmental factors. Tunn. Constr. 39 (08), 1301–1307. doi:10.3973/j.issn.2096-4498.2019.08.011
Wilson, D. L. (1972). Asymptotic properties of nearest neighbor rules using edited data. IEEE Trans. Syst. Man Cybern. 2 (3), 408–421. doi:10.1109/tsmc.1972.4309137
Wogalter, M. S., Lim, R. W., and Nyeste, P. G. (2014). On the hazard of quiet vehicles to pedestrians and drivers. Appl. Ergon. 45 (5), 1306–1312. doi:10.1016/j.apergo.2013.08.002
Xu, M. (2022). Research on one-way traffic in small block with dense road network. J. Munic. Technol. 40 (11), 117–123. doi:10.19922/j.1009-7767.2022.11.117
Keywords: green transportation, traffic engineering, ensemble learning, traffic accidents, new energy vehicles
Citation: Zhang Z, Niu Z, Li Y, Ma X and Sun S (2023) Research on the influence factors of accident severity of new energy vehicles based on ensemble learning. Front. Energy Res. 11:1329688. doi: 10.3389/fenrg.2023.1329688
Received: 29 October 2023; Accepted: 14 November 2023;
Published: 28 November 2023.
Edited by:
Meng Jia, Shandong University of Science and Technology, ChinaReviewed by:
Jing Xu, East China Jiaotong University, ChinaFucheng Guo, Lanzhou Jiaotong University, China
Copyright © 2023 Zhang, Niu, Li, Ma and Sun. This is an open-access article distributed under the terms of the Creative Commons Attribution License (CC BY). The use, distribution or reproduction in other forums is permitted, provided the original author(s) and the copyright owner(s) are credited and that the original publication in this journal is cited, in accordance with accepted academic practice. No use, distribution or reproduction is permitted which does not comply with these terms.
*Correspondence: Yan Li, bGl5YW5AY2hkLmVkdS5jbg==
 Zixuan Zhang1
 Zhenxing Niu
 Yan Li
 Shaofeng Sun