 Lifei Lin1
 Song Li
- 1Shaanxi Yanchang Petroleum (Group) Co., Ltd., Yan’an, China
- 2School of Oil and Natural Gas Engineering, Southwest Petroleum University, Chengdu, China
- 3Changqing Downhole Technology Operation Company of Chuanqing Drilling Engineering Co., Ltd., Xi’an, China
- 4Engineering Research Institute of PetroChina Southwest Oil and Gas Field Company, Chengdu, China
The production of fractured oil and gas reservoirs in the world accounts for more than half of total oil and gas production and is one of the important fields for increasing oil and gas storage and production in the 21st century. The key to characterizing fractured oil and gas reservoirs is the distribution pattern of natural fractures. The distribution of natural fractures is dominated by structural deformations and fractures. Therefore, analytical and structural simulations of the tectonic stress field in geological structural systems play a crucial role in obtaining fracture distribution patterns. In this paper we have developed a description of the distribution of natural fractures based on finite element numerical simulations of the paleotectonic stress field. The study focused on the Chang 7 and Huangjialing Chang 8 reservoirs in the underground Siwan region of the Ordos Basin in China. First, an experimental assessment of the rock mechanics of the reservoir was completed, and the values of the paleotectonic stresses obtained from the tests were used as inversion criteria for the stress field simulations. Based on the geology, a refined geological model has been developed to study the structure of the Chang 7 and Chang 8 oil reservoirs in the block. The simulated paleotectonic stress fields for natural fractures in the Indosinian period are as follows: maximum principal stress of 94.67 MPa, minimum principal stress of 21.58 MPa, and vertical stress of 28.07 MPa. The direction of maximum principal stress remains essentially in the NE-SW direction, with the largest differential stress occurring in the Chang 8 oil layer group in Huangjialing, while the differential stress is relatively uniform in the Chang 7 oil layer group in Xiasiwan. It predicts the relative density of natural fractures in the Chang 7 and Chang 8 reservoirs, and finds high-to-low plane heterogeneity in the Huangjialing Chang 8 reservoir group and the Xiasiwan Chang 7 reservoir group, respectively. The paper reveals the pattern of development of reservoir fractures in both vertical and horizontal directions, providing an important geological basis for efficient and rational exploitation of oil and gas resources in the study area and improving oil recovery.
1 Introduction
As the world’s conventional oil and gas resources are increasingly depleted, their production is gradually declining, which conflicts with increasing demand. As a result, unconventional oil and gas resources such as low permeability tight oil and gas are gradually gaining attention. Among them, tight oil and gas, due to its wide distribution, abundant resource reserves and long extraction life, has gradually become a hot research area among relevant scholars worldwide and a hot direction for oil and gas exploration and development (Song et al., 2001; Gong et al., 2019; Li, 2021; Tan et al., 2023).
In recent years, methods for predicting fractures can be roughly divided into three methods: using tectonic stress fields to predict fracture development, using logging data to predict fracture development, and using seismic methods to predict fractures (Zhang et al., 2022a; Hu, 2022). Many scholars have studied the relationship between tectonic stress field and the development and distribution of fractures in oil and gas reservoirs, and have obtained many important insights, which have effectively guided oil and gas exploration (Li and Zhang, 1997; Wang et al., 1997; Qin et al., 2004; Zhang et al., 2022b; Liu et al., 2023). Therefore, tectonic stress field simulation can predict the development and distribution of tectonic fractures. Rouchet, (1981) proposed that “stress field is the key to oil and gas migration,” breaking the common understanding that formation water migration is the key factor determining oil and gas migration, and fundamentally revealing the mechanism of oil and gas migration. The crucial role of tectonic stress field in the exploration and exploitation of fractured oil and gas resources (Wu et al., 2022a). Under the action of regional tectonic stress, fractures and fractures are formed in the rock, so the distribution and characteristics of fractures are closely related to all the tectonic movements, stress field sizes and directions experienced in the region (Wang, 2013; Lou et al., 2020; Tan et al., 2020). Murry, (1977) studied and established the relationship between the main curvature of the structure and the degree of fracture development. Zobock (Zobock et al., 1985; Zobock and Peska, 1995) measured the magnitude of ground stress using hydraulic fracturing, Haimson and Herrick, (1985) and Peska and Zoback, (1995) studied the magnitude and direction of the corresponding stress field using wellbore collapse method, and Jaeger et al. (2007) conducted systematic experimental research on the stress field using rock group method, The research results obtained through these experimental testing methods have played an important role in the exploration and development of oil and gas fields.
Currently, fractures are mainly studied with a focus on mechanical causes, and fractures are evaluated by simulating the tectonic stress field using different methods. Some researchers analyze rock mechanical parameters for different lifetimes through lithographic segmentation, construct geological models, and convert geological models into rock mechanical models for stress-field simulations (Ding et al., 2016). Some researchers also use finite element software to conduct mechanical analysis of rock layers and establish in situ stress models (Hu et al., 1994; Guo et al., 2016; Xu et al., 2017; Tan et al., 2021; Wu et al., 2022b; Wang et al., 2022) to obtain the spatial distribution characteristics of in situ stress, and based on this, predict fractures. Wei and Sun, (2016) believed that structural fractures in low-permeability reservoirs are important storage spaces for oil and gas, which can significantly improve reservoir permeability. They used a three-dimensional finite element model (3D-FEM) to simulate the Himalayan paleotectonic stress field, estimated rock failure criteria (RFC) and comprehensive fracture rate (CRR), and quantitatively determined the development and distribution of structural fractures in low-permeability reservoirs of the Xiagou formation. Khair et al. (2015) used image log fractures and fault network within an iterative boundary element method (iBEM3D) to predict the paleo-tectonic events and the fracture network in the Cooper Basin. Their methodology was able to predict only the major tectonic events that occurred after the deposition of the Cooper Basin sediments and contributed to the formation of the natural fractures. Wu et al. (2017) established a reasonable geological, mechanical, and mathematical model for the study area based on the fault system interpreted by seismic data, fracture characteristics of drilling data, uniaxial and triaxial compression tests, and rock acoustic emission tests. They overlaid multiple stages of ancient tectonic stress fields and predicted the distribution of reservoir structural fractures. Feng et al. (2019) used a finite element based on geomechanical modeling method to infer the degree of fracture development based on stress-strain curves, establish a mathematical model for fracture development, and quantitatively predict fracture development and distribution. Li et al. (2021) took Halahatang Oilfield in the north of Tarim basin as the research object, comprehensively used outcrop observation, drilling core, thin section, logging and seismic data, simulated the structural stress field of deep carbonate reservoir in three different tectonic movement periods based on finite element method, and quantified the spatial distribution characteristics of multi-stage fractures with fracture density as the evaluation parameter. Huang et al. (2019) studied the effect of inherent anisotropy and particle size distribution of rock on the initiation and propagation of hydraulic fractures under different propagation mechanisms through two-dimensional discrete element simulation. Ren et al. (2019) determined the characteristics of tectonic fractures parameters based on the data of formation core and imaging logging. The paleo tectonic stress field of two key fracture periods and current stress field in Hetian river gas field were simulated by combining 3 D element numerical simulation method, and the fracture linear density and aperture formulas were established to calculate the distribution of tectonic fractures in different periods. Huang et al. (2023) proposed a mathematical method for the generation of irregular polygonal gravels, and established the hydraulic fracturing model of glutenite with different gravel characteristics utilizeing 2D particle discrete element method.
Finite-element numerical simulations of the paleotectonic stress field to predict fracture are one of the effective methods for semi-quantitative characterization of fracture development in reservoirs. This approach was first evaluated experimentally in rock mechanics, where values of protective stresses obtained from rock mechanics experiments were used as inversion criteria for stress field simulations. At the same time, an objective fine-grained geological model of the structure of the oil reservoir is developed on a geological basis, and the two are combined to model the paleotectonic stress field during the main formation period of the natural fracture. The fracture rate is calculated by analyzing the ancient tectonic stress field and then predicting the extent of structural fracture in the reservoir. The finite element numerical simulation method can not only restore the distribution of reservoir structural stress field during the formation period of structural fractures, but also predict the distribution and development degree of reservoir structural fractures based on geological mechanics theory, providing technical support for the exploration and development of fractured oil and gas reservoirs. Therefore, in this paper we numerically simulate the paleotectonic stress field in the studied region and predict the relative density of natural fractures in the studied region.
2 Analysis of paleostress during the formation of fractures
2.1 Principles of acoustic emission experiment
The process of measuring in situ stresses using the acoustic emission Kessel effect method involves indoor loading tests on rocks taken from underground sites. Acoustic emission instruments are used to measure acoustic signals emitted from the interior of the rock during loading. According to the Kessel effect principle, when the stress on a rock reaches its historical maximum, the acoustic signal generated by the rock will suddenly increase. Based on this, it is possible to obtain stress values for the test rock below ground. Due to the 3D forces acting on the subsurface rock, it was necessary to carry the core in different directions for testing. Generally, when re coring rock cores taken from the site indoors, at least one vertical and three horizontal directions (each separated by 45°) of rock samples should be taken. Based on the results of the tests performed on the four rock samples described above, the primary geostress of the three formations at the depth of the well in which the rock is located can be fully determined using the following formula:
Where,
2.2 Acoustic emission experimental results
In this experiment, ten representative samples from the target layer were selected for lithography. As an example, experimental procedures and data processing were performed on samples taken from 1,568.00 to 1,568.63 m underground in Well Xin 118. Firstly, manually set a reference line on the sample and take four column samples along the 0°, 45°, 90°, and vertical directions (Figure 1).
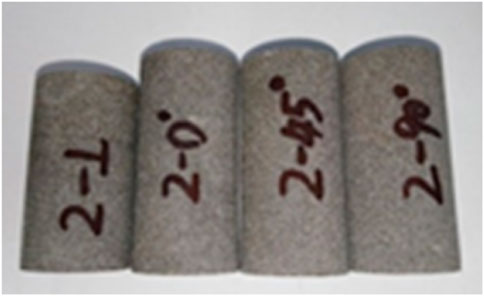
FIGURE 1. Core sample of reservoir core in Xin 118 well.
An acoustic emission experiment was subsequently performed using the experimental core sample. The experimental results showed that the stress value corresponding to the 0° direction was 112.4 MPa, the stress value corresponding to the 45° direction was 112.5 MPa, the stress value corresponding to the 90° direction was 29.1 MPa, and the stress value corresponding to the vertical direction was 48.2 MPa. Further combining the log and production data, we obtain the relevant parameters. Based on Eq., it can be calculated that the maximum principal stress of the experimental rock sample during the period of most severe geological activity and fracture formation is 106.6 MPa, the minimum principal stress is 18.4 MPa, and the vertical stress is 28.3 MPa.
2.3 Paleostress analysis
According to the above method, the other 9 samples were tested sequentially and the paleotectonic stress results of 10 samples were calculated (Table 1).
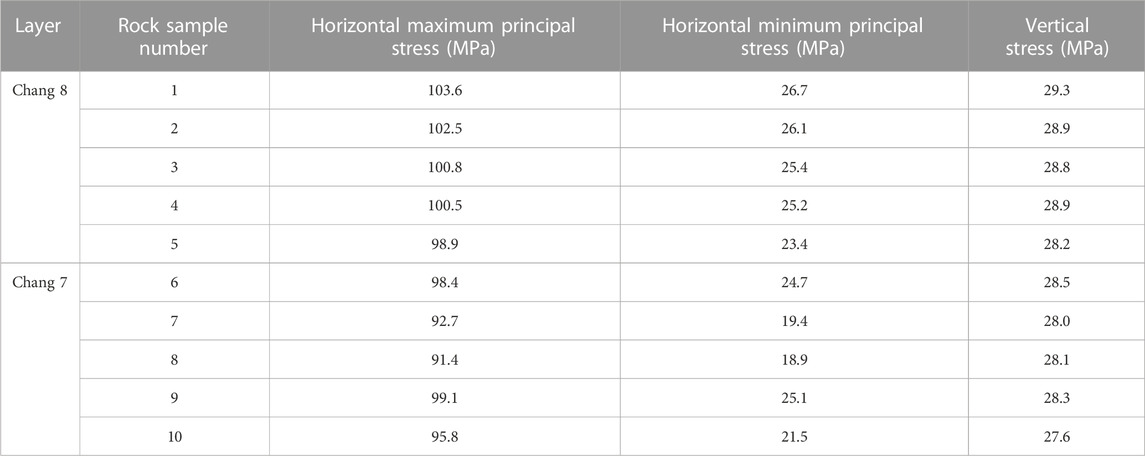
TABLE 1. Paleostress and main stress data during the main fracturing period in the study area.
From Table 1, it can be seen that there is not much difference between the measurements in this region. Considering that the ten samples underwent similar tectonic evolution processes and experimental errors, the average of the measured results for these samples was taken to be the paleostress of the region during the period of most intense geological activity and fracture formation. Thus, during that period, the maximum principal stress in layer 7 was 95.48 MPa, the minimum principal stress was 21.92 MPa, and the vertical stress was 28.10 MPa. The maximum principal stress of the 8th layer is 101.26 MPa, the minimum principal stress is 25.36 MPa, and the vertical stress is 28.82 MPa.
3 Rock mechanics parameter testing
3.1 Experimental equipment and steps
The uniaxial and triaxial strength testing equipment used in this experiment (Figure 2) consists of five main parts: a high-temperature and high-pressure triaxial chamber, a confining pressure system, an axial pressure system, a heating and constant temperature system, and a data acquisition and control system. The design of the triaxial chamber is based on a confining pressure of 100 MPa and a diameter of 50 mm to accommodate rock samples. The internal design of the high-pressure kettle has a compensation function for the confining pressure of the system during loading, which can self-offset the upward force on the plunger due to the confining pressure. Thus, in triaxial experiments, the longitudinal pressure exerted by the press on the rock sample is equal to the differential pressure exerted on the rock sample, making the operation and use of the press very convenient. The confining pressure and axial pressure of the triaxial chamber are controlled and pressured by electro-hydraulic servos. In the experiments, the axial and transverse strains and axial loads of the rock samples were measured by sensors mounted in a high-pressure kettle, and the data signals were transmitted to a computerized automated collection and control system. It enables automatic data collection, storage, processing and plotting of stress-strain curves.
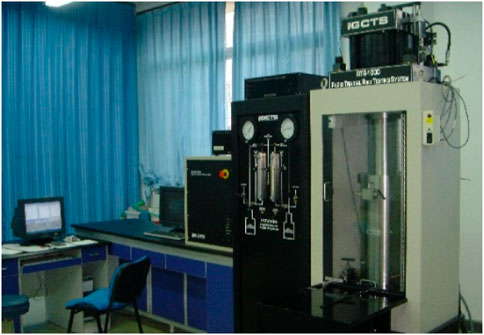
FIGURE 2. Experimental setup diagram.
The experimental steps are as follows:
(1) The processed rock sample is placed in a high-pressure vessel.
(2) Open the computer data collection system, adjust the program, and everything is in a ready state; During uniaxial testing, the hydraulic press is directly turned on to apply axial load to the sample, and the data collection system collects and records the stress and strain of the rock sample during the loading process until the rock sample is damaged and loading stops. During triaxial testing, a high-pressure pump is used to apply confining pressure to a certain value, and then a hydraulic press is turned on to apply axial load to the sample. The data collection system collects and records the stress and strain of the rock sample during the loading process, until the rock sample is damaged and loading stops.
(3) At the end of the experiment, a computer data acquisition system is used to draw the stress-strain curve, which can be saved as a file or printed out by a printer.
3.2 Calculation of rock mechanics parameters
The experimental data collected by the testing machine can be processed by a computer to obtain a stress-strain curve, and the elastic modulus can be calculated using the following formula:
Where,
The calculation formula for Poisson’s ratio of rocks:
Where,
From the triaxial compressive strength test, the failure strength of the specimens under different confining pressures can be obtained. The Mohr Coulomb criterion is used to regress the experimental data, and the internal friction angle and cohesion of the specimens can be obtained.
3.3 Experimental results of rock mechanics
This experiment will divide the samples obtained in each study area into four categories based on sand mud ratio and sedimentary facies. At the same time, the average mechanical properties of the samples obtained near the edge of each study area will be used as a representative of the mechanical properties of the surrounding rocks in the study area. After experiments, as shown in Table 2.
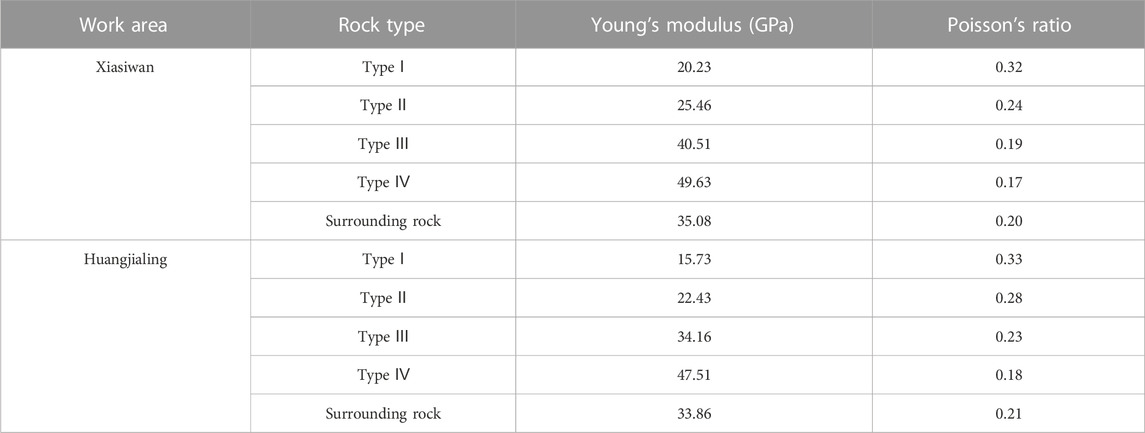
TABLE 2. Experimental data results of mechanical properties of samples in the study area.
4 Numerical simulations of paleotectonic stress field in reservoirs
4.1 Principles of finite element numerical simulation
The finite element method (FEM) is widely used to solve mathematical, physical, and engineering problems, also known as finite element numerical simulation. The basic principle of finite element method is to solve boundary value problems of partial differential equations through variational methods. The overall idea is to subdivide the large problem into smaller finite element elements. As the large solving model is subdivided, each small element has a single and simple form, which is easy to solve. Each element is connected by nodes, and algebraic methods are introduced to associate the nodes with the internal solution quantity of the element. Then, the simple equation finite element modeling generated by a single element is integrated into a total system of equations to model the entire problem. Finally, the variational method in the variational principle is used to minimize the relevant error function and obtain the optimal solution.
As a type of complex material unit, geological bodies can be divided into individual small, homogeneous, and simple form units using finite element method. By dividing a large number of fine and simple structural units and accumulating the units, close to the actual geological conditions can be obtained, and reasonable results can be obtained. Analyzing the distribution pattern of ground stress in reservoirs through finite element numerical simulation is helpful in understanding the structural morphology of oil and gas bearing basins, analyzing the migration patterns of oil and gas, and most importantly, predicting the distribution of fractures in reservoirs.
4.2 Finite element numerical simulation of paleostress field
The in situ stress field is the fundamental cause of structural fractures in reservoirs. Therefore, the study of structural in situ stress is crucial for analyzing and studying fractures. In order to quantitatively simulate the stress state of each point in the study area, this paper uses numerical simulation methods to study the tectonic stress field. In this numerical simulation, the geological body data obtained from reservoir modeling is mainly relied on, and on the basis of mainly considering the shale content, the stress effect inside the reservoir and the main factors controlling the distribution of fractures are comprehensively considered for numerical simulation. Because the fractures in the underground Siwan and Huangjialing work areas of the Ordos Basin were mainly formed during the Indosinian tectonic geological movement. Therefore, this article uses the finite element numerical simulation method and relevant software to conduct a study on the Indosinian in situ stress finite element numerical simulation of the Chang 7 and Chang 8 reservoirs in the study area.
The process of finite element numerical simulation mainly includes the establishment of geological models, mechanical models, and digital models. Among them, the establishment of geological models is the key to finite element numerical simulation, the establishment of mechanical models is the key to converting geological models into numerical calculations, and the establishment of mathematical models is the process of quantitative prediction of fractures in the research area.
The establishment of this research model mainly considers the following four points:
(1) The clarity of studying bulk unit materials indicates that different materials undergo different deformations under stress.
(2) The selection and limitation of geological isolation bodies.
(3) The zoning of geological bodies has different rock mechanics parameters in different regions.
(4) Determination and experimental analysis of rock mechanical parameters in different attribute areas. The dynamic mechanical parameters obtained from rock mechanics experiments and the static mechanical parameters calculated from logging data are converted to obtain the rock mechanics parameters of the entire area, such as Young’s modulus, Poisson’s ratio, cohesion, internal friction angle, etc. The key is the selection of rock mechanics parameters, which greatly affects the accuracy of the simulation. The simulated rock mechanics parameters were obtained through acoustic emission experiments.
4.2.1 Geological model of the work area
Geological models should accurately reflect the surface structure and sedimentary environment of ancient geological periods. In order to develop a geological model, it is necessary to consider in a comprehensive way the sedimentary microstructure, the sand-to-soil ratio, the structural evolution history, and the logging data of the study area. Combined with experimental data on indoor rock mechanics, a geological model of the actual work area should be divided into zones. Each zone has different rock mechanics parameters, that is, different compressive and stabilizing forces corresponding to stress effects. In geological models, the main parameters used are the Young’s modulus and the Poisson’s ratio.
Based on the actual tectonic movement in the study area, through the observation of outcrop structural deformation (including joints, folds, faults, etc.) in the Ordos Basin and the establishment of structural formation sequences, it can be concluded that since sedimentation, the main period of fracture formation in the study area has been the Indosinian ancient tectonic movement. Thus, the data obtained from acoustic emission can be identified as representing the ancient stress state of the Indosinian period. Based on the results of acoustic emission experiments, numerical simulation calculations of the Indosinian period were conducted on the main source rocks in the area (Figures 3, 4). Due to the monoclinic structure of the study area, which is relatively simple in structure, there was no significant tectonic movement during the geological history period. Therefore, in this simulation, the current stratigraphic structure map approximately represents the ancient topography during the formation of the two stages of fracture.
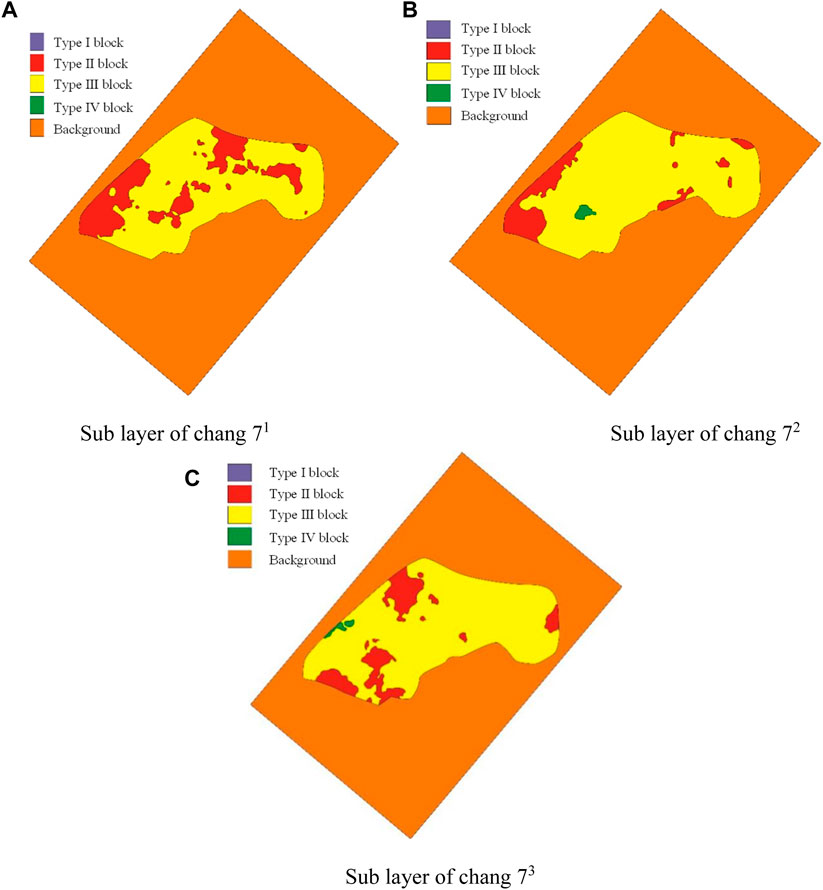
FIGURE 3. Geological models of each sub layer of Xiasiwan Chang 7. (A) Sub layer of chang 71 (B) Sub layer of chang 72 (C) Sub layer of chang 73.
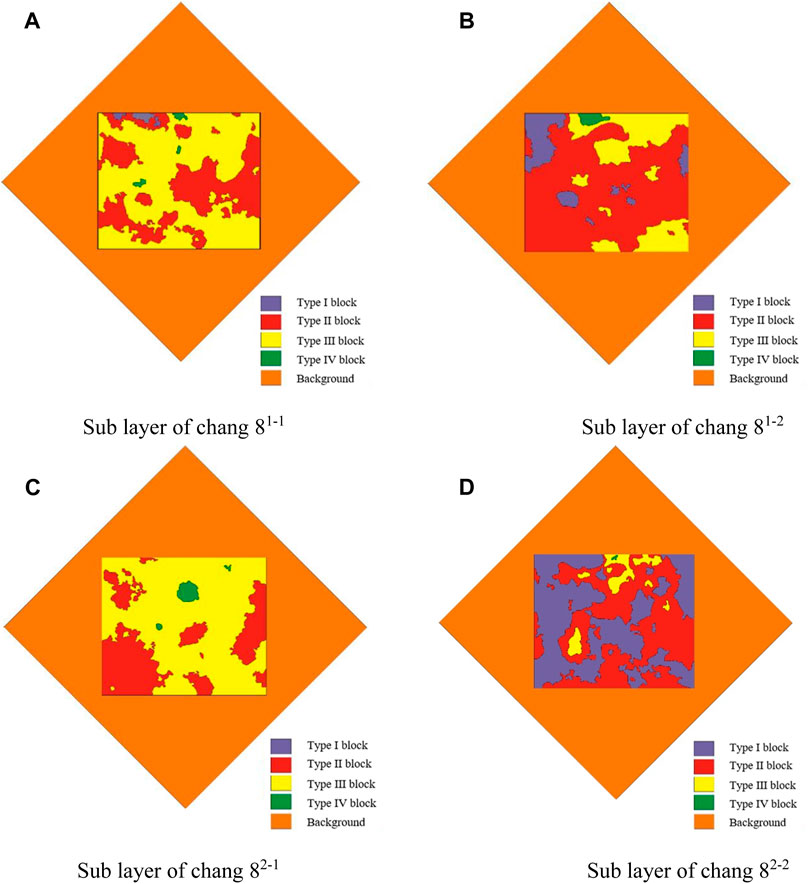
FIGURE 4. Geological models of each sub layer of Chang 8 in Huangjialing. (A) Sub layer of chang 81–1 (B) Sub layer of chang 81–2 (C) Sub layer of chang 82–1 (D) Sub layer of chang 82–2.
As shown in the above Figure 4, based on the ratio of structural highs to sand content, combined with the degree of structural deformation, and taking into account geological factors, the geological bodies in the work area were classified into attributes, and geological models were established for their main production layers. Each work area is divided into 5 different attribute units, and the mechanical properties of the same class of attribute units within each work area are the same. The mechanical properties of the same class of attribute units vary between work areas. Different attribute units have been selected to test their rock mechanical properties, and the conclusions can be found in the rock mechanical experiments mentioned above.
4.2.2 Mechanical and mathematical models of the work area
The mechanical model is built on top of a geological model whose stress conditions and boundary constraints are mainly determined by combining the actual situation in the studied region with the main stress conditions studied during each phase of the orogeny. Based on field outcrop and core observation research, the mechanical model in this numerical model adopts the method of adding maximum principal stress in the NE-SW direction (2,200 m), adding minimum principal stress in the NW-NE direction, and without any constraints around (Figure 5A). This can effectively remove boundary effects and provide model prediction accuracy. The mathematical model mainly solves differential equations under the control of the physical properties of the reservoir. It is built on geological and mechanical models, and different computational and grid partitioning schemes can be chosen based on the actual geological features and accuracy requirements. This study comprehensively considers the complexity of stratigraphic zoning and adopts the triangulation method for calculation (Figure 5B).
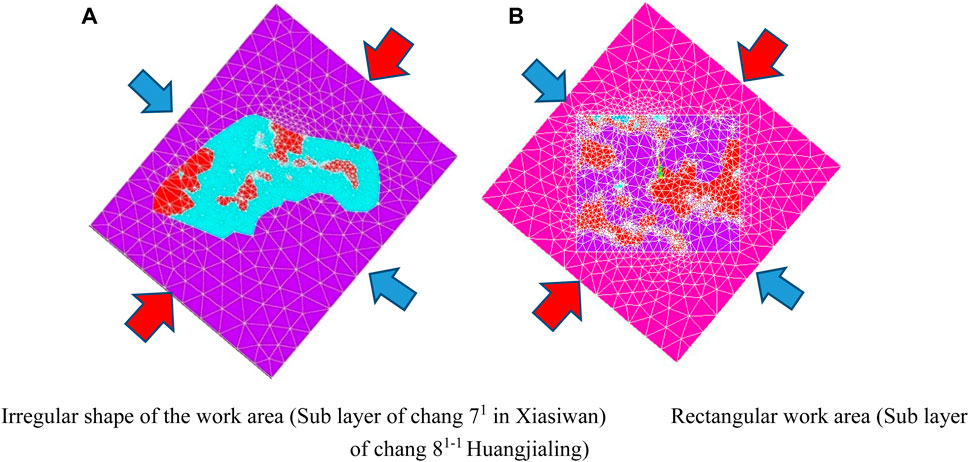
FIGURE 5. Schematic diagram of small layer mechanical model and grid division. (A) Irregular shape of the work area (Sub layer of chang 71 in Xiasiwan) (B) Rectangular work area (Sub layer of chang 81–1 Huangjialing).
4.3 Finite element numerical simulation results of paleostress field
4.3.1 Direction of principal stress
Numerical simulation shows that during the Indosinian period, the direction of rock mechanical properties in different blocks and layers in a single work area changed slightly, but due to the absence of faults, the structure was relatively simple and the overall direction remained unchanged (as shown in Figures 6, 7). The yellow arrow represents the minimum principal stress direction, while the blue arrow represents the maximum principal stress direction. It can be seen that the maximum principal stress directions of the four work areas in the entire research area remain basically in the NE-SW direction.
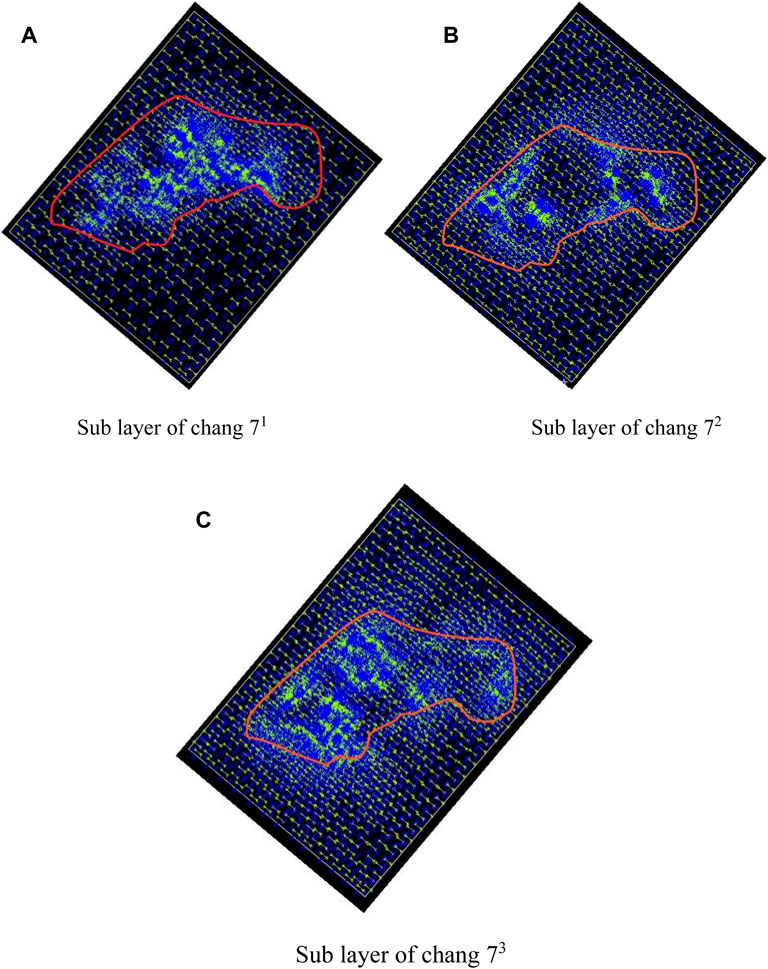
FIGURE 6. Schematic diagram of main stress directions for each small layer of Xiasiwan Chang 7. (A) Sub layer of chang 71 (B) Sub layer of chang 72 (C) Sub layer of chang 73.
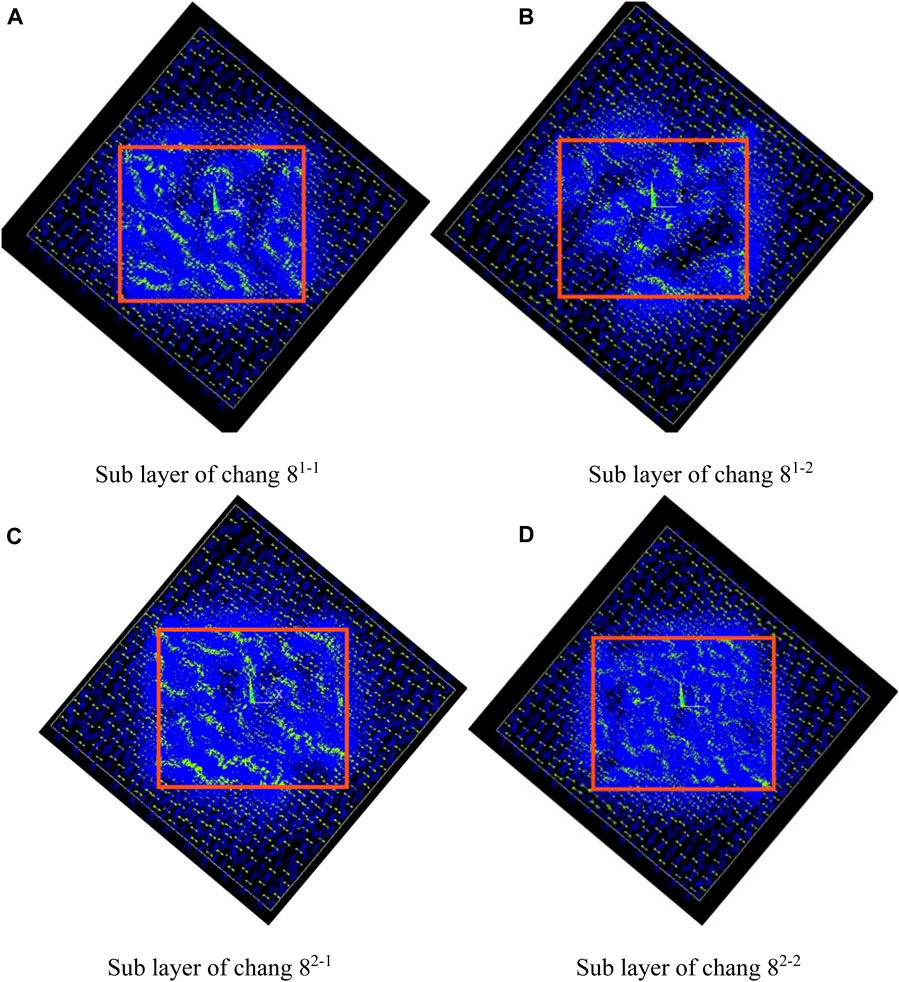
FIGURE 7. Schematic diagram of main stress directions for each sub layer of Huangjialing Chang 8. (A) Sub layer of chang 81–1 (B) Sub layer of chang 81–2 (C) Sub layer of chang 82–1 (D) Sub layer of chang 82–2.
4.3.2 Distribution of differential stress magnitude
Through numerical simulation, it was found that the distribution range of differential stress varies slightly among different research layers due to differences in their internal structural morphology and rock composition, but the overall difference is not significant (Table 3).
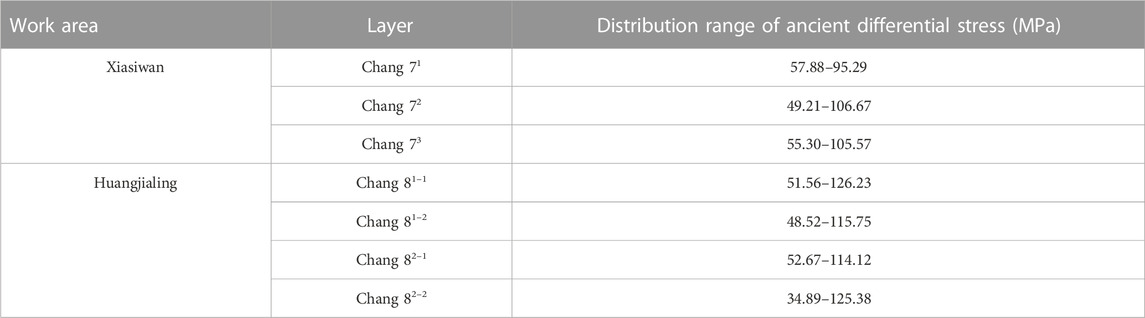
TABLE 3. Distribution of differential stress in the study area.
In the same research horizon, the distribution of differential stress during the Indosinian period is controlled by multiple factors, among which the mechanical properties of rocks and the direction of principal stress have a significant impact. In areas with low Poisson’s ratio and high Young’s modulus, the differential stress is generally higher. At the same time, the distribution of differential stress is patchy and banded, with the extension direction of the band parallel to the maximum principal stress direction (Figures 8, 9).
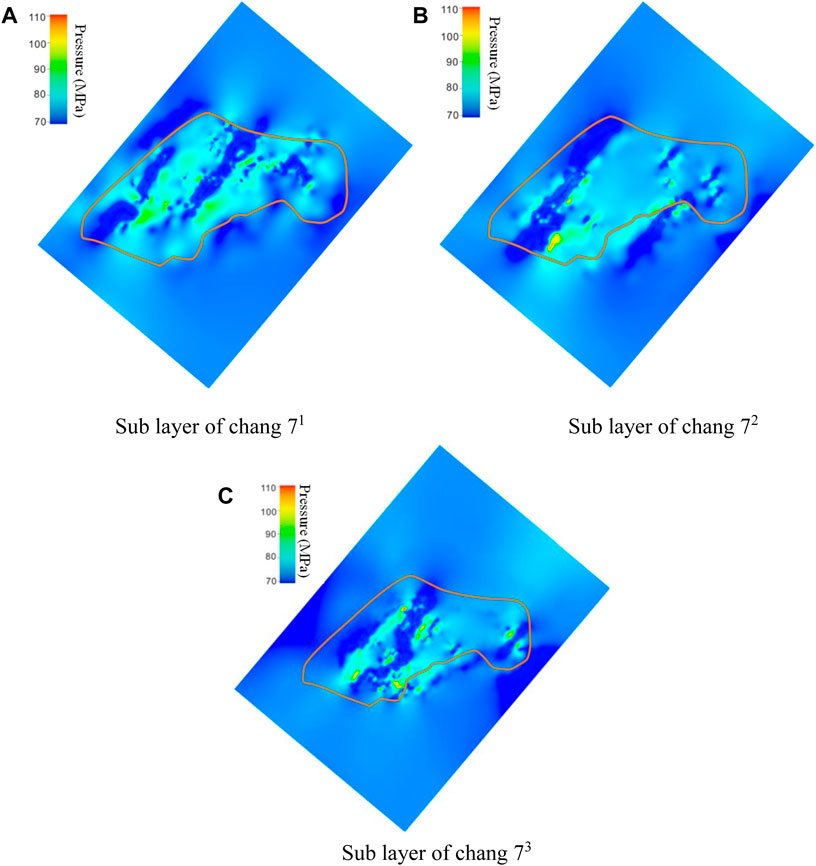
FIGURE 8. Distribution of differential stress in different layers of Xiasiwan Chang 7. (A) Sub layer of chang 71 (B) Sub layer of chang 72 (C) Sub layer of chang 73.

FIGURE 9. Distribution of differential stress in different sub layers of Huangjialing Chang 8. (A) Sub layer of chang 81–1 (B) Sub layer of chang 81–2 (C) Sub layer of chang 82–1 (D) Sub layer of chang 82–2.
By comparing the differential stress distribution map with the lithological distribution maps obtained in the other sections, it is found that the differential stress shows a significant increase in areas with high sand content and a significant decrease in areas with high mud content. There is a good correspondence between lithology and the magnitude of differential stress. The reason for this is that lithology largely controls the mechanical properties of the mechanical units, which are the main factors governing the distribution of differential stresses. Moreover, there is a good correlation between the distribution of the lithology and the differential stress.
5 Comprehensive evaluation of the plane development law of natural fractures
5.1 Evaluation principle of reservoir fracture plane development law
Underground rock masses can rupture and create fractures under in situ stress. According to the theory of elastic mechanics, the elastic strain energy accumulates inside a solid during deformation and its magnitude can be measured by the strain energy density. The strain of elastic materials follows the generalized Hooke’s law, so that the elastic strain energy of a rock can be calculated in terms of stress and strain. According to maximum strain energy density theory and maximum tensile stress theory in brittle fracture mechanics, fracture occurs when the release rate of elastic strain energy accumulated within the rock is equal to the energy required to generate a fracture surface per unit area. In this way, we can fully evaluate the planar development law of reservoir fracture based on the ancient stress field, provided we obtain the mechanical properties of the rock.
When a rock fractures, some of the strain energy released is used to offset the surface energy required for the newly added fracture surface area, while the rest is released in the form of elastic waves (cross-sectional energy). For fractures, the elastic wave energy is very small and negligible, so the partial strain energy released within the unit is equal to the energy required for the newly added fracture surface area. If ωf is considered as the remaining strain energy density after subtracting the elastic strain energy density f that must be overcome to generate fractures from the current strain energy density of the unit, the calculation formula for fracture volume density ωe is:
Where, Dvf is the volume density of fractures within a unit, which is the ratio of the total surface area of the fracture body to the volume of the unit body, m2/m³. Sf is the new fracture surface area, m2. V represents the volume of the characterized unit, m³;ωf is the strain energy density required for the newly added fracture surface area, J/m³. J is the energy required to generate fractures per unit area, J/m2. ω is the strain energy density, J/m ³;ωe is the elastic strain energy density that must be overcome to generate fractures, J/m³. E is the elastic modulus, MPa. μ is the stiffness coefficient, N/m. σ1, σ2, σ3 are the maximum principal stress, intermediate principal stress, and minimum principal stress, MPa.
Due to the different mechanical properties of brittle elastic rocks under compressive stress and tensile stress, it is necessary to analyze the various in situ stress states that actually exist. In fact, the vast majority of the geostress field in the region is a three-dimensional non-uniform compressive stress field dominated by horizontal stress, with two principal stress directions approximately horizontal (σH and σh) An approximate vertical (σv) It can be divided into three types and four types of geostress: the maximum principal stress direction of Class I geostress is vertical, and σV > σH > σh. The minimum principal stress direction of Class II ground stress is vertical, and σH > σh > σv. The middle principal stress direction of Class III geostress is vertical, and σH > σv> σh. Type I geostress can be further divided into two types: type Ia geostress and type Ib geostress σv > σH > σ h > 0; Type Ib geostress σv > 0, σH or σh has a value less than zero or both. Therefore, Type Ia, Type II, and Type III geostress are in a triaxial compressive geostress state, while Type Ib geostress is in a geostress state with tensile stress present.
When the local stress type is type Ia, type II, or type III ground stress, the rock is in a three-dimensional compressive stress state, and the fracture of the rock is mainly shear and compressive shear. The Coulomb Mohr fracture criterion can be used as the fracture criterion. If the minimum principal stress σ If σ3 is known, the minimum value of the maximum principal stress for rock fracture is:
The shear failure rate σP is the stress on the fracture surface (σp) The shear strength of the rock, i.e., the ability to resist failure under shear [σp] The ratio of is usually taken as a positive value, and its expression is:
When the local stress type is type Ib, if there is tensile stress on the protruding side of the rock layer under longitudinal bending folding and the overall rock layer under transverse bending, the rock fracture is mainly tensile fracture and shear fracture. The Coulomb Moore criterion is no longer applicable, and the Griffith criterion is used for fracture judgment. It can be used to determine whether rocks undergo irreversible deformation and tensile fracture when subjected to external stress. The mathematical expression is as follows:
The tensile fracture rate T is the ratio of the stress on the fracture surface and tensile strength of the rock, i.e., the ability to resist failure under tension [(σt)], shear stress refers to the force under shear, usually taken as a positive value, and its expression is:
The tensile fracture rate T is the ratio of the stress (σt) on the fracture surface to the tensile strength of the rock [(σt)], which is the resistance to failure under tension. Shear stress refers to the force when subjected to shear, usually taken as a positive value, and its expression is:
The fracture coefficients P and T of tension and shear can qualitatively characterize the degree of fracture development. When a rock layer ruptures, the degree of fracture is positively correlated with the fracture coefficient. In this fracture simulation, the relative size of the fracture rate is used as the “relative fracture density” to qualitatively describe the distribution of fractures.
5.2 Comprehensive evaluation of reservoir fracture development
Based on the results of numerical simulation of ancient stress, a comprehensive evaluation was conducted on the distribution of relative density of the study layers in each work area (Figures 10, 11). In general, the distribution of the relative density corresponds to, or differs from, the distribution of the differential pressure, and is generally governed by the mechanical properties of the rock within the attribute cell, and also by the relative position of the attribute cell. In areas with high sand content, the relative density of fractures is high. The fracture zone has continuity and is distributed in strips whose extension direction is parallel to the direction of maximum principal stress. Plane heterogeneities due to fractures in the studied regions were found sequentially from top to bottom in the Huangjialing Chang 8 layer and the Xiasiwan Chang 7 layer.
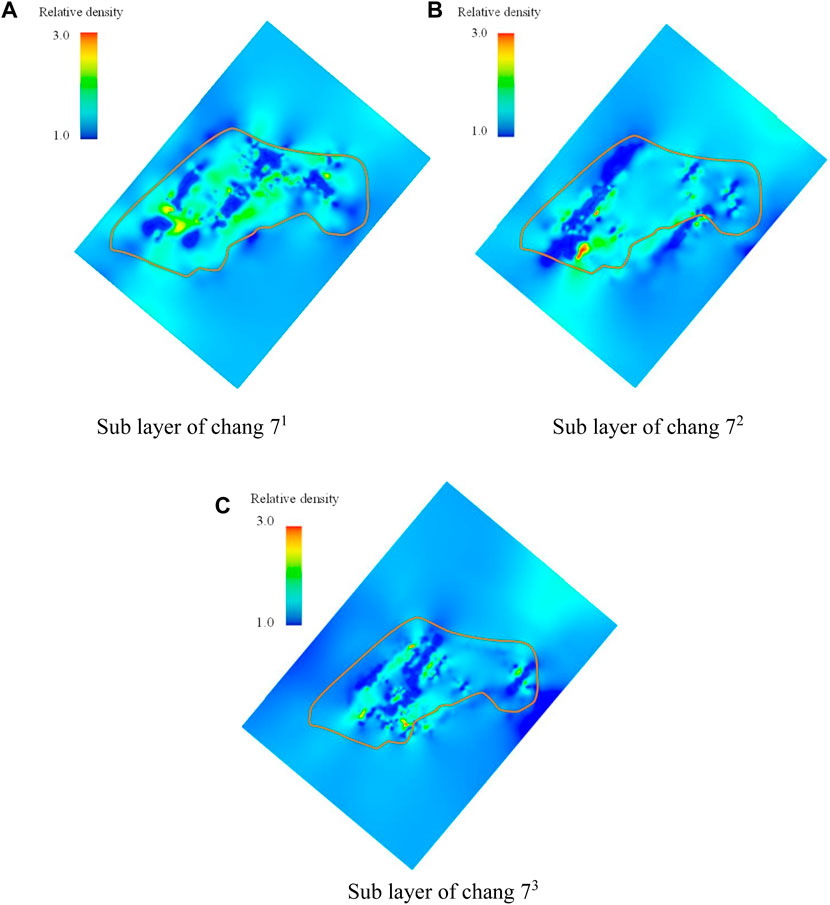
FIGURE 10. Distribution of relative density of fractures in various small layers of Xiasiwan Chang 7. (A) Sub layer of chang 71 (B) Sub layer of chang 72 (C) Sub layer of chang 73.
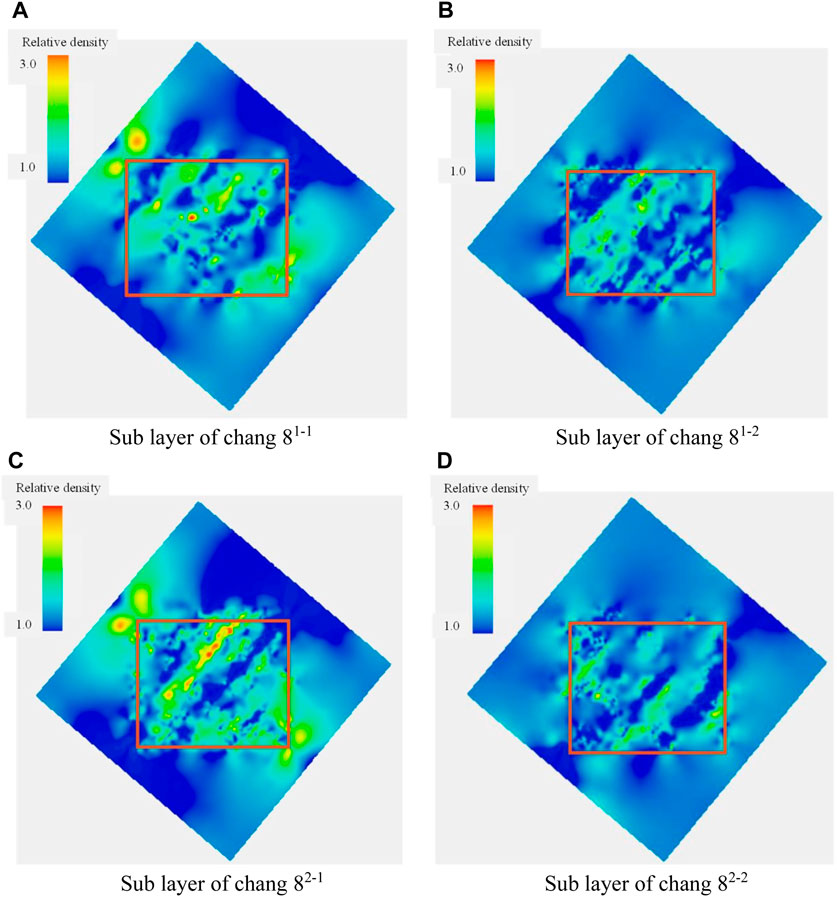
FIGURE 11. Distribution of relative density of fracks in each sub layer of Chang 8 in Huangjialing. (A) Sub layer of chang 81–1 (B) Sub layer of chang 81–2. (C) Sub layer of chang 82–1 (D) Sub layer of chang 82–2.
In terms of comparison between research areas, by observing the relative density of fractures in each work area, it can be found that the distribution of fractures in the Xiasiwan Chang 7 oil layer group is the most uniform, while the Huangjialing Chang 8 oil layer group is more uniform.
6 Conclusion
(1) The maximum principal stress, minimum principal stress, and vertical stress of the study block during the most intense geological activity and fracture formation period were 94.67 MPa, 21.58 MPa, and 28.07 MPa, respectively. During this period, there is a slight change in the direction of the principal stress within a single work area, while the overall direction remains the same. The direction of maximum principal stress remains essentially in the NE-SW direction.
(2) The numerical simulation of stress field shows that due to the absence of faults and relatively simple structure, during the Indosinian period, the ancient stress direction of the Chang 7 and Chang 8 oil layers remained generally unchanged, and the maximum principal stress direction remained basically in the NE-SW direction. In particular, however, within small layers, the direction of the paleostress varies slightly in different blocks and layers around the NE-SW direction due to changes in the mechanical properties of the rock.
(3) During the Indosinian period, the differential stress of the ancient stress field between the Chang 7 and Chang 8 oil layers gradually increased with the deepening of the layer depth, and the overall difference was not significant. The maximum differential stress occurs in the Chang 8 oil layer in Huangjialing. In contrast to the other work zones, the differential stress is most uniform in the Chang 7 oil layer group at Xiasiwan. The distribution of differential stresses is controlled by a variety of factors, among which the mechanical properties of the rock and the direction of the principal stress have a significant influence. In regions with low Poisson ratio and high Young’s modulus, the differential stress is generally higher. The distribution of the differential stress has continuity and is distributed in strips whose extension direction is parallel to the direction of maximum principal stress.
(4) The distribution of relative density and differential pressure of natural fractures in the Chang 7 and Chang 8 oil layers in the study area are influenced by the dual effects of rock mechanical properties and the relative position of mechanical units. Based on the mechanical analysis, it can be concluded that the planar heterogeneity due to fractures in the studied regions is from high to low in the Huangjialing Chang 8 layer group and the Xiasiwan Chang 7 layer group, respectively.
Data availability statement
The raw data supporting the conclusion of this article will be made available by the authors, without undue reservation.
Author contributions
LL: Conceptualization, Data curation, Investigation, Methodology, Writing–original draft, Writing–review and editing. MW: Data curation, Formal Analysis, Methodology, Project administration, Supervision, Writing–original draft. YW: Methodology, Project administration, Supervision, Validation, Writing–original draft. YG: Investigation, Methodology, Supervision, Visualization, Writing–original draft. SL: Writing–original draft, Writing–review and editing.
Funding
The author(s) declare financial support was received for the research, authorship, and/or publication of this article. This work was supported by the National Natural Science Foundation of China: Study of the dynamic characteristics of methane/carbon dioxide in shale heterogeneous reservoirs under multi-field coupling (Program No. 41772150).
Acknowledgments
The authors are grateful for the support of the Shaanxi Yanchang Petroleum (Group) Co., Ltd.
Conflict of interest
Authors LL and YG were employed by Shaanxi Yanchang Petroleum (Group) Co., Ltd. Author YW was employed by Changqing Downhole Technology Operation Company of Chuanqing Drilling Engineering Co., Ltd. Author SL was employed by Engineering Research Institute of PetroChina Southwest Oil and Gas Field Company.
The remaining author declares that the research was conducted in the absence of any commercial or financial relationships that could be construed as a potential conflict of interest.
Publisher’s note
All claims expressed in this article are solely those of the authors and do not necessarily represent those of their affiliated organizations, or those of the publisher, the editors and the reviewers. Any product that may be evaluated in this article, or claim that may be made by its manufacturer, is not guaranteed or endorsed by the publisher.
References
Ding, W. L., Zeng, W. T., Wang, R. Y., et al. (2016). Method and application of tectonic stress field simulation and fracture distribution prediction in shale reservoir. Earth Sci. Front. 23 (2), 63–74. doi:10.13745/j.esf.2016.02.008
Feng, J., Shi, S., Zhou, Z., Li, X., and Luo, P. (2019). Characterizing the influence of interlayers on the development and distribution of fractures in deep tight sandstones using finite element method. J. Struct. Geol. 123, 81–95. doi:10.1016/j.jsg.2019.03.009
Gong, L., Su, X., Gao, S., Fu, X., Jabbari, H., Liu, B., et al. (2019). Characteristics and formation mechanism of natural fractures in the tight gas sandstones of Jiulongshan gas field, China. J. Petroleum Sci. Eng. 175, 1112–1121. doi:10.1016/j.petrol.2019.01.021
Guo, P., Yao, L., and Ren, D. (2016). Simulation of three-dimensional tectonic stress fields and quantitative prediction of tectonic fracture within the Damintun Depression, Liaohe Basin, northeast China. J. Struct. Geol. 86, 211–223. doi:10.1016/j.jsg.2016.03.007
Haimson, B. C., and Herrick, C. G. (1985). In-situ stress evaluation from borehole breakouts: experimental studies. Proc. 26th U. S. Symposium Rock Mech., 1207–1218.
Hu, L. (2022). A review of mechanical mechanism and prediction of natural fracture in shale. Arabian J. Geosciences 15 (6), 474. doi:10.1007/s12517-022-09786-w
Hu, Z. S., Peng, D. J., and Dai, D. S. (1994). Numerical simulation of fault stress and fracture distribution within Lower Permian local structures in southern Sichuan. Xinjiang Pet. Geol. 15 (2), 158–162.
Huang, L., He, R., Yang, Z., Tan, P., Chen, W., Li, X., et al. (2023). Exploring hydraulic fracture behavior in glutenite formation with strong heterogeneity and variable lithology based on DEM simulation. Eng. Fract. Mech. 278, 109020. doi:10.1016/j.engfracmech.2022.109020
Huang, L., Liu, J., Zhang, F., Dontsov, E., and Damjanac, B. (2019). Exploring the influence of rock inherent heterogeneity and grain size on hydraulic fracturing using discrete element modeling. Int. J. Solids Struct. 176, 207–220. doi:10.1016/j.ijsolstr.2019.06.018
Jaeger, J. C., Cook, N. G. W. W., and Zimmerman, R. W. (2007). Fundamentals of rock mechanics. Malden, MA, USA: Blackwell Publishing Ltd.
Khair, H. A., Cooke, D., and Hand, M. (2015). Paleo stress contribution to fault and natural fracture distribution in the Cooper Basin. J. Struct. Geol. 79, 31–41. doi:10.1016/j.jsg.2015.07.007
Li, H. (2021). Quantitative prediction of complex tectonic fractures in the tight sandstone reservoirs: a fractal method. Arabian J. Geosciences 14, 1986–2016. doi:10.1007/s12517-021-08344-0
Li, H., Lin, C. Y., Ren, L. H., Zhang, G. Y., Chang, L. J., and Dong, C. M. (2021). Quantitative prediction of multi-period tectonic fractures based on integrated geological-geophysical and geomechanics data in deep carbonate reservoirs of Halahatang oilfield in northern Tarim Basin. Mar. Petroleum Geol. 134, 105377. doi:10.1016/j.marpetgeo.2021.105377
Li, Z. M., and Zhang, J. Z. (1997). Ground stress and oil and gas exploration and development. Beijing, China: Petroleum Industry Press, 138–140.
Liu, S., Feng, J., Osafo, J. A., Li, G., and Li, G. (2023). Quantitative prediction of multistage fractures of ultra-deep tight sandstone based on the theory of minimum energy dissipation. Front. Earth Sci. 10, 1036493. doi:10.3389/feart.2022.1036493
Lou, Y., Wu, Z., Sun, W., Yin, S., Wang, A., Liu, H., et al. (2020). Study on failure models and fractal characteristics of shale under seepage-stress coupling. Energy Sci. Eng. 8 (5), 1634–1649. doi:10.1002/ese3.621
Murray, G. H. (1977). Quantitative fracture study—sanish pool, mckenzie county, north Dakota. AAPG Bull. 52 (1), 57–65. doi:10.1306/5D25C293-16C1-11D7-8645000102C1865D
Peska, P., and Zoback, M. D. (1995). Compressive and tensile failure of inclined well bores and determination of in situ stress and rock strength. J. Geophys. Res. Solid Earth 100 (B7), 12791–12811. doi:10.1029/95JB00319
Qin, Q. R., Zhang, L. H., Deng, H., Su, P. D., and Wang, Z. Y. (2004). Determination of magnitude of palaeo-tectonic stress and application to tectonic geological modeling. Chin. J. Rock Mech. Eng. 23 (23), 3979–3983.
Ren, Q. Q., Jin, Q., Feng, J. W., and Li, M. P. (2019). Simulation of stress fields and quantitative prediction of fractures distribution in upper Ordovician biological limestone formation within Hetianhe field, Tarim Basin, NW China. J. Petroleum Sci. Eng. 173, 1236–1253. doi:10.1016/j.petrol.2018.10.081
Rouchet, J. D. (1981). Stress fields, a key to oil migration. AAPG Bull. 65 (1), 74–85. doi:10.1306/2f919774-16ce-11d7-8645000102c1865d
Song, H. Z., Jia, C. z., Ou, Y. J., et al. (2001). Theory and methods of fractured reservoir research. Beijing, China: Petroleum Industry Press, 288–304.
Tan, P., Fu, S. H., Chen, Z. W., and Zhao, Q. (2023). Experimental investigation on fracture growth for integrated hydraulic fracturing in multiple gas bearing formations. Geoenergy Sci. Eng. 231, 212316. doi:10.1016/j.geoen.2023.212316
Tan, P., Jin, Y., Pang, H. W., et al. (2021). Hydraulic fracture vertical propagation behavior in transversely isotropic layered shale formation with transition zone using XFEM-based CZM method. Eng. Fract. Mech. 248, 107707. doi:10.1016/j.engfracmech.2021.107707
Tan, P., Pang, H. W., Zhang, R. X., Jin, Y., Zhou, Y., Kao, J., et al. (2020). Experimental investigation into hydraulic fracture geometry and proppant migration characteristics for southeastern Sichuan deep shale reservoirs. J. Petroleum Sci. Eng. 184, 106517. doi:10.1016/j.petrol.2019.106517
Wang, S., Li, H., Lin, L., and Yin, S. (2022). Development characteristics and finite element simulation of fractures in tight oil sandstone reservoirs of Yanchang formation in western Ordos basin. Front. Earth Sci. 9, 823855. doi:10.3389/feart.2021.823855
Wang, X. S., Li, J. C., Wang, S. M., and Song, H. Z. (1997). Oil and gas accumulation and structural stress field in Tarim basin. Acta Pet. Sin. 18 (1), 23–27. doi:10.7623/syxb199701004
Wang, Y. (2013). Research on prediction methods and applications of fractured oil and gas reservoirs. Wuhan, China: China University of Geosciences.
Wei, J., and Sun, W. (2016). Tectonic fractures in the lower cretaceous Xiagou formation of Qingxi oilfield, Jiuxi Basin, NW China part one: characteristics and controlling factors. J. Petroleum Sci. Eng. 146, 617–625. doi:10.1016/j.petrol.2016.07.042
Wu, Y., Liu, C., Zang, Q., Awan, R. S., Li, G., Wu, Y., et al. (2022a). Simulation of tectonic stress field and prediction of tectonic fractures in shale reservoirs: a case study of the Ansai area in the Ordos Basin, China. Interpretation 10 (3), SJ15–SJ28. doi:10.1190/INT-2021-0181.1
Wu, Z., Tang, M., Zuo, Y., Lou, Y., Wang, W., Liu, H., et al. (2022b). Acoustic emission-based numerical simulation of tectonic stress field for tectoclase prediction in shale reservoirs of the northern Guizhou area, China. Energy Geosci. 3 (4), 436–443. doi:10.1016/j.engeos.2021.10.005
Wu, Z., Zuo, Y., Wang, S., Chen, J., Wang, A., Liu, L., et al. (2017). Numerical study of multi-period palaeotectonic stress fields in lower cambrian shale reservoirs and the prediction of fractures distribution: a case study of the Niutitang formation in Feng'gang No. 3 block, South China. Mar. Petroleum Geol. 80, 369–381. doi:10.1016/j.marpetgeo.2016.12.008
Xu, Y. F., Zuo, Y. J., Wu, Z. H., and Sun, W. J. B. (2017). Numerical simulation of tectonic stress field and fracture prediction of Yanshan period in Fenggang area. Coal Technol. 36 (7), 128–130.
Zhang, D., Tang, J., Chen, K., Wang, K., Zhang, P., He, G., et al. (2022a). Simulation of tectonic stress field and prediction of tectonic fracture distribution in Longmaxi Formation in Lintanchang area of eastern Sichuan Basin. Front. Earth Sci. 10, 1024748. doi:10.3389/feart.2022.1024748
Zhang, H., Xu, G., Zhan, H., Li, X., and He, J. (2022b). Simulation of multi-period paleotectonic stress fields and distribution prediction of natural Ordovician fractures in the Huainan coalfield, Northern China. J. Hydrology 612, 128291. doi:10.1016/j.jhydrol.2022.128291
Zoback, M. D., Moos, D., Mastin, L., and Anderson, R. N. (1985). Wellbore breakouts and in situ stress. J. Geophys. Res. Solid Earth 90 (B7), 5523–5530. doi:10.1029/JB090iB07p05523
Keywords: fractured oil and gas reservoirs, natural fracture, paleotectonic stress, rock mechanics, finite element simulation, fracture development pattern
Citation: Lin L, Wang M, Wang Y, Gao Y and Li S (2023) Prediction of natural fracture distribution characteristics in tight oil and gas reservoirs based on paleotectonic stress field. Front. Energy Res. 11:1324934. doi: 10.3389/fenrg.2023.1324934
Received: 20 October 2023; Accepted: 13 November 2023;
Published: 24 November 2023.
Edited by:
Peng Tan, CNPC Engineering Technology R & D Company Limited, ChinaReviewed by:
Yongpeng Sun, China University of Petroleum (East China), ChinaJiajia Bai, Changzhou University, China
Copyright © 2023 Lin, Wang, Wang, Gao and Li. This is an open-access article distributed under the terms of the Creative Commons Attribution License (CC BY). The use, distribution or reproduction in other forums is permitted, provided the original author(s) and the copyright owner(s) are credited and that the original publication in this journal is cited, in accordance with accepted academic practice. No use, distribution or reproduction is permitted which does not comply with these terms.
*Correspondence: Mingwei Wang, dG91Z2Fvemhvbmd3ZW5AMTYzLmNvbQ==