 Jinyuan Zeng
 Yulong Mao
- China Guangdong Nuclear Research Institute Co., Ltd., Shenzhen, China
The flow distribution characteristics at core inlet directly determines the thermal and hydraulic characteristics in the core, and it is closely related to the safety of nuclear reactor. The primary coolant is subjected to additional inertial force in ocean motion, which influence the flow distribution characteristics at core inlet. In the present paper, numerical simulation method is adopted to analyze the coolant flow distribution characteristics at core inlet of the Reactor Pressure Vessel (RPV) of a Small Reactor under rolling condition. Then the results of the flow distribution characteristics were compared with those under steady state. The results show the variation range of flow distribution factors in each channel under rolling condition is within 5%. And the uneven distribution of coolant at the core inlet increases with the increase of rolling amplitude, and decrease with the rolling period in short period. Standard deviation of flow distribution factor at the core inlet changes little under rolling condition, which indicates the flow distribution at the core inlet keeps good uniformity.
1 Introduction
With the increasing maturity of nuclear energy technology, the research and application of nuclear power plants under ocean conditions have garnered significant attention. However, the motion generated under ocean conditions can exert additional forces on the primary and secondary coolant loops, posing challenges to the reliability and safety of nuclear reactors. Proper allocation of coolant flow distribution at core inlet under ocean conditions can optimize nuclear fuel utilization efficiency, balance the temperature distribution within the core, and prevent avoid accidents or malfunctions caused by fuel assembly overheating or inadequate core cooling (Jeong et al., 2005).
The flow heat transfer characteristics of the core under the influence of oceanic conditions can be obtained by system analysis program (Kim and Park, 1996; Kim et al., 2001; Li et al., 2015; Li et al., 2020; Mesina et al., 2016; Tan et al., 2009; Wu et al., 2016; Yan and Yu, 2011c.). However, many of these studies focus on the overall natural circulation capability of nuclear reactors, and the calculation process mainly adopts one-dimensional flow, which is unable to obtain the specific flow distribution inside the lower plenum under ocean conditions. Consequently, research on the hydraulic behavior of nuclear reactors under ocean conditions has shifted towards using Computational Fluid Dynamics (CFD) software. The CFD analysis for the thermal hydraulic behavior under rolling motion also mostly focus con natural circulation, and is mainly about the single channel (such as tube, rectangular channel and rod bundle) and complex channel includes reactor pressure vessel (Yan et al., 2017; Tian et al., 2019). XJTU-NuTheL team put forward the dynamic mesh method to analysis the influence of ocean conditions (Chen et al., 2019). The research shows that it is equivalent to the momentum source term method (Yan et al., 2011d; Wei et al., 2011), but this method is simpler to apply. Both Li et al. (2013) and Yan et al. (2011a) reveal that the Nusselt number and frictional resistance coefficient oscillate periodically with relative amplitude less than 10% in a narrow rectangular channel under rolling motion. Yan et al. (2010a; 2010b; 2011a; 2011b; 2012a; 2012b) used CFD software to conduct a systematic analog study on the natural circulation flow of the core under ocean conditions. Firstly, they analyzed the turbulent flow and heat transfer characteristics in a narrow rectangular channel under rolling motion, the results indicates that both k-ε and k-ω turbulence models were suitable for CFD simulation under rolling motion, and the rolling motion would make turbulent velocity more uniform (Yan et al., 2010a). Then, the hydraulic behavior in typical 4 and 7 fuel bundles under ocean conditions are analyzed by CFD methods, it is found that rolling motion will affect the coolant flow and heat transfer characteristics between rods in the channel and the influence is different between two typical channel (Yan et al., 2010b; 2011b). Finally, they analyzed the flow distribution at the core inlet under rolling motion with CFX 12.0. Their results revealed that the effect of rolling motion on flow distribution and hydraulic behavior was not regular due to the complex structure (2012a; 2012b), and Li et al. (2013) also found a similar phenomenon.
To investigate the effects of rolling conditions on flow distribution characteristics at core inlet during forced circulation at full power operation, the Reynolds-averaged Navier-Stokes method is adopted for numerical simulation of the coolant distribution at core inlet of a small pressurized water reactor under both steady state and rolling conditions. Furthermore, the impacts of varying rolling amplitudes and periods on flow distribution at core inlet were compared.
2 Geometric model and numerical simulation method
2.1 Geometric model
The Reactor Pressure Vessel (RPV) is a sealed container that houses the reactor core and withstands the high-pressure operating environment of the primary coolant loop. A series of improved and optimized designs were carried out on the lower plenum of a certain small pressurized water RPV, simplifying the internal structure of the lower plenum. An annular flow distribution plate is installed within the lower plenum to enhance flow characteristics, ensuring a relatively uniform distribution of coolant before passing through the core flow distribution plate. The coolant enters the pressure vessel through the cold leg and then passes through from the descent segment comprised of the RPV and reactor core barrel to the lower plenum which includes the lower head, annular flow distribution plate, and core flow distribution orifices. The overall geometric model of the RPV is depicted in Figure 1.

FIGURE 1. Schematic diagram of RPV global geometric model.
2.2 Mathematical model and numerical simulation method
2.2.1 Rolling motion model
RPV oscillates according to the simple harmonic motion law, and its parameters such as angular displacement, angular velocity and angular acceleration change with time as follows:
The rolling motion model used in the study is based on the rigid motion model. In the rigid motion model, an acceleration term resulting from additional inertial forces is added to the momentum equation. In terms of grid motion, the grid velocity
Where t is time, V is volume, a is the face vector,
Where p is pressure, T is the viscous stress tensor,
Where E is total energy, H is total enthalpy, and
2.2.2 Boundary conditions and porous media model
In the calculation process, a mass-flow-inlet boundary condition is applied at the RPV inlet, with corresponding inlet turbulence intensity and viscosity ratio settings. Both pressure outlets are set to operating pressures, and the temperature boundary condition at the outlets is set using the field function. The Realizable k-epsilon turbulence model is used, along with the two-layer-all y+ wall treatment method.
The core is simplified by using porous media model, and the flow resistance model represented by Forchheimer (1901) is mostly adopted:
Where
Ergun (1952) modified the Forchheimer equation based on a large number of particle-filled bed experiments and then obtained the Ergun equation:
Where A is the dimensionless coefficient for the viscous term, B is the dimensionless coefficient for the inertial term, ε is the material porosity,
3 Numerical simulation method validation and verification
3.1 Validation of steady-state model and grids independence
Due to the complexity of the flow region within the RPV, the polyhedral meshes which allowing for better geometric adaptation was used for simulation. Four different grid refinement schemes were applied to the RPV, resulting in grids sizes of 2.39 million, 3.56 million, 5.98 million, and 9.68 million.
The flow path of the coolant within the RPV was divided into four segments: Segment I is from the RPV inlet to the lower plenum inlet, Segment II from the lower plenum to the core inlet, Segment III is from the core inlet to the core outlet, and Segment IV is from the core outlet to the RPV outlet. The percentage of resistance Fi in each section of RPV to the total resistance F calculated by 9.68 million grids is obtained by steady-state calculation, and the results is shown in Table 1. The resistance for each segment was obtained by subtracting the segment’s gravitational pressure drop from the average absolute pressure values across its cross sections. The variation in each segment’s resistance remained below 3% after reaching 3.56 million grids, and with the grids refinement to 5.98 million, better convergence and more stable exit velocity were observed. Considering both calculation speed and accuracy, further calculations were carried out using the 5.98 million grids.

TABLE 1. Validation of grids independence.
For the core inlet channels, the mass flow rates were normalized into flow distribution factors qi, defined as the ratio of the mass flow rate Qi in a specific channel to the average mass flow rate Qavg across all channels.
The standard deviation of the flow distribution factors can be used to quantitatively analyze the uniformity of coolant flow distribution at core inlet. The formula for the standard deviation is:
Where σ is the standard deviation of the flow distribution factors, xi represents the flow distribution factor for each channel, and
The normalized flow distribution factor gained from the steady-state calculation results with 5.98 million grids was compared with experimental data, as shown in Table 2. The discrepancies between the steady-state calculation results and experimental data for all channels were below 3%, demonstrating the accuracy of the numerical simulation method employed. The standard deviation of the steady-state flow distribution factors was calculated to be σ = 0.02892, indicating small flow deviations among the channels.
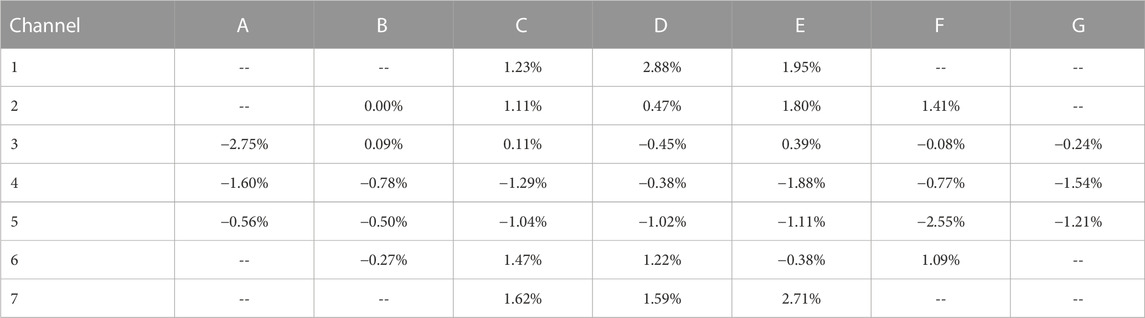
TABLE 2. The error value of flow distribution factor of calculation compared with experiment.
3.2 Validation of the rolling motion model
3.2.1 Single-phase water flow experiment in a vertically rolling pipe
To validate the accuracy of the CFD model in simulating coolant flow characteristics under ocean conditions, an experiment was conducted involving single-phase water flow in a vertically rolling pipe. The relative layout of the experimental setup is illustrated in Figure 2. The setup includes a rolling platform, a test section, a circulation water tank, a storage tank, and a measurement system. The test section comprises a smooth stainless steel pipe with an inner diameter of 16 mm and a length of 3.4 m. In the experiment, the fluid is pumped from the circulation water tank and flows upward through the vertical pipe, then passes through bends and horizontal sections before entering the storage tank. The bottom of the storage tank is connected to the circulation water tank, and after the experiment, the water from the storage tank is discharged into the circulation water tank.
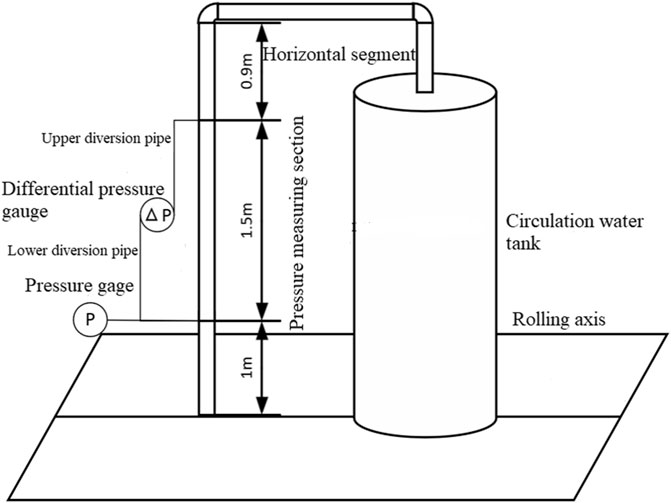
FIGURE 2. Schematic diagram of rolling experiment bench.
3.2.2 Analysis of numerical simulation results
A CFD geometric model was created in proportion to the experimental setup, and numerical simulations were conducted for different flow rates with a rolling angle of 20° and a rolling period of 10 s. These numerical simulation scenarios were then compared to the corresponding experimental conditions.
Figure 3 shows the comparison between simulated and experimental friction pressure drops at flow rates of 1.1 m3/h and 2.5 m3/h, with average percentage errors of 7.16% and 7.51%. Figure 4 presents the comparison of simulated and experimental measuring point pressure at flow rates of 1.1 m3/h and 2.5 m3/h. In terms of the pressure at the inlet point A in the measurement section, the simulated values exhibit smaller errors compared to friction pressure drops, with average errors of 0.91% and 7.3% at flow rates of 1.1 m3/h and 2.5 m3/h. These results demonstrate that the adopted rolling motion model can effectively simulate the flow process within the pipe under rolling conditions.
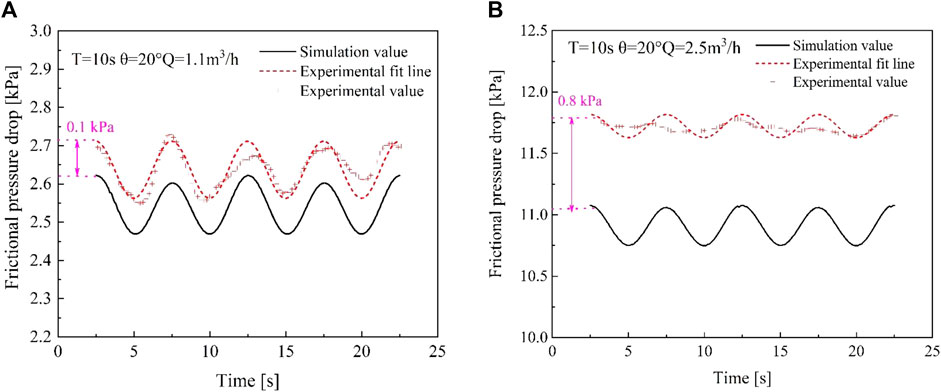
FIGURE 3. The comparison of friction pressure drop: (A) 1.1 m3/h. (B) 2.5 m3/h.
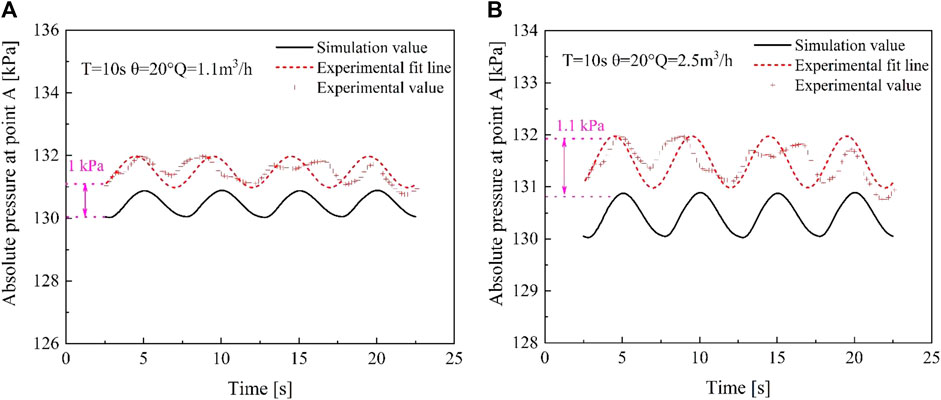
FIGURE 4. The comparison of inlet pressure value of pressure measuring section: (A) 1.1 m3/h. (B) 2.5 m3/h.
4 Rolling condition results
4.1 Flow distribution characteristics at core inlet under rolling conditions
A simulation was conducted for RPV with a rolling angle of 22.5° and rolling period of 7 s. The schematic diagram of the rolling motion is shown in Figure 5, where the rolling axis is aligned with the bow-stern direction. In the first half of the period, RPV rolls to starboard side, followed by port side in the second half.
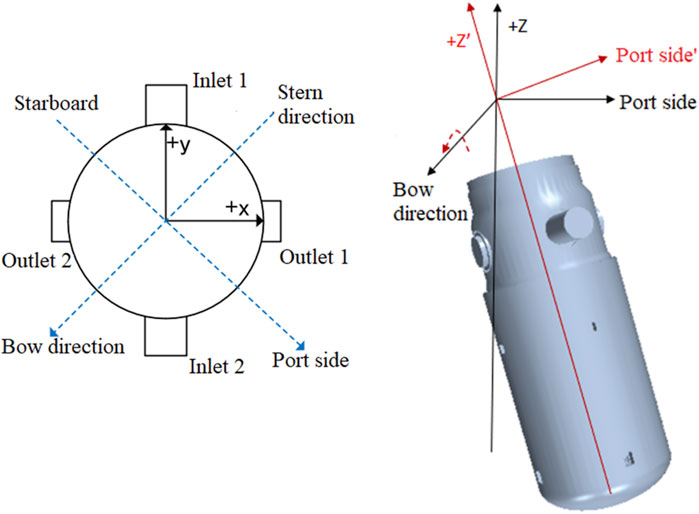
FIGURE 5. Schematic diagram of rolling motion.
Figure 6 depicts the pressure contours at 1.75 s when RPV achieves the maximum starboard-side rolling angle, and at t = 5.25 s when RPV reaches the maximum port-side rolling angle. It is evident that the pressure increases in the direction of rolling during the rolling process. Figure 7 displays the velocity vectors in the lower plenum at 1.75s when RPV achieves the maximum starboard-side rolling angle. This illustrates that the uniformity of flow distribution at the core inlet is maintained well during the rolling process. Flow distribution factor curves for channels B2 and F6 which symmetrically distributed about the rolling axis, as well as edge channels F4 and G4, are plotted against time in Figure 9. The position of channel B2, A4, G4 and F6 is shown in Figure 8, and the reason for choosing these channels is that the rolling impact is relatively large on them. Under rolling conditions, the flow distribution factor curves of various channels exhibit periodic variations resembling sine or cosine functions. Notably, the curves of B2 and F6 show opposite phase differences on either side of the oscillation axis. Compared with steady-state results, the variations of flow distribution factors for all channels remain within ±5% (comparable to the flow distribution factor variation of channel F6, which exhibits the largest deviation), indicating that the impact of rolling conditions on flow distribution at core inlet is relatively minor.
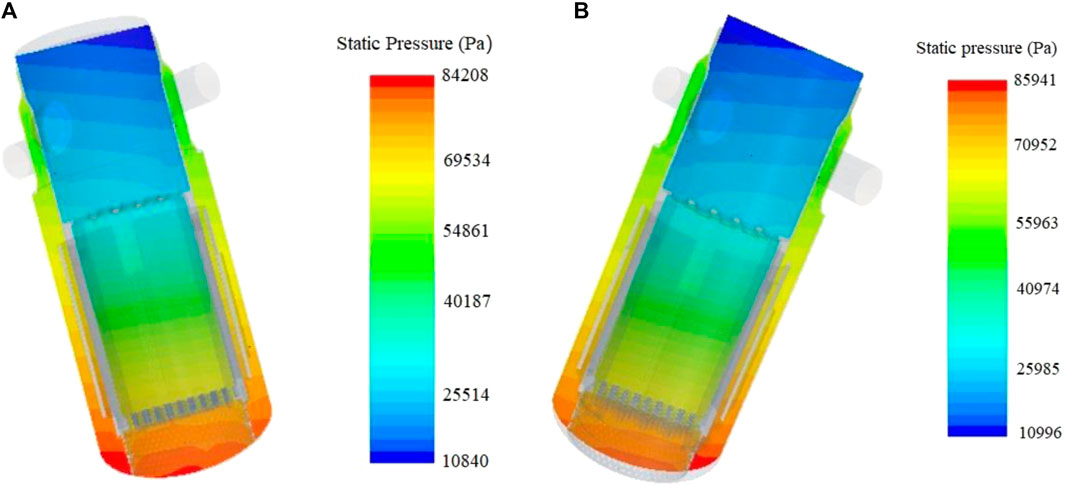
FIGURE 6. Cross-sectional pressure field of RPV in rolling direction: (A) 1.75 s. (B) 5.25 s.
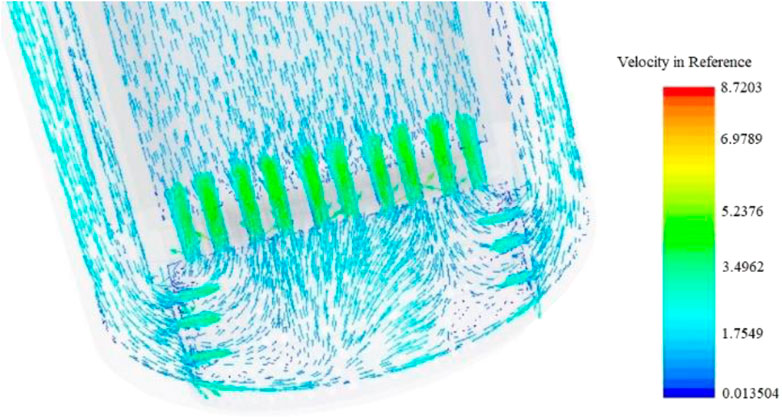
FIGURE 7. Velocity vector diagram of port and starboard side cross-section when RPV rolling to starboard side.
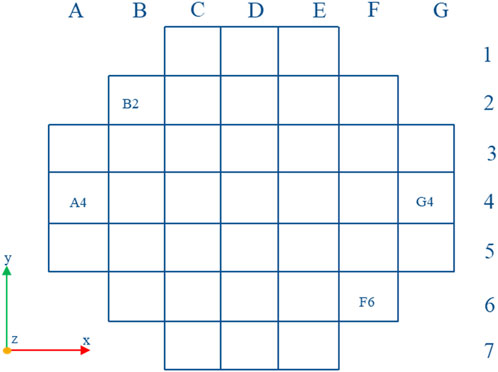
FIGURE 8. Position diagram of channel B2, A4, G4 and F6.
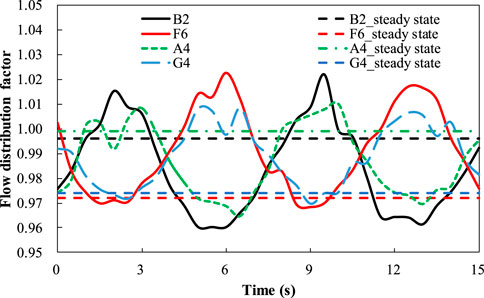
FIGURE 9. Variation of flow distribution factor of typical channel with time under rolling condition.
4.2 Influence of rolling amplitude on flow distribution
Maintaining a rolling period of 7 s, different rolling angles were set at 5°, 9°, 13°, 18°, and 22.5°. Figure 10 illustrates the time-varying curves of the flow distribution factor for channel B2 under different rolling angles. The amplitude of flow distribution factor variation increases with increasing rolling angle. Channels B2, C3, D4, E5, and F6 (their position is shown in Figure 11), symmetrically distributed about the rolling axis, were selected to plot flow distribution factor curves under different rolling angles at 1.75 s and 5.25 s, as shown in Figure 12. Channels B2, C3, D4, E5, and F6 correspond to horizontal axis channel numbers 1, 2, 3, 4, and 5. At 1.75 s, when RPV rolls to the starboard side, the flow distribution factors of channels D4, E5, and F6 those located near the right roll are reduced to varying degrees compared with steady-state results. And the C3 channel has the largest flow distribution factor variation range as the minimum flow distribution factor is 0.994 at 22.5° and maximum 1.034 which is only 4% larger than 0.994. Similarly, at 5.25 s when RPV rolls to the port side, the flow distribution factors of channels B2, C3, and D4 those situated near the left roll, experience different degrees of reduction compared to steady-state results. This is attributed to the obstructive effect of additional forces on fluid in the rolling direction under rolling conditions. And the D4 channel has the largest flow distribution factor variation range as the minimum flow distribution factor is 0.985 at 7° and maximum 1.029 which is only 4.5% larger than 0.994. For both two time points, the amplitude of flow distribution factor variation in most channels increases with increasing rolling angle. However, there is no evident regularity in the variation of flow distribution factor for certain local channels with rolling angle. Figure 13 illustrates the standard deviation of flow distribution factor under different rolling angles reveals differences under different rolling angles. Generally, as the rolling angle increases, the flow distribution at core inlet becomes less uniform. However, compared to steady-state results, the standard deviation change remains within the range of approximately from −0.004 to 0.002, which indicates that the flow distribution at core inlet maintains good uniformity under varying rolling amplitudes.
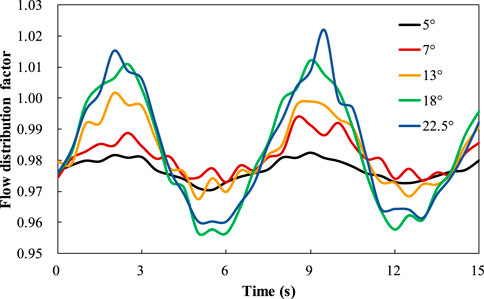
FIGURE 10. Variation of flow distribution factor of channel B2 with time under different rolling amplitudes.
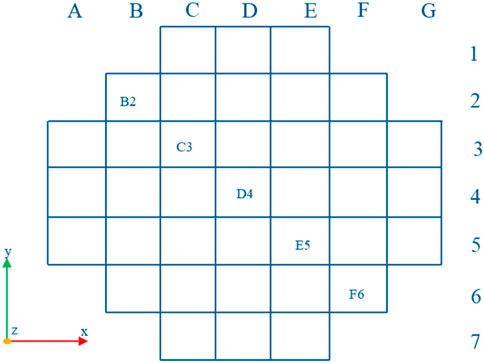
FIGURE 11. Schematic diagram of channel B2, C3, D4, E5 and F6.
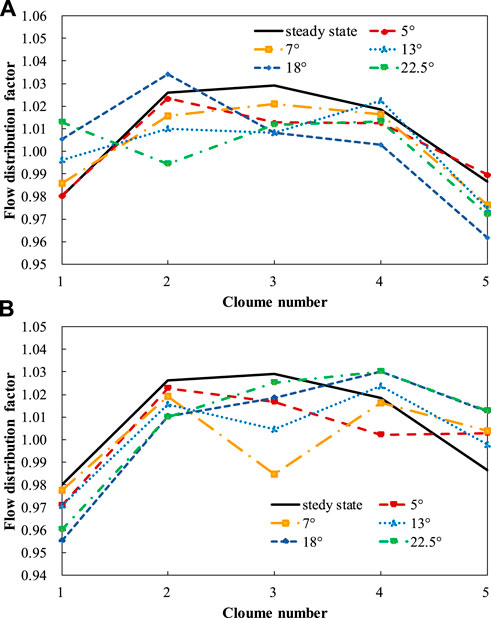
FIGURE 12. Flow distribution factors of typical channels under different rolling amplitude: (A) 1.75 s. (B) 5.25 s.
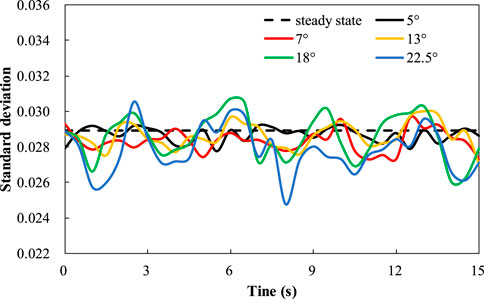
FIGURE 13. Standard deviation of flow distribution factor under different rolling amplitudes.
4.3 Influence of rolling period on flow distribution
Maintaining an oscillation angle of 13°, the rolling periods were set at 5s, 7s, 10s, 13s, and 15s. The relationship between the flow distribution factor for channel B2 and the rolling period is shown in Figure 14. The horizontal axis represents time divided by the rolling period (t/T). Figure 14 indicates that a smaller rolling period leads to greater variations in the flow distribution factor. Figure 15 displays the flow distribution factor curves for channels B2, C3, D4, E5, and F6 under different rolling periods at time points 5 s and 10 s. The C3 channel has the largest flow distribution factor variation range as the minimum flow distribution factor is 0.991 when period is 10 s and maximum 1.021 which is only 3% larger than 0.991 at time 5 s. And The D3 channel has the largest flow distribution factor variation range as the minimum flow distribution factor is 1.004 when period is 5 s and maximum 1.029 which is only 2.5% larger than 1.004 at time 10 s. Due to the varying periods, the position of RPV during rolling differs at 5 s and 10 s, leading to different effects on flow distribution. Despite these differences, the flow distribution factor variations remain within ±5% compared to steady-state results for all periods.
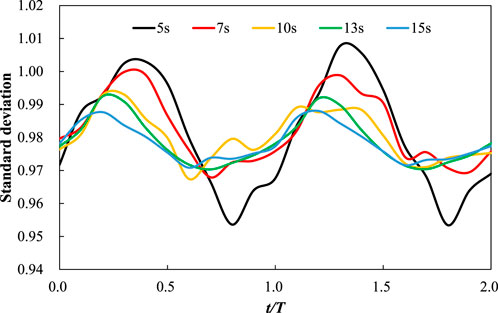
FIGURE 14. Variation of flow distribution factor of channel B2 with time under different rolling periods.
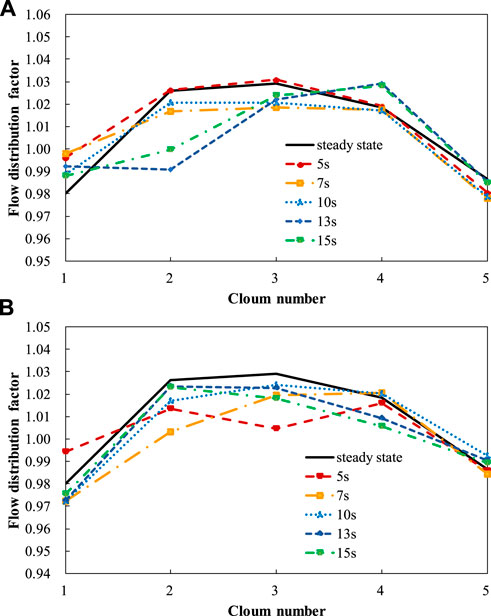
FIGURE 15. Flow distribution factors of typical channels under different rolling periods: (A) 5 s. (B) 10 s.
The standard deviation of the flow distribution factor under different rolling periods is shown in Figure 16. A smaller rolling period results in greater variations in the standard deviation. However, when T ≥ 13 s, the impact of the rolling period on flow distribution becomes minor as the curves for.
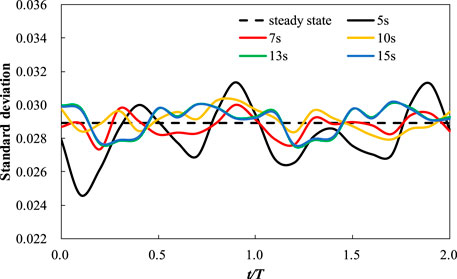
FIGURE 16. Standard deviation of flow distribution factor under different rolling periods.
13 s and 15 s in Figure 16 almost completely overlap. Overall, the standard deviation of the flow distribution factor for different rolling periods undergoes only minor changes compared to steady-state results, with variations ranging from approximately −0.005 to 0.002. This also underscores that the flow distribution at core inlet can maintain good uniformity under various rolling periods.
5 Conclusion
Numerical simulations were conducted to investigate the flow distribution characteristics at core inlet of a small pressurized water reactor RPV under rolling condition by using the rigid motion model. The main conclusions are as follows.
(1) Under rolling conditions, the flow distribution factors of coolant channels in the core exhibit periodic variations resembling sine or cosine functions. Furthermore, channels symmetrically distributed about the rolling axis demonstrate opposite phase differences in flow distribution factors.
(2) The variation amplitude of flow distribution factors for core channels is influenced by both the rolling amplitude and rolling period. Compared to steady-state results, the majority of channel flow distribution factors exhibit increased variation amplitudes with rolling oscillation angle and decreased amplitudes with larger oscillation periods. However, for oscillation periods T ≥ 13s, the influence of the rolling period on flow distribution becomes limited.
(3) Overall, the influence of rolling conditions on flow distribution at core inlet is limited. Compared to steady-state conditions, the variation amplitudes of flow distribution factors for various channels remain within 5%. Additionally, the change of flow distribution factors is minimal, ranging from approximately −0.005 to 0.002. These findings emphasize that the flow distribution at core inlet can still maintain good uniformity under rolling conditions. (Wu et al., 2016).
Data availability statement
The original contributions presented in the study are included in the article/Supplementary material, further inquiries can be directed to the corresponding author.
Author contributions
JZe: Writing–original draft, Writing–review and editing. YM: Conceptualization, Writing–original draft. BL: Data curation, Writing–review and editing. JZh: Writing–review and editing. YH: Writing–review and editing. JC: Writing–review and editing.
Funding
The author(s) declare financial support was received for the research, authorship, and/or publication of this article. This research was funded by Natural Science Foundation of Guangdong Province (grant number 2023A1515012562) and Department of Science and Technology of Guangdong Province (grant number 2017B020242001).
Conflict of interest
Authors JZe, YM, BL, JZh, YH, and JC were employed by China Guangdong Nuclear Research Institute Co., Ltd.
Publisher’s note
All claims expressed in this article are solely those of the authors and do not necessarily represent those of their affiliated organizations, or those of the publisher, the editors and the reviewers. Any product that may be evaluated in this article, or claim that may be made by its manufacturer, is not guaranteed or endorsed by the publisher.
References
Chen, C., Wang, M. J., Zhao, X. H., Ju, H. J., Wang, X., Tian, W. X., et al. (2019). Numerical study on the single bubble rising behaviors under rolling conditions. Nucl. Eng. Des. 349, 183–192. doi:10.1016/j.nucengdes.2019.04.039
Forchheimer, P. (1901). Wasserbewegung durch Boden. Z. Des. Vereins Dtsch. Ingenieure 45, 1782–1788.
Jeong, J., Bae, S. W., Hwang, D. H., Lee, W. J., and Chung, B. D. (2005). Hot channel analysis capability of the best-estimate multi-dimensional system code, MARS 3.0. Nucl. Eng. Technol. 37 (5), 469.
Kim, J. H., and Park, G. C. (1996). Development of RETRAN03/MOV code for thermal hydraulic analysis of nuclear reactor under moving conditions. J. Of Korean Phys. Soc. 28, 542–550.
Kim, J. K., Kim, T. W., Lee, S. M., and Park, J. C. (2001). Study on the natural circulation characteristics of the integral type reactor for vertical and inclined conditions. Nucl. Eng. Des. 207, 21–31. doi:10.1016/s0029-5493(00)00417-9
Li, R., Peng, M., Xia, G., and Sun, L. (2020). The natural circulation flow characteristic of the core in floating nuclear power plant in rolling motion. Ann. Nucl. energy 142 (7), 107385. doi:10.1016/j.anucene.2020.107385
Li, R. J., Dong, X. L., Ma, J., and Huang, Y. P. (2013). Numerical simulation on fluid flow and heat transfer and characteristics of narrow rectangular channel in rolling motion. Nucl. Power Eng. 4, 84–88. doi:10.3969/j.issn.0258-0926.2013.04.018
Li, Z. W., Zhang, X. Y., Chen, H. D., Bai, N., and Li, J. G. (2015). Sub-channel analysis on thermal hydraulic characteristic of PWR under ocean condition. Atomic Energy Sci. Technol. 10, 1758–1765. doi:10.7538/yzk.2015.49.10.1758
Mesina, G. L., Aumiller, D. L., Buschman, F. X., and Kyle, M. R. (2016). Modeling moving systems with RELAP5-3D. Nucl. Sci. Eng. 182, 83–95. doi:10.13182/nse15-3
Tan, C. L., Zhang, H., and Zhao, H. (2009). Development of ocean condition code based on Relap5. Nucl. Power Eng. Des. 30 (6), 53–57. doi:10.1109/CLEOE-EQEC.2009.5194697
Tian, W. X., Wang, M. J., Qiu, H. Z., and Su, G. H. (2019). Review on safety characteristic research progress of nuclear power plant thermal-hydraulics using CFD method. Atomic Energy Sci. Technol. 53 (10), 1968–1982. doi:10.7538/yzk.2019.youxian.0351
Wei, J. H., Pan, L. M., Chen, D. Q., Zhang, H., Xu, J. J., and Huang, Y. P. (2011). Numerical simulation of bubble behaviors in subcooled flow boiling under swing motion. Nucl. Eng. Des. 241 (8), 2898–2908. doi:10.1016/j.nucengdes.2011.05.008
Wu, J., Shan, J. Q., Xiang, X., Zhang, B., Guo, J. L., and Zhang, B. (2016). The development and application of a sub-channel code in ocean environment. Ann. Nucl. energy 95, 12–22. doi:10.1016/j.anucene.2016.04.030
Yan, B. H. (2017). Review of the nuclear reactor thermal hydraulic research in ocean motions. Nucl. Eng. Des. 313, 370–385. doi:10.1016/j.nucengdes.2016.12.041
Yan, B. H., Gu, H. Y., Yang, Y. H., and Yu, L. (2010). Theoretical research on effect of rolling motion turbulent flow. Atomic Energy Sci. Technol. 44 (12), 1451–1456. doi:10.7538/yzk.2010.44.12.1451
Yan, B. H., Gu, H. Y., Yang, Y. H., and Yu, L. (2010). CFD analysis of turbulent flow in typical rod bundles in rolling motion. Appl. Mech. Mater. 29, 716–724. doi:10.4028/www.scientific.net/amm.29-32.716
Yan, B. H., Gu, H. Y., and Yu, L. (2011). Numerical research of turbulent heat transfer in rectangular channels in ocean environment. Heat Mass Transf. 47 (7), 821–831. doi:10.1007/s00231-011-0770-3
Yan, B. H., Gu, H. Y., and Yu, L. (2011). Effect of ocean environment on turbulent heat transfer in lattices. Nucl. Power Eng. 32 (05), 89–95.
Yan, B. H., and Yu, L. (2011). The development and validation of a thermal hydraulic code in rolling motion. Ann. Of Nucl. Energy 38, 1728–1736. doi:10.1016/j.anucene.2011.04.007
Yan, B. H., Yu, L., and Yang, H. Y. (2011). Theoretical model of laminar flow in a channel or tube under ocean conditions. Energy Convers. Manag. 52, 2587–2597. doi:10.1016/j.enconman.2011.01.007
Yan, B. H., Zhang, G., and Gu, H. Y. (2012). Theoretical analysis of the fluid mixing at the core inlet in rolling motion. Nucl. Eng. Des. 242, 134–142. doi:10.1016/j.nucengdes.2011.10.058
Keywords: coolant flow distribution, core inlet, small pressurized water reactor, rolling condition, CFD
Citation: Zeng J, Mao Y, Li B, Zhu J, Hu Y and Chen J (2024) Analysis of coolant flow distribution characteristics at core inlet of small pressurized water reactor under rolling condition. Front. Energy Res. 11:1324187. doi: 10.3389/fenrg.2023.1324187
Received: 19 October 2023; Accepted: 04 December 2023;
Published: 04 January 2024.
Edited by:
Longxiang Zhu, Chongqing University, ChinaReviewed by:
Yuze Sun, Northwestern Polytechnical University, ChinaKui Zhang, Xi’an Jiaotong University, China
Copyright © 2024 Zeng, Mao, Li, Zhu, Hu and Chen. This is an open-access article distributed under the terms of the Creative Commons Attribution License (CC BY). The use, distribution or reproduction in other forums is permitted, provided the original author(s) and the copyright owner(s) are credited and that the original publication in this journal is cited, in accordance with accepted academic practice. No use, distribution or reproduction is permitted which does not comply with these terms.
*Correspondence: Jinyuan Zeng, emVuZ2p5OTU5NkAxNjMuY29t