 Jianfa Wu1
 Yongpeng Sun
- 1Shale Gas Research Institute of PetroChina, Southwest Oil&Gas Field Company, Chengdu, Sichuan, China
- 2PetroChina Southwest Oil&Gas Field Company, Chengdu, Sichuan, China
- 3Key Laboratory of Unconventional Oil & Gas Development, China University of Petroleum (East China), Ministry of Education, Qingdao, China
To understand the occurrence state of fracturing fluid in shale gas matrix-fracture system, an experimental method for evaluating fracturing fluid flow characteristics in matrix-fracture system was established. By using Nuclear Magnetic Resonance method, the flow characteristics of fracturing fluid were investigated from three processes of filtration, well shut-in and flowback. The T2 spectrum of fracturing fluid flow process and fracturing fluid saturation in matrix-fracture core model were clarified. The results demonstrate that the peak area of T2 spectra increases gradually during the filtration process, and the fracturing fluid quickly fills the fractures and matrix pores. During the well shut-in process, the fracturing fluid gradually flows from the fracture space to the matrix pores, and the signal of the matrix pores increases by 50.5%. During the flowback process, fracturing fluid flows out of the matrix and fracture. And when it reaches a stable state, the peak signal in the fracture decreases by 64.5% and the matrix signal reduces by 18.8%. The better the porosity and permeability characteristics of the core, the more likely the fracturing fluid is to stay in the formation and cannot be discharged. This paper would contribute to basic parameters for shale gas fracturing design and production strategy optimization.
1 Introduction
As a kind of efficient and clean unconventional energy, shale resources account for 80% of global oil and gas resources and have broad development prospects (Jiang et al., 2016; Zou et al., 2016; He et al., 2021). Vigorously developing shale resource exploitation technology is also of strategic significance for alleviating the contradiction between energy supply and demand and solving the problem of energy security, and is the key field for increasing and stabilizing oil and gas resources in the future (Dehghanpour et al., 2012; Sun et al., 2018).
Shale reservoir is characterized by low porosity and low permeability, which is far lower than the permeability of conventional rock reservoir. At present, shale reservoir is mainly exploited by hydraulic fracturing technology (Dehghanpour et al., 2013; Huang et al., 2023a; Tan et al., 2023). Through continuous injection of fracturing fluid into the reservoir, fracture continue to expand with the migration of fracturing fluid, and a complex fracture network will be established in the reservoir (Huang et al., 2019; Tan et al., 2021). Shale reservoir has complex pore network, fluid flow characteristics in shale reservoir are affected by fluid-solid interaction, physical and chemical properties, adsorption and dissolution properties, etc (Huang et al., 2023b).
The flow characteristics of fluids in pores have been studied extensively (Driskill et al., 2013; Ren et al., 2015; Bi, 2018). You et al. studied the flow rule of nC8 in quartz pores under the condition of water film through molecular dynamics, and found that layered structures were formed on the surface of quartz pores and liquid-liquid slip occurred at the oil-water interface, revealing the migration mechanism of oil in quartz pores under the condition of water film (Zhou et al., 2017; Liu et al., 2019). By analyzing a variety of cationic surfactants, Yang et al. studied their adsorption mechanism on the quartz surface and found that a double-layer structure was formed at the critical micelle concentration, indicating that the surfactant affected the properties of the cationic adsorption film on the quartz surface (Wu et al., 2017; Su et al., 2019; Hou, 2020). Wang et al. investigated the flow pattern of oil-water two phases in calcite pores through molecular dynamics and found that liquid-liquid slip existed at the oil-water interface (Yang, 2016; You et al., 2018). Tong et al. used molecular dynamics to study the fluid behavior and flow in clay pores and concluded that the fluid properties in clay pores would affect the efficiency of oil recovery, indicating that diffusion, viscosity reduction and other factors are the main mechanisms affecting enhanced oil recovery (Tong et al., 2021; Wang et al., 2021). Shale fracturing has formed a complex porous - fracture dual medium, in which the fluid flow state is still unclear (Ma, 2018; Ma et al., 2019; Zhai, 2021).
In this paper, the basic physical properties of the shale core such as porosity and permeability are tested first, and the parameters such as the viscosity and surface tension of the fracturing fluid are tested after the fracturing fluid is configured. A matrix-fractured shale core model was developed, and the T2 spectrum characteristics of fracturing fluid in the process of filtration, well shut-in and flowback were tested by means of low-field nuclear magnetic resonance experiment. The saturation characteristics of fracturing fluid in matrix and fracture were analyzed, and the flow characteristics of fracturing fluid in shale core were compared under different porosity and permeability parameters. In this paper, the flow characteristics of fracturing fluid in shale matrix-fracture are defined, which provides basic parameters for shale gas fracturing design and production capacity construction.
2 Experimental method
2.1 Experimental material
The experimental cores were shale cores from wells X9 and X7 of the Wufeng Formation and Longmaxi Formation in the Yongchuan area of southern Sichuan, both of which were processed into cylindrical specimens with a length of 3 cm and a diameter of 2.5 cm.
The experimental fluid was the slick water fracturing fluid provided by the fracturing site of PetroChina Southwest Oil and Gas Field Company, and was prepared by adding 0.025% drag reducer and 0.25% flowback additives to the formation water. The mineral composition of the formation water is shown in Table 1.
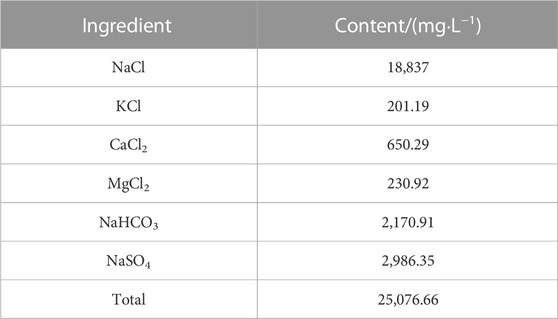
TABLE 1. Formation water mineral composition.
2.2 Experimental instrument
Smart-Perm Pulse Decay gas permeability measuring instrument (ULP-613, Yineng, Beijing, China), Helium porosity measuring instrument (PMI-100, Yineng, Beijing, China), Core Cutting machine (D24000, Dewalt, Maryland, United States), Nuclear Magnetic Resonance Online Analysis system (MacroMR12-150H-I, Niumag, Suzhou, China), High temperature and high pressure interface rheometer (TRACKER-S, Teclis, Auvergne, France), Rheometer (Haake MARS60, Thermo Scientific, Massachusetts, United States).
2.3 Experimental method
2.3.1 Core porosity and permeability parameters
Because the permeability of shale is generally at the Nano Darcy level, the pressure pulse Decay method is generally used to measure the permeability of shale. The shale cores from Wells X7 and X9 were selected and processed into 2.5–3 cm long core sections. After drying in the 110°C oven for 48 h, the permeability and porosity were measured by Smart-Perm pulse decay gas permeability measuring instrument and helium porosity measuring instrument.
2.3.2. Fracturing fluid basic property
According to the industry standard Shale Gas Fracturing Fluids Part 3: Performance Index and Evaluation Method of Continuous Mixing fracturing Fluid (NB/T14003.3-2017). After preparation of fracturing fluid, the surface tension of fracturing fluid was measured by Teclis Tracker high temperature and high pressure interfacial rheometer, and the viscosity of fracturing fluid at 170 s−1 was measured by HaakeMARS60 rheometer.
2.3.3 Fracturing fluid flow test
Because the permeability of shale is generally at the Nano Darcy level, the pressure pulse Decay method is generally used to measure the permeability of shale. The shale cores from Wells X7 and X9 were selected and processed into 2.5–3 cm long core sections. After drying in the 110°C oven for 48 h, the permeability and porosity were measured by Smart-Perm pulse decay gas permeability measuring instrument and helium porosity measuring instrument.
2.3.3.1 filtration process
① Open the heating device so that the temperature of the core holder rises to the set value and remains stable, and open the cold slot for coil cooling; ② Open the NMR measurement and analysis software, put the standard sample into the core holder, connect the experimental pipeline, and load the constant confining pressure; ③ Click cumulative sampling, measure the base signal of the core holder, and set a collection plan with an interval of 15 min; ④ Open the ISCO pump, set the constant pressure 6,895 kPa, click the execution plan, and start displacing at the same time; ⑤ Stop the experiment when the sampling trend line is stable, click on the inversion data, and obtain the T2 curve.
2.3.3.2 well shut-in process
① After the filtration curve is stable, turn off the ISCO pump and close both ends of the core holder; ② Set a new well shut-in acquisition plan, set acquisition sequence, sampling interval and sampling frequency; ③ Click the execution plan and start sampling; ④ Stop the experiment when the sampling trend line is stable, click on the inversion data, and obtain the T2 curve.
2.3.3.3 flowback process
① After the curve of the well shut-in process is stabilized, open both ends of the core holder and set a new flowback process acquisition plan; ② Fill the target pressure of nitrogen into the middle container with the help of the gas cylinder; ③ Set backflow displacement parameters and turn on the pump for constant pressure displacement; ④ Reduce the confining pressure so that the liquid in the annulus of the core and the core holder flows out, and then increase the confining pressure to the target value; ⑤ Stop the experiment when the sampling trend line is stable, click the inversion data to obtain the T2 curve, turn off the heating device, relieve the confining pressure, turn off the instrument, and end the experiment.
The flow chart of the experimental device is shown in Figure 1.
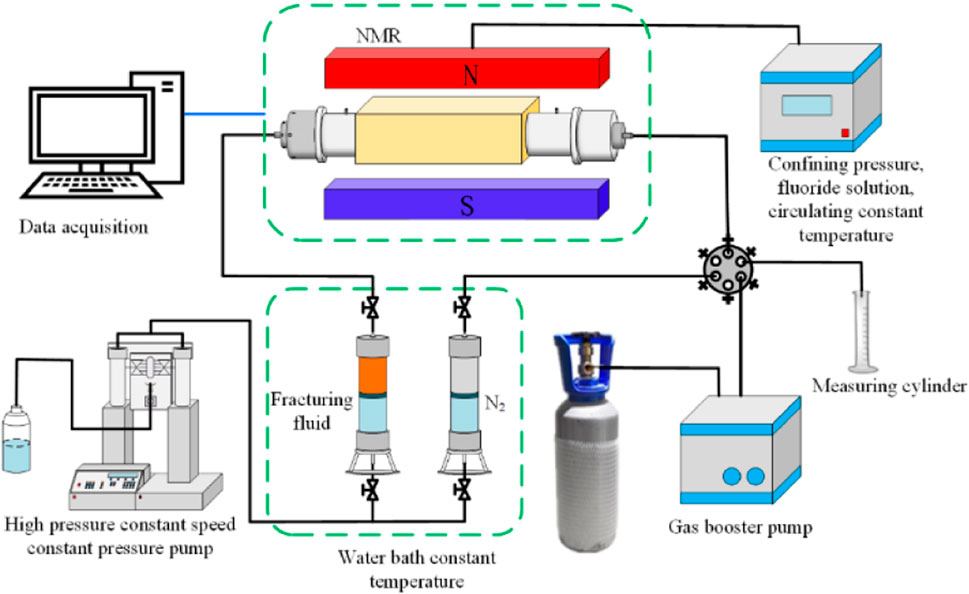
FIGURE 1. Flow chart of NMR on-line displacement evaluation system.
3 Results and analysis
3.1 Basic properties of core samples and fracturing fluid
The permeability and porosity were measured by Smart-Perm Pulse Decay gas permeability measuring instrument and helium porosity measuring instrument. The results are shown in Table 2.
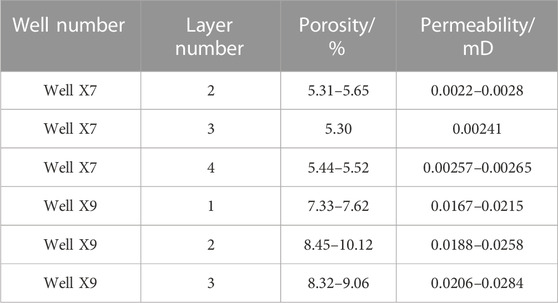
TABLE 2. Core porosity parameters of Wells X7 and X9.
As can be seen from Table 2: The core permeability of well X7 ranges from 0.0022 to 0.0028 mD, and the porosity ranges from 5.30% to 5.65%; the core permeability of well X9 ranges from 0.0167 to 0.0284 mD, and the porosity ranges from 7.33% to 10.12%, which can provide basic data for the analysis of subsequent experimental results.
The surface tension of fracturing fluid was 44.5 mN/m by means of Teclis Tracker high temperature and high pressure interfacial rheometer. The rheometer was used to test the rheological property of fracturing fluid. The viscosity of fracturing fluid was 2.38 mPa·s at 170 s−1. Fracturing fluid surface tension and viscosity parameters meet the requirement of industry standards.
3.2 T2 spectrum characteristics of fracturing fluid flow in shale matrix-fracture system
3.2.1 T2 spectrum characteristics during filtration process
In the process of fracturing, it is sometimes difficult to avoid a large amount of fracturing fluid loss to the formation. Selecting a shale core of layer 1 in well X9 to make a matrix-fracture core model. In the experiment, 2.7 MPa filtration pressure difference was used to simulate the fracturing fluid filtration process, and T2 spectrum signals were collected every 15 min until the signals were stable. The spectrum diagram of typical T2 signals during the fracturing fluid loss process is shown in Figure 2.
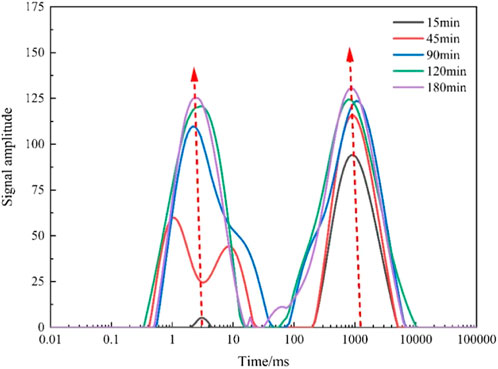
FIGURE 2. T2 spectrum during filtration process of layer 1 in well X9.
It can be seen from Figure 2 that in the process of fracturing fluid filtration process, the T2 signal features obvious left and right peaks, with the left peak corresponding to semaphores in small matrix pores and the right peak corresponding to semaphores in fractures. Both matrix and fracture signals gradually increase with the increase of filtration time. The right fracture signal increases rapidly after the start of filtration process, and basically reaches the highest peak after 45 min of filtration process, and becomes completely stable after 180 min of filtration process, with the amplitude of fracture signal reaching 146.6 after stabilization. The left stromal signal rose slowly, but it was basically stable after 180 min, when the stromal signal amplitude was 126.8. During the filtration process, fracturing fluid gradually percolates into fractures and matrix pores under the action of filtration pressure difference, resulting in the rise of the T2 spectrum signal. The fracture space is larger than the matrix pores, and fracturing fluid is easier to flow in the fracture, so the fracture is quickly filled with fracturing fluid at the beginning of filtration process, and the corresponding fracture T2 spectrum on the right side increases rapidly with time. The pores of shale matrix are small, and the fracturing fluid flows slowly in the matrix, so the corresponding matrix T2 spectrum signal on the left side rises slowly. When fracturing fluid flows through the matrix, it preferentially fills large pores, and then gradually flows into small pores. Therefore, the T2 peak signal on the left side shows a trend of gradually shifting to the left.
3.2.2 T2 spectrum characteristics during well shut-in process
After fracturing is completed, the well is usually closed for a period of time to restore formation pressure. After the completion of the filtration test, to simulate the flow of fracturing fluid during the well shut-in process, both ends of the core holder were closed and the well shut-in period was 2.5 h, during which T2 signals were collected every 15 min. The typical T2 signal variation spectrum during the well shut-in process is shown in Figure 3.
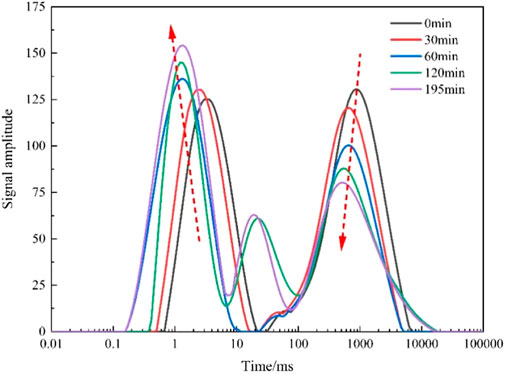
FIGURE 3. T2 spectrum during well shut-in process of layer 1 in well X9.
As can be seen from Figure 3, during the well shut-in process, the signal quantity in the right fracture gradually decreases with the well shut-in time. After the well shut-in process is over, the fracture signal amplitude decreases by 16.1%. The left matrix signal increased significantly and gradually shifted to the left with the time of well shut-in. After 195 min of well shut-in, the increase of matrix pore signal value was as high as 50.5% compared with that after the end of filtration process. The results show that the fracturing fluid in the fracture will gradually flow into the matrix during the well shut-in process, causing the signal value in the right fracture to decrease, and the signal value in the left matrix pore to increase gradually. Fracturing fluid will preferentially invades into the matrix with larger pores, and then gradually permeate into smaller micropores. Therefore, the semaphore of fracturing fluid in the left pore will gradually increase while it will show a trend of deviation to the left. The matrix signal changes obviously during the well shut-in process, fracturing fluid enters the matrix space in large quantities, and fracturing fluid utilization of the matrix is significantly improved after well shut-in closure.
3.2.3 T2 spectrum characteristics during filtration process
After the completion of well shut-in process, both ends of the core holder were opened, the flowback pressure difference of 1.3 MPa was adopted, and nitrogen was reverted into the core model from the outlet of the core holder to simulate the flowback process until the T2 spectrum signal was stable. The spectrum diagram of typical T2 signals during the flowback process is shown in Figure 4.
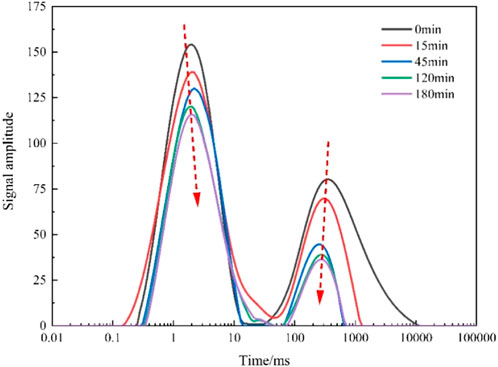
FIGURE 4. T2 spectrum during filtration process of layer 1 in well X9.
As can be seen from Figure 4, during the flowback process of fracturing fluid, the signals in both matrix and fracture decreased significantly, and the fracture signal decreased rapidly. The signal in fracture basically decreased to the lowest value 45 min after the flowback process began, and after the flowback reached a stable state, the peak signal in the right fracture decreased by as much as 64.5% compared with the end of well shut-in process. The left matrix signal decreased slowly and uniformly, and the decrease was smaller after stabilization, which decreased by 18.8% compared with the peak matrix signal after the completion of well shut-in process. Due to good fracture permeability, flowback fluid preferentially enters larger pores with a small pressure gradient, forming advantageous channels. During the filtration process, fracturing fluid mainly flowback from fractures, and the degree of matrix utilization is low. Therefore, the T2 signal of fractures decreases significantly, while the matrix signal decreases only slightly, so it is difficult to flowback fracturing fluid in shale reservoirs.
3.3 Fracturing fluid saturation characteristics in shale matrix-fracture system
3.3.1 Saturation characteristics during filtration process
According to the experimental results of T2 spectrum characteristics of fracturing fluid flow, the signal amplitudes of filtration process were calculated, and the variation curves of matrix and fracture signal amplitudes over time were plotted, respectively. The results are shown in Figure 5.
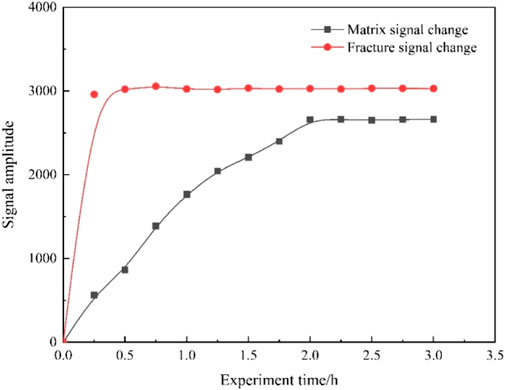
FIGURE 5. The accumulated signal during filtration process of layer 1 in well X9.
It can be seen from Figure 5 that both matrix and fracture signal amplitudes increase with the increase of filtration time. The fracture signal amplitude increases rapidly at the beginning, and reaches a stable state 0.5 h after the filtration process begins. The amplitude of the matrix signal rose slowly, rising at a constant rate during 0–2 h of filtration process, and then reached a stable state. At the beginning of filtration loss, because the fracture permeability is good, the fracture is quickly filled with fracturing fluid, and the corresponding signal amplitude rises rapidly. When the fracture is completely filled with fracturing fluid, it reaches a stable state. The flow of fracturing fluid into the matrix is a slow percolation, so the signal amplitude in the matrix rises slowly. When the fracturing fluid enters the limiting small pores, the matrix-fracture model approaches the saturation state, and the matrix and fracture signal do not change.
3.3.2 Saturation characteristics during well shut-in process
The variation curves of matrix and fracture signal amplitudes over time during well shut-in process were plotted respectively, and the experimental results are shown in Figure 6.
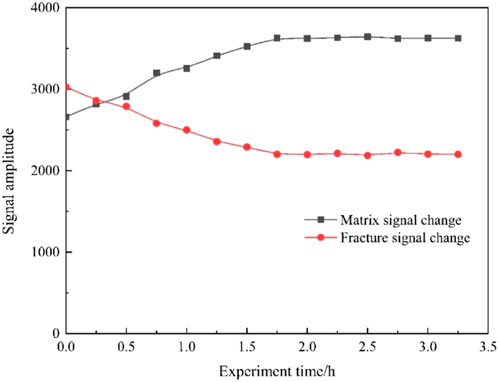
FIGURE 6. The accumulated signal during well shut-in process of layer 1 in well X9.
It can be seen from Figure 6 that the fracture signal gradually decreases during the well shut-in process and becomes basically stable 2 h after the start of well shut-in process. After stabilization, the fracture signal decreases by 27.3% compared with the initial value. The matrix signal gradually increased and reached a stable state after 2 h, and the matrix signal increased by 36.3%. Due to the closure of the two ends of the core holder, the core model is that the fluid is isolated from the outside world and the fracturing fluid is restricted to flow in the matrix and fracture space during well shut-in process. Under the action of capillary force, the fracturing fluid in the fracture invades into the matrix pores, and fluid exchange occurs in the fracture and matrix. In the absence of foreign fluid intrusion or fracturing fluid outflow, the fracturing fluid in the fracture is less and less, and the fracturing fluid in the matrix gradually increases. The fracturing fluid volume reduced in the fracture is the increased fracturing fluid volume in the matrix pores.
3.3.3 Saturation characteristics during flowback process
The signal amplitudes of flowback process were calculated, and the variation curves of matrix and fracture signal amplitudes over time were plotted, respectively. The results are shown in Figure 7.
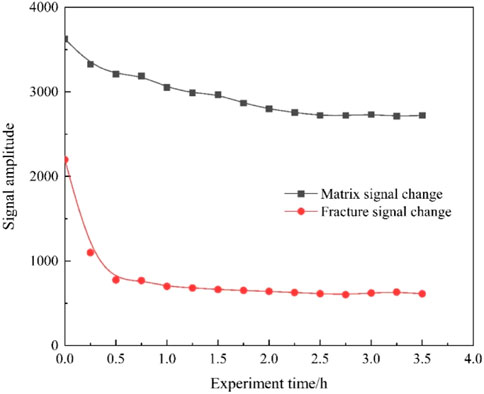
FIGURE 7. The accumulated signal during flowback process of layer 1 in well X9.
It can be seen from Figure 7 that both matrix and fracture signal amplitudes decrease with the increase of flowback time during the flowback process. The fracture signal amplitude decreased rapidly. The signal basically reached a stable state 1 h after the start of flowback process, and the signal after stability decreased by 55.1% compared with that at the end of the well shut-in process. The matrix signal amplitude decreased slowly during 0–2.5 h of flowback process, and then became basically stable, and the matrix signal amplitude decreased by 24.8%. During the flowback process, fracture permeability is high, which is the main body of fracturing fluid flowback, so the flowback rate is high, and the flowback is rapid, and the signal amplitude decreases and reaches the stable state faster. Due to the capillary force, fracturing fluid in the matrix is difficult to be driven out by nitrogen, so the matrix signal decreases slowly and the matrix flowback rate is low.
3.4 Comparison of fracturing fluid saturation in different porous cores
The difference in porosity and permeability parameters of shale reservoir is large, which will directly affect the flow behavior of fracturing fluid. In order to explore the influence of different porosity and permeability parameters on fracturing fluid flow behavior, three cores with different porosity and permeability parameters were selected for experiments. The selected cores simulated the three processes of fracturing fluid filtration, well shut-in and flowback, respectively, and calculated matrix saturation through T2 signal spectrum data. The core porosity and permeability parameters are shown in Table 3.
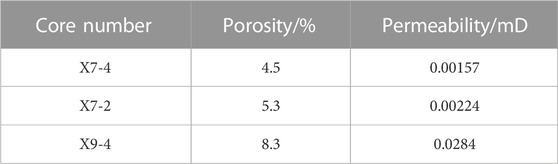
TABLE 3. The core porosity and permeability.
3.4.1 Matrix saturation characteristics during filtration process
Under the same fracturing technology (experimental conditions), the porosity and permeability of the core itself will also affect the flow behavior of fracturing fluid. The histogram of changes in matrix saturation with core porosity and the curve of core porosity are drawn, and the experimental results are shown in Figure 8.
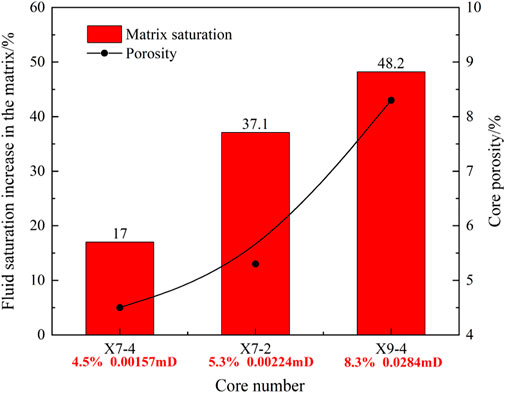
FIGURE 8. Comparison of matrix saturation during filtration process of different layers in well X7.
It can be seen from Figure 8 that after the filtration process, the matrix saturation gradually increases with the improvement of the porosity and permeability of the core, that is, the larger the porosity and permeability of the core, the more likely the fracturing fluid is to filter out and enter the matrix, and the higher the filtration loss of the fracturing fluid. Core X9-4 has the best porosity and permeability properties. Compared with core X7-4, which has the worst porosity and permeability, the porosity of core X9-4 increases by 0.84 times and the permeability increases by 170.9 times. Therefore, the matrix saturation of core X9-4 after the end of filtration process is 31.2% higher than that of core X7-4. The analysis shows that the larger the porosity of the core, the more sufficient the pore space, the greater the permeability of the core, the better the connectivity between the pores, and the stronger the fluid passing ability. Therefore, the core with more pores and larger pore volume is more prone to fracturing fluid filtration. However, when the core matrix pores are small and the pore space connectivity is poor, it is more difficult for fracturing fluid to flow in them, and it is more difficult for fracturing fluid loss to occur.
3.4.2 Matrix saturation characteristics during well shut-in process
After the completion of the simulated fracturing fluid filtration process, the well shut-in process was continued to be simulated, and the changes of the T2 spectrum were monitored in real-time during the experiment until the spectrum signal was stable. The change of matrix saturation was calculated and a histogram of core matrix saturation change was drawn. The experimental results are shown in Figure 9.
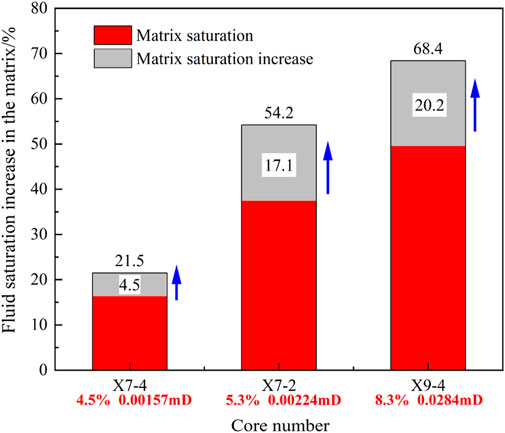
FIGURE 9. Comparison of matrix saturation during well shut-in process of different layers in well X7.
As can be seen from Figure 9, the matrix water saturation of core models with different porosity and permeability properties increased after the completion of the well shut-in experiment, and the better the core porosity and permeability properties, the greater the matrix saturation increase. Core X7-4 has low porosity and low permeability, and has the worst porosity and permeability parameters. Even after well shut-in process, the increase of matrix saturation is still small, only 4.5%. Core X9-4 has the best porosity and permeability properties, and the final matrix saturation reaches 68.4% after well shut-in process completion, 2.2 times higher than that of core X7-4, and 20.2% higher than that of core X7-4 after completion of filtration process. The analysis shows that there is no foreign fluid entering during the well shut-in process, fracturing fluid flows in the matter-fracture system, and fracturing fluid will spontaneously enter the matrix pores through the fractures. When the porosity and permeability of the core are good, fracturing fluid makes it easier to enter the matrix. In the process of restoring formation pressure after pressurization, the formation matrix with better porosity and permeability conditions is more likely to enter more fracturing fluid, and a large amount of fracturing fluid will invade into the matrix space from the fracture channel, which may cause fracturing retention and cannot be excluded.
3.4.3 Matrix saturation characteristics during flowback process
After the well shut-in process, high-purity nitrogen was reverted into the back end of the core holder to simulate the fracturing fluid flowback process in the production process. After the stability of the experimental T2 spectrum, the change of matrix saturation was calculated and a histogram of the change of core matrix saturation was drawn. The experimental results are shown in Figure 10.
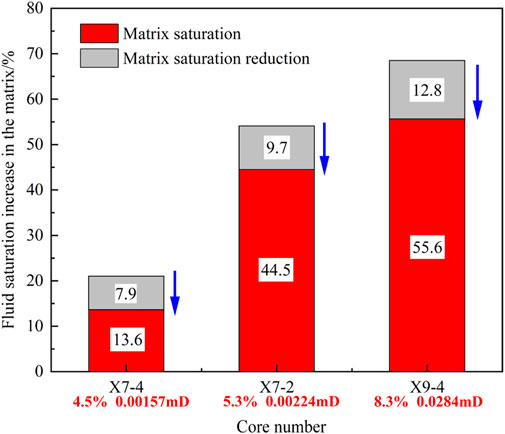
FIGURE 10. Comparison of matrix saturation during flowback process of different layers in well X7.
As can be seen from Figure 10, the matrix water saturation of the three core models with different porosity and permeability parameters all decreased to a certain extent after the flowback experiment, and the reduction amplitude gradually increased with the increase of core porosity and permeability, and the better the core porosity and permeability properties, the higher the matrix residual saturation after the flowback experiment. Core X7-4 has the worst porosity parameters, and after the end of well shut-in process, the residual matrix saturation is only 13.6, which is 7.9% lower than that after the well shut-in test. Core X9-4 has the best porosity and permeability properties, and loses the most fracturing fluid in the filtration process, with a loss volume of 12.8%. However, its matrix residual saturation after flowback is still as high as 55.6%, which is 3.1 times higher than that of core X7-4. The analysis shows that, in the post-pressure production process, the core with better porosity and permeability parameters is more prone to fracturing fluid flowback, but due to sufficient pore space, a large amount of fracturing fluid still exists in the matrix after flowback process, while the matrix with poor properties is not prone to a large amount of fracturing fluid retention. Therefore, in the process of post-pressure production, there is a large amount of fracturing fluid retention in the formation matrix with good porosity and permeability conditions, which is more likely to cause formation damage and pollution, and more attention should be paid to the countermeasures for fracturing fluid damage.
4 Conclusion
(1) The fracture system has a fast filtration rate and is basically stabilized 45 min after filtration. The filtration in matrix is slow, and it takes 2 h to reach a stable state for our samples. In the process of filtration, fracturing fluid gradually percolates into fractures and matrix pores under the action of filtration pressure drop. It first fills the fracture space rapidly, and then enters the matrix pores slowly.
(2) Fluid exchange occurs in between fractures and matrix during the well shut-in process, and fracturing fluid in fractures migrates into matrix pores. 2 h after well shut-in, the matrix and fracture signals reached a stable state, and the fracture signal decreased by 27.1% and the matrix signal increased by 40.9% compared with the initial state.
(3) During the flowback process, the amplitude of fracture signal and matrix signal decreased rapidly. The fracturing fluid fluxed out of the fracture and matrix space. The fluid signal decreased by 55.1% in fracture and 24.8% in matrix, compared with the end of the well shut-in process. Some fracturing fluids are difficult to discharge from the matrix and fractures.
(4) The better the porosity and permeability parameters of the core, the easier the fracturing fluid is to filtrate into the core matrix. Core X9-4 has the best porosity and permeability, and the matrix residual saturation after filtration is as high as 55.6%, which is 3.1 times higher than that of core X7-4. At the same time, fracturing fluid with good porosity and permeability parameters is more likely to be retained, and more attention should be paid to fracturing fluid retention damage during hydraulic fracturing.
Data availability statement
The original contributions presented in the study are included in the article/Supplementary material, further inquiries can be directed to the corresponding author.
Author contributions
JW: Conceptualization, Writing–review and editing. XY: Data curation, Methodology, Writing–review and editing. JL: Investigation, Validation, Writing–original draft. WL: Methodology, Project administration, Resources, Writing–review and editing. FC: Data curation, Methodology, Writing–review and editing. SH: Investigation, Resources, Validation, Writing–review and editing. CW: Conceptualization, Investigation, Writing–review and editing. YS: Funding acquisition, Project administration, Writing–review and editing.
Funding
The author(s) declare financial support was received for the research, authorship, and/or publication of this article. This research was funded by Shandong Provincial Natural Science Foundation (ZR2023ME016) and Open Fund (YSK2022001) of Shale Gas Evaluation and Exploitation Key Laboratory of Sichuan Province.
Acknowledgments
The authors thank the editor, the associate editor, and the reviewers for their constructive comments, which improved this paper.
Conflict of interest
Authors JW, XY, JL, and SH were employed by Shale Gas Research Institute of PetroChina, Southwest Oil&Gas Field Company. Authors WL and FC were employed by PetroChina Southwest Oil&Gas field Company.
The remaining authors declare that the research was conducted in the absence of any commercial or financial relationships that could be construed as a potential conflict of interest.
Publisher’s note
All claims expressed in this article are solely those of the authors and do not necessarily represent those of their affiliated organizations, or those of the publisher, the editors and the reviewers. Any product that may be evaluated in this article, or claim that may be made by its manufacturer, is not guaranteed or endorsed by the publisher.
References
Bi, W. (2018). Study on influence factors of propping fractures conductivity in shale formation. China: China University of Petroleum.
Dehghanpour, H., Lan, Q., Saeed, Y., Fei, H., and Qi, Z. (2013). Spontaneous imbibition of brine and oil in gas shales: effect of water adsorption and resulting microfractures. Energy & Fuels 27 (6), 3039–3049. doi:10.1021/ef4002814
Dehghanpour, H., Zubair, H. A., Chhabra, A., and Ullah, A. (2012). Liquid intake of organic Shales. Energy & Fuels 26 (9), 5750–5758. doi:10.1021/ef3009794
Driskill, B., Walls, J., Sinclair, S. W., et al. (2013). “Micro-scale characterization of the Eagle Ford formation using SEM methods and digital rock modeling,” in Unconventional Resources Technology Conference, Denver, Colorado, August, 2013.
He, X., Li, W., Dang, L., et al. (2021). Key technological challenges and research directions of deep shale gas development. Nat. Gas. Ind. 41 (1), 118–124. (ISSN 1000-0976; In Chinese). doi:10.3787/j.issn.1000-0976.2021.01.010
Hou, P. (2020). Research on the proppant uneven distribution and conductivity of complex fracture network in shale gas reservoir. Beijing, China: China University of Petroleum.
Huang, L., He, R., Yang, Z., Tan, P., Chen, W., Li, X., et al. (2023b). Exploring hydraulic fracture behavior in glutenite formation with strong heterogeneity and variable lithology based on DEM simulation. Eng. Fract. Mech. 278, 109020. doi:10.1016/j.engfracmech.2022.109020
Huang, L., Liu, J., Zhang, F., Dontsov, E., and Damjanac, B. (2019). Exploring the influence of rock inherent heterogeneity and grain size on hydraulic fracturing using discrete element modeling. Int. J. Solids Struct. 176, 207–220. doi:10.1016/j.ijsolstr.2019.06.018
Huang, L., Tan, J., Fu, H., Liu, J., Chen, X., Liao, X., et al. (2023a). The non-plane initiation and propagation mechanism of multiple hydraulic fractures in tight reservoirs considering stress shadow effects. Eng. Fract. Mech. 292, 109570. doi:10.1016/j.engfracmech.2023.109570
Jiang, Z., Wang, F., Duan, Y., and Zhou, J. (2016). China’s gas market under new situations: trends and countermeasures-Taking Sichuan and Chongqing gas provinces as an example. Nat. Gas. Ind. 36 (4), 187–194. (ISSN 1000-0976; In Chinese). doi:10.1016/j.ngib.2016.05.002
Liu, Y., Gao, D., Li, Q., et al. (2019). Mechanical frontiers in shale-gas development. Adv. Mech. 49, 201901. doi:10.6052/1000-0992-17-020
Ma, D. (2018). Study on fluid-solid coupling in multiple medium and its influence on seepage law for shale gas reservoirs. Beijing, China: University of Science and Technology Beijing.
Ma, L., Zhang, C., Liu, D., et al. (2019). Preliminary study on the well-soaking adaptability after fracturing in fuling shale gasfield. Special Oil Gas Reservoirs 26 (1). doi:10.3969/j.issn.1006-6535.2019.01.026
Ren, K., Ge, H., Yang, L., et al. (2015). Imbibition experiment of shale and its application in flowback analysis. Sci. Technol. Eng. 15, 1671–1815. doi:10.3969/j.issn.1671-1815.2015.30.019
Su, J., Dong, W., Luo, H., et al. (2019). Quantitative test and analysis of clay surface hydration water based on low-field nuclear; magnetic resonance technology. Acta Pet. Sincia 40 (4), 468–474. doi:10.7623/syxb201904008
Sun, Z., Wang, Y., Wu, B., et al. (2018). Chemical reactions and effects of slick water fracturing fluid on the pore structures of shale reservoirs in different deposition environments. J. Univ. Chin. Acad. Sci. 35 (5), 712–719. doi:10.7523/j.issn.2095-6134.2018.05.019
Tan, P., Fu, S., Chen, Z., and Zhao, Q. (2023). Experimental investigation on fracture growth for integrated hydraulic fracturing in multiple gas bearing formations. Geoenergy Sci. Eng. 231, 212316. doi:10.1016/j.geoen.2023.212316
Tan, P., Jin, Y., Pang, H., et al. (2021). Hydraulic fracture vertical propagation behavior in transversely isotropic layered shale formation with transition zone using XFEM-based CZM method. Eng. Fract. Mech. 248, 107707. doi:10.1016/j.engfracmech.2021.107707
Tong, H., Liu, Z., Zhang, H., et al. (2021). Theory and method of temporary macrofracture plugging to prevent casing deformation in shale gas horizontal wells. Nat. Gas. Ind. 41 (5), 92–100. (ISSN 1000-0976; In Chinese). doi:10.3787/j.issn.1000-0976.2021.05.010
Wang, F., Ruan, Y., Chen, Q., and Zhang, S. (2021). A pressure drop model of post-fracturing shut-in considering the effect of fracturing-fluid imbibition and oil replacement. Petroleum Explor. Dev. 48 (6), 1440–1449. doi:10.1016/s1876-3804(21)60300-2
Wu, W., Kakkar, P., Zhou, J., et al. (2017). “An Experimental investigation of the conductivity of unpropped fractures in shales,” in SPE Hydraulic Fracturing Technology Conference and Exhibition, The Woodlands, Texas, USA, January, 2017.
Yang, L. (2016). Fracturing fluid imbibition into gas shale and its impact on engineering. Beijing, China: China University of Petroleum.
You, L., Xie, B., Yang, J., et al. (2018). Mechanism of fracture damage induced by fracturing fluid flowback in shale gas reservoirs. Nat. Gas. Ind. 38 (12), 61–69. (ISSN 1000-0976; In Chinese). doi:10.3787/j.issn.1000-0976.2018.12.007
Zhai, L. (2021). Study on the initiation and extension mechanism of hydraulic fracturing in the perforated oil shale horizontal well. Changchun, China: Jilin University.
Zhou, T., Zhang, S., Yang, L., et al. (2017). Experimental study on surface softening law of fracturing fracture in shale reservoirs. J. Xi'an Shiyou Univ. Sci. Ed. 32 (1), 1. doi:10.3969/j.issn.1673-064X.2017.01.009
Keywords: shale gas, matrix-fracture system, fracturing fluid, occurrence characteristics, flow behavior
Citation: Wu J, Yang X, Li J, Liu W, Chen F, Huang S, Wang C and Sun Y (2023) Fracturing fluid flow characteristics in shale gas matrix-fracture system based on NMR method. Front. Energy Res. 11:1321114. doi: 10.3389/fenrg.2023.1321114
Received: 13 October 2023; Accepted: 13 November 2023;
Published: 24 November 2023.
Edited by:
Peng Tan, CNPC Engineering Technology R&D Company Limited, ChinaReviewed by:
Chaohua Guo, China University of Geosciences Wuhan, ChinaMuchen Sun, University of Arkansas, United States
Kai Gao, University of Twente Enschede, Netherlands in collaboration with reviewer MS
Copyright © 2023 Wu, Yang, Li, Liu, Chen, Huang, Wang and Sun. This is an open-access article distributed under the terms of the Creative Commons Attribution License (CC BY). The use, distribution or reproduction in other forums is permitted, provided the original author(s) and the copyright owner(s) are credited and that the original publication in this journal is cited, in accordance with accepted academic practice. No use, distribution or reproduction is permitted which does not comply with these terms.
*Correspondence: Jiajun Li, bGlqal8yMDIxQHBldHJvY2hpbmEuY29tLmNu; Yongpeng Sun, c3VueW9uZ3BlbmdAdXBjLmVkdS5jbg==