 Xieqin Xu
 Feng Gui
 Sheng Zhao
- Marine Science and Technology College, Zhejiang Ocean University, Zhoushan, China
To understand the current situation and development trend of energy consumption and carbon emissions in the fishery industry, a Long-Range Energy Alternatives Planning System (LEAP)-fishery model for Zhoushan City was constructed, and the trends of energy consumption and carbon emissions in the Zhoushan City fishery industry were analyzed under the business-as-usual scenario, the low-carbon scenario, and the strengthened low-carbon scenario. The results show that under the business-as-usual scenario, the future energy consumption of Zhoushan City’s fisheries in general shows an increasing trend, and the composition of energy consumption in all scenarios is primarily dominated by fossil energy, with diesel and coal predominating. In terms of the structure of end-use energy consumption, fishing vessels and aquaculture consume the most energy, with energy consumption exceeding 30% of total energy consumption in all scenarios. In terms of the emission reduction contribution rate, which the promotion of clean energy generation, the improvement of energy efficiency, and the reduction of aquaculture production play key roles in the low-carbon development of the fishery industry. From an economic perspective, carbon reduction measures such as reduction of aquaculture production and increased efficiency of energy delivery would have significant economic benefits, but these measures have limitations. Finally, suggestions are made to optimize the energy structure, improve the implementation of energy intensity and total energy control, and strengthen public awareness of energy conservation to reduce carbon emissions from the fishery industry, thus making the research in this paper relevant to real-world situations.
1 Introduction
Climate change is a challenge facing human society today (Yang et al., 2021). Since the Industrial Revolution, the cumulative emissions of carbon dioxide (CO2) due to the massive use of fossil fuels by human beings have significantly increased the concentration of greenhouse gases (GHGs) in the atmosphere, exacerbating global climate change (Parks, 2009; Fu, 2022). Agricultural production is the second most important source of global carbon emissions (Federici et al., 2015), and fisheries, as an important component of agriculture, are highly industrialized and highly dependent on fossil fuels (Greer et al., 2019; Li et al., 2021). The carbon emissions of fisheries contribute close to one-third of the total carbon emissions from agriculture (Li et al., 2018). Therefore, realizing carbon emission reduction in fisheries is an important element in addressing climate change and low-carbon agricultural development. The Opinions on Accelerating the Green Development of Aquaculture issued by China in 2019 emphasized the need to strengthen fishery resources and environmental protection in the coming years and realize sustainable low-carbon fishery development.
At present, few studies have focused on the assessment of energy consumption and carbon emissions in Chinese fisheries. In 2007, Xu et al. measured the energy consumption of fishing vessels, aquaculture, aquatic product processing, the manufacture of fishing equipment and machinery, and aquaculture feed in China’s fishery industry. The results showed that the energy consumption of fisheries is not low, and that the level of energy consumed is 0.35 tons of standard coal/104 yuan of output value, which is 84% higher than the average energy consumption of agriculture, demonstrating that fisheries have the highest level of energy consumption in agriculture (2007). In 2009, Xu and Zhang et al. investigated and analyzed the energy consumption of China’s fishing vessels by sampling fishing vessels in eight developed provinces of China’s marine fisheries, such as Liaoning, Shandong, Jiangsu (2009). Zhang based on the data provided by the research on energy consumption and energy-saving technology of fishing vessels conducted by the Institute of Fishery Machinery and Instrumentation of the Chinese Academy of Fisheries Research from 2008 to 2009, estimated the carbon emissions of China’s fishing vessels by adopting the method of calculating CO2 emissions put forward by ORNL (Oak Ridge National Laboratory), and analyzed the main factors of the high energy consumption and pollution emissions of fishing vessels (2010). In 2011, based on field sampling research and data analysis, Xu et al. measured the annual fuel consumption of China’s marine fishing vessels and gave recommendations for research and development of energy conservation and emission reduction in China’s fisheries industry (2011). Yue and Wang et al. used stepwise regression analysis method to analyze the production status and fuel consumption of marine capture fishing vessels (2013). In 2014, Xu et al. measured the fishery energy consumption in Dongmen Island, Zhejiang Province based on field research and data analysis, and analyzed its influencing factors. The results showed that industrial structure adjustment and increased production scale were the main factors promoting the growth of total fishery energy consumption in Dongmen Island (2014). In the same year, Yue et al. synthesized the impacts of catch size, mode of operation structure, energy intensity of mode of operation and fuel emission coefficients on GHG emissions, and conducted a factor decomposition of GHG emissions based on the accounting and time series analysis of GHG emissions of marine capture fisheries in the period from 2006 to 2011 (2014). In 2015, Xu et al. studied the fishery carbon productivity along the coast of China and found that China’s fishery carbon productivity as a whole has been improving year by year, but also that there are large differences in the level of fishery carbon productivity among coastal regions (2015). In 2017, Xu et al. investigated and analyzed the energy consumption and carbon emissions of motorized fishing vessels in Hainan Province (2017). In 2021, Li et al. accounted for the carbon emissions from aquaculture and capture fisheries in the fishery industry based on an input–output model (2021). Gao et al. (2022) measured the regional differences in marine fisheries carbon emissions and emission reduction potential of coastal provinces based on the Terrell index and carbon emission reduction potential model, and predicted the carbon emission intensity of marine fisheries (2022). In the same year, Ma et al. analyzed the drivers of carbon emissions in China’s fishery economy based on the parameter-adjusted Kaya-LMDI model and the Tapio decoupling model using data from the China Fishery Statistical Yearbook from 2009 to 2020 (2022). In 2023, Di et al. calculated the carbon emissions of China’s marine fisheries based on “carbon emissions” and “carbon sinks”, and used the model to measure the carbon emission efficiency of marine fisheries from 1980 to 2019 (2023).
To summarize, the existing research can be further deepened in the following aspects. Firstly, most of the existing research take the whole country as a large-scale study, and there is a lack of research on different cities and other regions. Different provinces and different cities due to different proximity to the sea, resource conditions vary greatly. Secondly, when quantitatively investigating the effect of energy conservation and emission reduction in the fishery sector, most studies focus on the overall energy consumption and carbon emissions of the fishery industry, with little consideration given to the impact of carbon reduction measures on energy conservation and emission reduction in the fishery industry, and there is a lack of research on the analysis of the economics of various carbon reduction measures in the medium and long term. Lastly, previous related studies have analyzed carbon emissions from fishing vessels (Zhang et al., 2010), drivers of carbon emissions from fisheries (Liu et al., 2023), and factors influencing carbon emission efficiency (Chen, 2023), there is a lack of scenario simulation in the existing literature on the future development of the fishery industry under the policy change scenario.
Therefore, this study aimed to (1) research fishery emission reduction in Zhoushan City; (2) apply the emission reduction policies mentioned in the “14th Five-Year Plan” to Zhoushan City, and study the fishery emission reduction in the region; and (3) utilize the model to design scenarios according to the policies, to analyze the contribution of different carbon reduction measures to the reduction of emissions in the fisheries industry, and to analyze the economic benefits of different carbon reduction measures. By constructing an energy consumption and carbon emission measurement model, analyzing and researching the overall carbon emission situation of Zhoushan City’s fishery industry, and to make scenario predictions on the future trend of carbon emissions under various carbon-reducing measures, which is of great significance for comprehensively grasping the situation of fishery carbon emissions and promoting the low-carbon development of fisheries and agriculture.
2 Materials and methods
2.1 LEAP model
Currently, researchers mainly use top-down models, bottom-up models, and hybrid models combining the two approaches (Algehed et al., 2009; Yan et al., 2021). Top-down models are mainly applied for macroeconomic analysis, but they cannot provide a detailed description of technological development. The research scope using top-down models is mainly at the national and global levels (Liang et al., 2022). Bottom-up models support richer technological information, belong to the field of engineering, have a flexible structure, and can be assessed from a practical point of view (Liu and Yao, 2021). Hybrid models combine the characteristics of these two models (Jacobsen, 1998; Vieira et al., 2020), but are difficult to use due to their complex structure and the need for a large amount of data support. Therefore, the bottom-up model was selected in this study. The Long-Range Energy Alternatives Planning System (LEAP) model, developed by the Stockholm Environment Institute (SEI) in Sweden, is a typical bottom-up model and an economic–energy–environmental modeling tool based on scenario analysis (Wang et al., 2022) that has a flexible structure and is widely used in the simulation and evaluation of energy and the environment at different scales (Cai L. Y. et al., 2023; Kiani, 2017; Nieves et al., 2019; Ringkjøb et al., 2018). The LEAP model covers energy consumption activities in both the energy conversion sector and the energy end-use sector (Du et al., 2022). When studying energy consumption and climate change, the LEAP model can also be used to explore national and regional energy policy planning and to determine the possible impacts of the implementation of different policies through modeling (Huang et al., 2011; Amo-Aidoo et al., 2022). For example, Nasir et al. (2021) projected the electrical demand in Pakistan’s largest province, Punjab, from 2019 to 2050 using the LEAP system and provided recommendations for emission reductions; Hong et al. (2016) analyzed the level of contribution of the South Korean transport sector to the national GHG emission reduction target using the LEAP model; Emodi et al. (2017) used the LEAP model to explore the future energy demand, supply, and associated GHG emissions in Nigeria from 2010 to 2040; and Shahid et al. (2021) and Mirjat et al. (2018) utilized LEAP to model Pakistan’s electrical system from 2016 to 2040 (2021) and from 2015 to 2050 (2018).
According to the actual situation of the Zhoushan City fisheries, the terminal energy demand, energy conversion, and environmental impact modules were selected for the model; the operating principle is that the parameter settings drive the change in the terminal energy demand module. Then, according to the efficiency coefficients of the energy conversion module, the demand for primary energy is reduced in the process of converting it into secondary energy in order to realize the goals for energy supply and demand. The environmental impact of the fisheries sector is assessed by measuring the carbon emissions generated by energy consumption simultaneously with the projections for energy consumption.
2.1.1 Model modules
2.1.1.1 Terminal energy demand module
To construct the LEAP model, the terminal sector decomposition of the fishery should be considered first. In this study, the terminal demand sector of Zhoushan City’s fishery was divided into five parts: fishing vessels, aquaculture, aquatic product processing, fishing machine manufacturing, and feed production. The terminal energy demand module focuses on calculating the end-use energy demand, which is the amount of all types of energy used for production activities in a given period after deducting the amount of secondary energy consumed and the losses during processing and conversion (Liu, 2016). The energy demand for each end-use sector was calculated based on the activity level of each end-use sector (such as the distance traveled in the transportation sector, floor space in the building sector, and fishery production in the fishery sector) and the energy intensity corresponding to the activity level. The formula used to predict the energy demand for each end-use sector is shown in Eq. 1 (Peng et al., 2014):
where
2.1.1.2 Energy conversion module
Among the energy sources used by the end-demand sector, coal, diesel fuel, and natural gas are primary energy sources that can be utilized directly, while electricity is a secondary energy source that needs to be converted. Therefore, the process of “transmission, distribution, and power generation” is set up in the energy conversion module, and efficiency coefficients are included for each of these processes to obtain the amount of standard coal lost due to conversion of the energy source. The energy loss is calculated using the following formulas.
(1) These losses refer to the amount of energy lost during the transmission and distribution of energy, as shown in Eq. 2:
where
(2) Losses in power generation. Electricity is a secondary energy source that requires conversion, and the energy it loses due to processing and conversion during energy conversion can be expressed as Eq. 3:
where
Aggregating the energy consumption of the terminal energy demand module and the energy conversion module yields the total energy demand of the fishery, which is given by the following formula (Eq. 4):
where
2.1.1.3 Environmental impact module
After obtaining the consumption of various energy sources in each sector of the fisheries industry through the scenario simulation of the LEAP model, the carbon emissions of the fisheries industry can be measured based on the corresponding carbon emission coefficients for various energy sources. The calculation of carbon emissions from energy consumption refers to Method 2 in the Guidelines for National Greenhouse Gas Inventories issued by the United Nations Intergovernmental Panel on Climate Change (IPCC), which accounts for carbon emissions based on the amount of fossil energy consumed and specific emission factors. For fossil fuels, the emission factor is unchanged (Duan et al., 2016), the IPCC international standard is adopted (IPCC, 2019), and the fuel conversion coefficient is adopted from China’s General Rules for Calculating Comprehensive Energy Consumption (GB/T 2589-2020) (Li et al., 2019). It can be expressed as Eq. 5:
where CE is the CO2 emissions in tonnes (in CO2 eq.) and
2.1.2 Scenario setting
Scenario analysis, also known as prospective description or scripting, is intuitively qualitative and capable of quantitative prediction (Dong, 2019). To study the impacts of different energy conservation and emission reduction measures on the energy consumption and GHG emissions of the fishery industry in Zhoushan City, this study constructed a business-as-usual scenario, a low-carbon scenario, and a strengthened low-carbon scenario based on the main factors affecting GHG emissions, including the energy utilization efficiency and energy structure, and evaluated the fishery industry’s projected energy consumption and carbon emissions in Zhoushan City from 2021 to 2035. The scenario setting parameters mainly referred to the energy-related policy planning documents issued by the province in which Zhoushan City is located, such as the 14th Five-Year Plan for Energy Development in Zhejiang Province (2022), the 14th Five-Year Plan for Responding to Climate Change in Zhejiang Province (2021), the 14th Five-Year Plan for Comprehensive Work Program for Energy Conservation and Emission Reduction in Zhejiang Province (2022), and the studies of Wu et al. (2023), Yang et al. (2023), Mai (2016), and Cai L. et al. (2023). The specific settings are shown in Table 1, where the differences between the business-as-usual scenario, the low-carbon scenario, and the strengthened low-carbon scenario are mainly quantitatively differentiated by the difference in the implementation intensity of the carbon reduction measures. The business-as-usual scenario was used as a reference to verify the emission reduction effect of different carbon reduction measures.
(1) Business-as-usual scenario: the core assumption of the business-as-usual scenario is that the fishery sector in Zhoushan City will continue to conduct the current energy saving and emission reduction measures during the scenario time and that the energy intensity of each sector will decrease slightly from the level of the baseline year, while the structure of energy consumption will change relatively little.
(2) Low-carbon scenario: based on the analysis of future technological advances and enhanced energy efficiency policies, under the low-carbon scenario there is improved energy efficiency in all sectors, improved fuel economy for fishing vessels, and further optimization of the energy mixture. This scenario begins by introducing liquefied natural gas (LNG) fishing vessels. The main component of LNG is methane, the cleanest fossil energy source on earth.
(3) Strengthened low-carbon scenario: under this scenario, the corresponding policy efforts based on low-carbon scenarios will be strengthened, the potential for carbon reduction in various sectors will be further explored, the energy efficiency and fuel economy of fishing vessels will be further improved, and the proportion of clean energy used will be further expanded.

TABLE 1. Main parameter settings for different scenarios.
The theoretical background required to construct the model has now been completed, and this study has established the Zhoushan City LEAP-Fisheries model based on the characteristics of the LEAP model and the availability of data. The model comprises three modules: the terminal energy demand module, the energy conversion module, and the environmental impact module. Taking 2020 as the base year and 2021-2035 as the projection period, scenario analysis was used to calculate the energy consumption and CO2 emissions of Zhoushan City’s fishery industry and to analyze the potential for energy conservation and emission reductions in Zhoushan City’s fishery sector in the future under different carbon reduction measures. The analysis can be used to explore low-carbon development pathways and provide policy recommendations. In this case, the projected energy demand is determined by the level of end-use activity and its energy intensity, and the projected carbon emissions are determined by the direct energy consumption of the end-use activity and the indirect energy consumption of the energy conversion sector, combined with the carbon emission factor of the corresponding energy source. The structure of the model is shown in Figure 1.
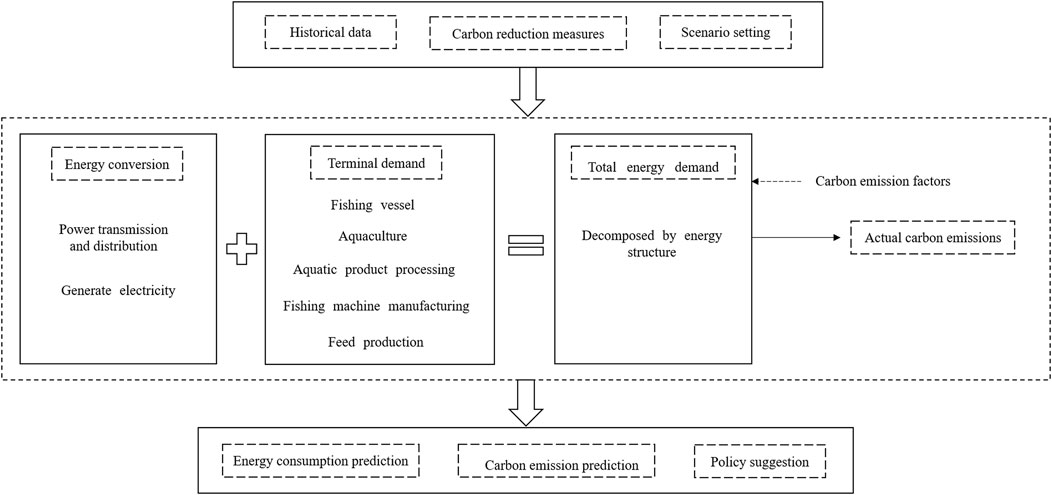
FIGURE 1. Technology roadmap of the Long-Range Energy Alternatives Planning System (LEAP) model.
2.2 Economic evaluation model of carbon reduction measures
In this section we calculate the marginal cost of the various carbon reduction measures under consideration (Liu et al., 2023). Given this analysis, policymakers can prioritize various carbon reduction measures. The calculation for each carbon reduction measure is shown in Formula 6:
where
2.3 Data sources and processing
The historical energy consumption data used in this paper were mainly derived from the Zhoushan City Statistical Yearbook, Zhejiang Province Statistical Yearbook, Zhejiang Province Energy Balance Sheet, and relevant literature and research materials. The carbon emission system boundary of the fisheries in this study mainly contains the carbon emissions from fishing vessels, aquaculture, fish processing, the manufacturing of fishing equipment, and feed production. Fishing vessels account for a high proportion of fishery energy consumption each year due to their considerable power and tonnage; the use of fishery machinery in China’s aquaculture production has become very common, with oxygenators, pumps, and other equipment accounting for 70.4% of the total aquaculture machinery (Gu et al., 2023). The use of this equipment has made aquaculture an important power-consuming industry as well as an important source of GHG emissions. Current aquaculture methods in Zhoushan City include the use of ponds, net boxes, rafts, cages, bottom-seeding, and factory farming. Because little mechanical equipment is used in raft, cage, and bottom-seeded aquaculture (Liu and Che, 2010), this study takes the energy consumption of pond, net box, and factory farming aquaculture into account for carbon emissions. In addition, electricity consumption in fish processing, fishing equipment manufacturing, and feed production indirectly generates carbon emissions and is therefore also considered in fishery carbon emissions. Table 2 lists the number, gross tonnage, and power of fishing vessels in Zhoushan City from 2011 to 2020, and the production of aquatic products is shown in Figure 2.
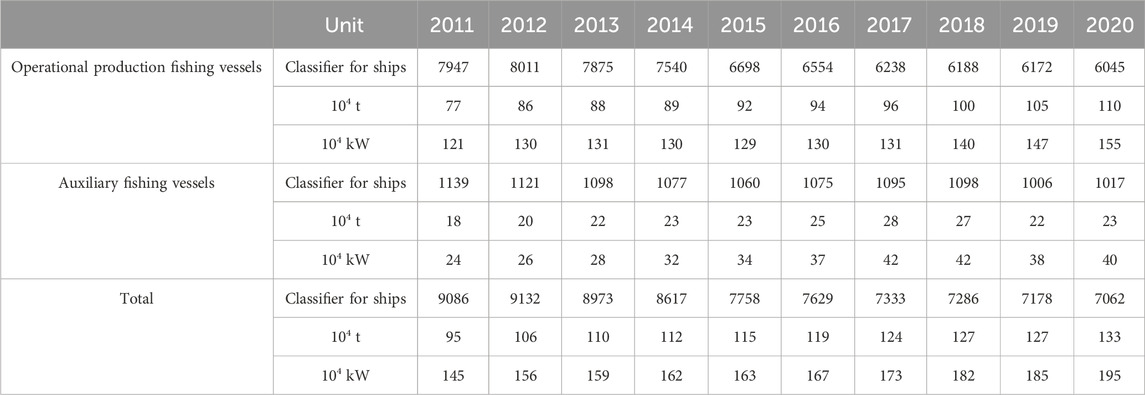
TABLE 2. Zhoushan’s 2011–2020 fishing vessels.
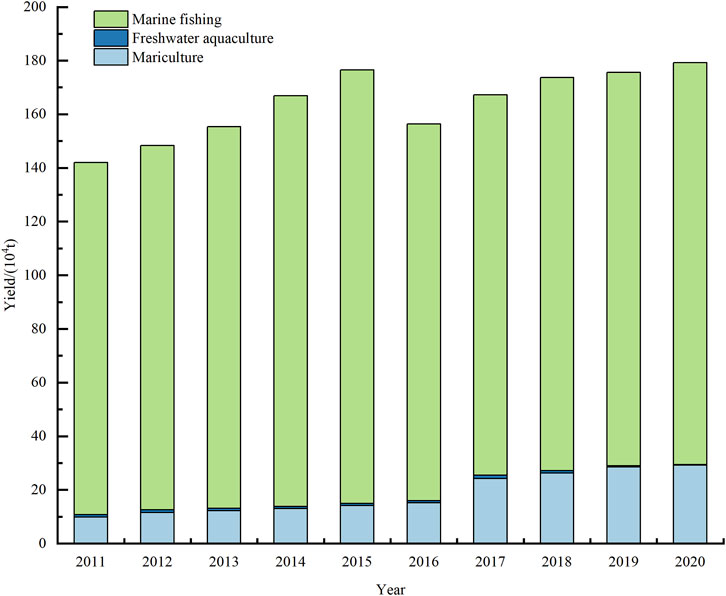
FIGURE 2. Zhoushan’s fish production from 2011 to 2020.
The present study used the LEAP model, Excel 2016, and Origin software for scenario analysis, data organization, and visualization, respectively. First, based on the LEAP software, we constructed an accounting model of fishery energy consumption and CO2 emissions in Zhoushan, calculated the fishery energy consumption and carbon emissions in Zhoushan in 2020, and performed a scenario analysis of the energy consumption and carbon emissions from 2021 to 2035. Excel was then used to collate the results of the model, after which the data were visualized using Origin software and a map of the results was created.
3 Results
3.1 Energy consumption
Figure 3 shows the evolution results of total energy consumption under three scenarios for Zhoushan City’s fisheries from 2020 to 2035. The three scenarios show different trends in total energy consumption. Among them, under the business-as-usual scenario, from 2020 to 2035, the total amount of energy use first decreases slightly and then shows a gradual growth trend, reaching 3.21 × 10⁶ t of standard coal in 2035, which is about 1.43 times as much as that of 2020, with an average annual growth rate of about 2.41%. Under the low-carbon scenario, thanks to the implementation of various energy-saving measures, the total energy consumption is projected to grow from 2.25 × 10⁶ t in 2020 to 2.97 × 10⁶ t in 2035, with an average annual growth rate of about 1.87%, which is lower than the business-as-usual scenario. Compared with the low-carbon scenario, the synergistic effect of various energy saving and emission reduction measures under the strengthened low-carbon scenario is further strengthened and upgraded. By fully tapping the energy-saving potential of all sectors of the fishery industry, energy consumption shows a trend of first decreasing and then gradually increasing, with the lowest energy consumption in 2025 at 1.97 × 10⁶ t, and the total energy consumption in 2035 rising insignificantly from 2020 to 2.28 × 10⁶ t, saving 28.97% or 9.3 × 10⁵ t compared with the same year under the business-as-usual scenario.
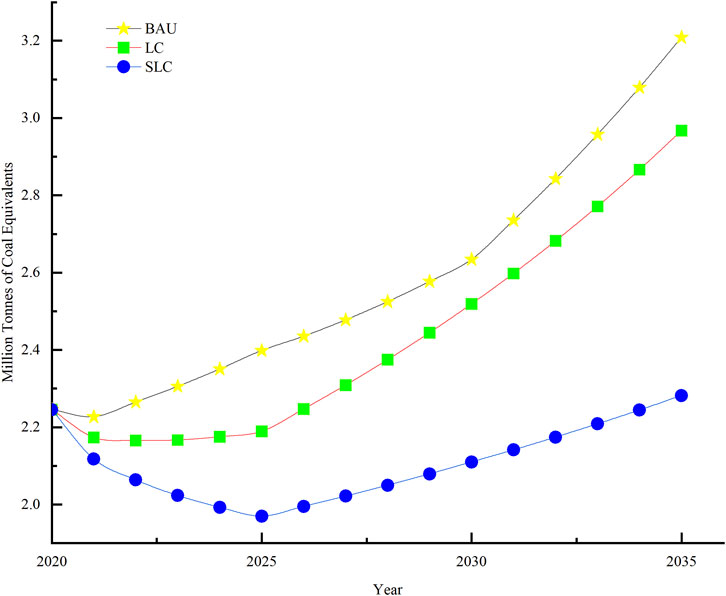
FIGURE 3. Energy consumption under different scenarios Business-as-usual (BAU), low-carbon (LC), and strengthened low-carbon (SLC) scenarios.
To further investigate the characteristics of the evolution of the energy structure of Zhoushan City’s fishery industry in a certain future period, the LEAP model was used to extract the consumption of different primary energy sources. Figure 4 shows the composition of primary energy consumption in a typical year under the three scenarios. Energy consumption is dominated by fossil energy in all three scenarios, with diesel and coal always being the most dominant energy demand. In the business-as-usual scenario, the share of diesel will decrease from 50.22% to 38.94% in 2035, the share of coal will decrease slightly from 43.56% to 37.38% in 2020, and the share of clean energy will gradually increase from 5.93% to 23.64% in 2020. The low-carbon scenario sees a gradual decline in diesel consumption, with the share falling to 30.3% in 2035, and coal consumption overtaking diesel with a share of 34.01% in 2035. The share of clean energy increases compared to the business-as-usual scenario, with a share of 35.68% in 2035. Under the strengthened low-carbon scenario, the energy structure will be further optimized, diesel consumption will continue to decline, coal consumption will first decline and then enter a plateau period of slow growth, and the consumption of clean energy will continue to rise, with the proportion of clean energy reaching 47.23% of the total primary energy consumption in 2035, and the energy structure gradually tending to become cleaner and decarbonized.
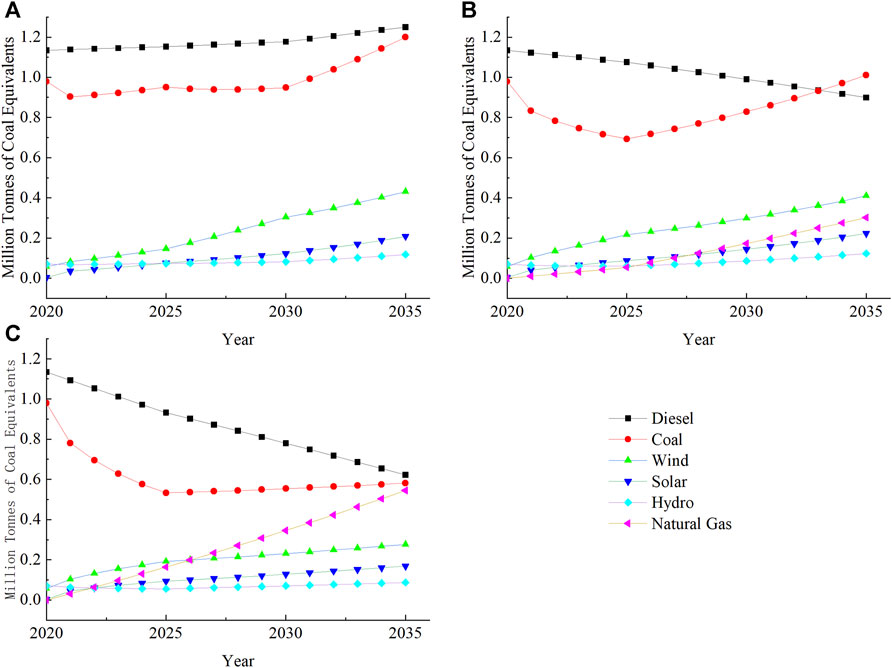
FIGURE 4. Structure of primary energy composition under different scenarios (A) Business-as-usual (BAU), (B) low-carbon (LC), and (C) strengthened low-carbon (SLC) scenarios.
Figure 5 shows the share of energy consumption by end-use sectors in the fishery industry in a typical year under different scenarios. In the business-as-usual scenario, in 2020, fishing vessels had the largest share of energy consumption at 50.48%, followed by aquaculture at 33.76%, and fishing equipment manufacturing had the least energy consumption at 0.52%. By 2035, the structure of end-use energy consumption changes, with aquaculture accounting for the largest share of energy consumption at 48.66%, followed by fishing vessels, and the smallest share of energy consumption is still in the manufacture of fishing equipment and machinery, with a share of energy consumption of 0.37%. Under the low-carbon scenario, by 2035, the energy consumption of aquaculture will gradually grow to 47.53%, and the share of energy consumption of fishing vessels will slowly decrease, although it is still a major energy consumer, exceeding 40% and ranking second, followed by aquatic product processing at 9.18%, feed production at 2.47%, and fishing equipment manufacturing at 0.36%. Under the strengthened low-carbon scenario, the share of energy consumption in aquaculture will grow slowly to 35.99% in 2035 because of the reduction in aquaculture production, the largest share of energy (51.16%) will be consumed by fishing vessels in 2035, and the remaining three drivers of energy consumption are small, with a slight decrease in aquatic product processing to 10.61%, feed production at 1.83%, and fishing equipment manufacturing at 0.41%. In all scenarios, fishing vessels and aquaculture are the two largest energy consumers in the fishery sector, with shares ranging from 30% to 50%, and fishing equipment manufacturing representing the smallest share of energy consumption.
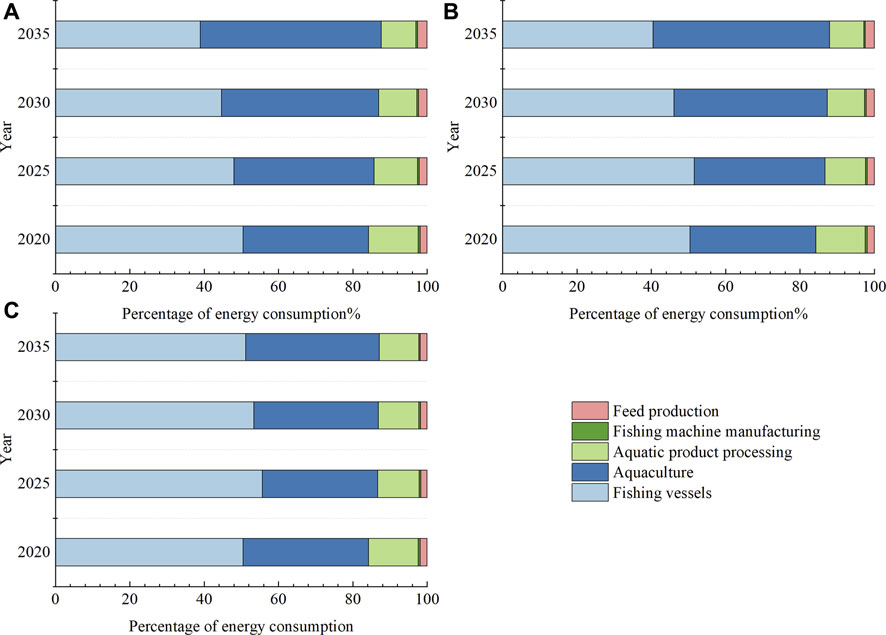
FIGURE 5. Sectoral energy consumption under different scenarios (A) Business-as-usual (BAU), (B) low-carbon (LC), and (C) strengthened low-carbon (SLC) scenarios.
3.2 Carbon emissions
As energy consumption changes, CO2 emissions in Zhoushan City’s fisheries will also change from year to year. Measuring CO2 emissions in terms of the 100-year global warming potential, Figure 6 shows the trend of carbon emissions from 2020 to 2035 under the three scenarios. Under the business-as-usual scenario, the total carbon emissions mainly show a growing trend, with carbon emissions increasing from 5.11 × 10⁶ t (in equivalent terms) in 2020 to 5.97 × 10⁶ t in 2035, which is about 1.17 times that of the baseline year, with an average annual growth rate of 1.05%. Under the low-carbon scenario, carbon emissions are significantly reduced compared to the business-as-usual scenario due to the optimization of the energy structure and the implementation of carbon reduction measures, with the lowest carbon emissions of 4.3 × 10⁶ t in 2025, followed by a slow increase to 5.2 × 10⁶ t in 2035, a decrease of 12.9% compared to the business-as-usual scenario. Under the strengthened low-carbon scenario, the emission reduction potential of various sectors is further explored, the energy structure is further optimized, and carbon emissions further decline, entering a rapid decline period from 2020 to 2025, followed by a stabilization period after 2025, and dropping to 3.84 × 10⁶ t in 2035, which is 1.27 × 10⁶ t less than that of the baseline year, and 35.68% less than that of the business-as-usual scenario of the same year, with a significant effect on carbon emission suppression. The effect is remarkable, and findings indicate that the implementation of carbon reduction measures will have a good effect on the suppression of carbon emissions.
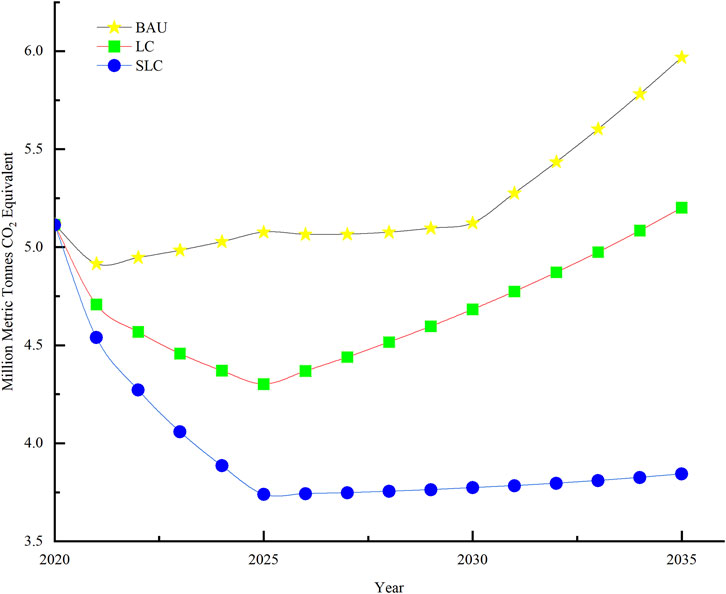
FIGURE 6. CO2 emissions under different scenarios Business-as-usual (BAU), low-carbon (LC), and strengthened low-carbon (SLC) scenarios.
To further explore the characteristics of the evolution of the medium and long-term carbon emission structure in Zhoushan City’s fishery industry, the carbon emission data of each component in the fishery industry were extracted. Figure 7 shows the composition of carbon emissions under the three scenarios. As can be seen from the figure, despite the different trends in carbon emissions, fishing vessels and aquaculture are the main sources of fishery carbon emissions under all three scenarios, accounting for more than 30% of the total carbon emissions, with a maximum share of about 50%, and the lowest carbon emissions are from feed production and the manufacture of fishing equipment and machinery.
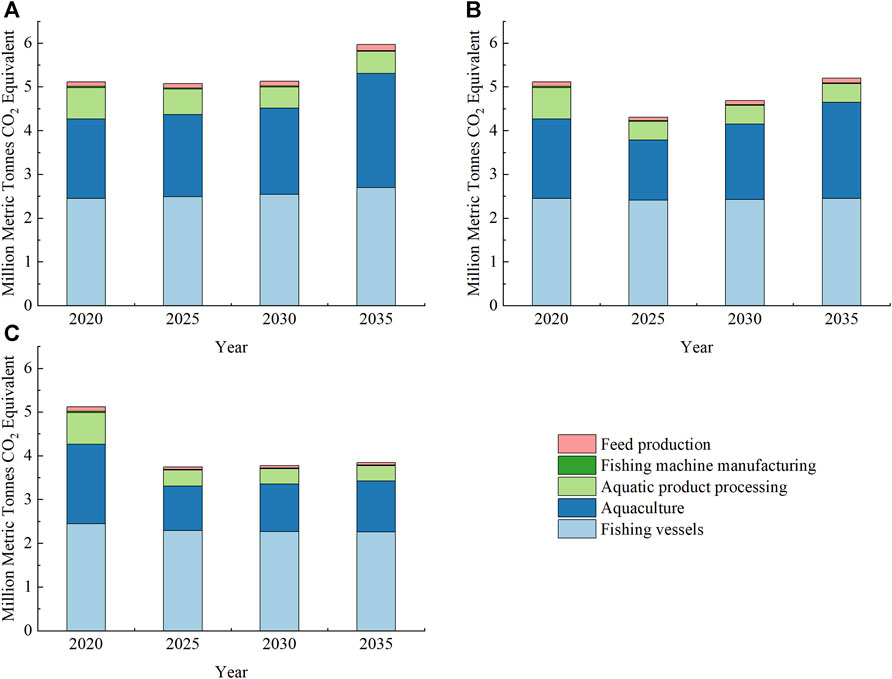
FIGURE 7. Structure of CO2 emissions under different scenarios (A) Business-as-usual (BAU), (B) low-carbon (LC), (C) strengthened low-carbon (SLC) scenarios.
3.3 Analysis of the contribution of emission reductions to carbon reduction measures
Compared with the business-as-usual scenario, the emission reduction contributions of different carbon reduction measures in Zhoushan City’s fisheries under the strengthened low-carbon scenario are shown in Figure 8. Overall, measures such as the promotion of clean energy generation, energy efficiency improvement, and the reduction of aquaculture production are of great significance to carbon reduction in Zhoushan’s fisheries. In 2025, the promotion of clean energy power generation will have the highest contribution, with carbon reduction (in terms of CO2eq) amounting to 8.57 × 10⁵ t, which can reach 55.7% of the total emission reduction in 2025; the reduction of aquaculture production will be next in importance, realizing an emission reduction of 2.86 × 10⁵ t, with an emission reduction contribution rate of 18.6%. The energy efficiency improvement and the promotion of cleaner fishing vessels will have carbon reduction contribution rates of 16% and 6.3%, respectively. Improvements in energy delivery efficiency and feed utilization will have relatively small emission reduction contribution rates at less than 5% each. In 2030, the carbon reduction due to the promotion of clean energy power generation will be 5.51 × 10⁵ t, with a decrease in carbon reduction compared to 2025, and the emission reduction contribution rate will be 34%. The emission reduction contribution rates of reducing aquaculture production, improving energy efficiency, and the promotion of cleaner fishing vessels are projected to increase compared to 2025, to 34.4%, 16.8%, and 11.2%, respectively. By 2035, the emission reduction contribution rate of reducing aquaculture production will be further increased to 37.8%; although the emission reduction contribution rate of clean energy power generation promotion will decline, it still ranks second at 27.1%. The contribution rate of energy efficiency enhancement will increase to 20.8%, and that of the promotion of cleaner fishing vessels is 11%. The emission reduction contributions of improved energy delivery efficiency and feed utilization will remain insignificant, and their emission reduction contributions will be relatively small.
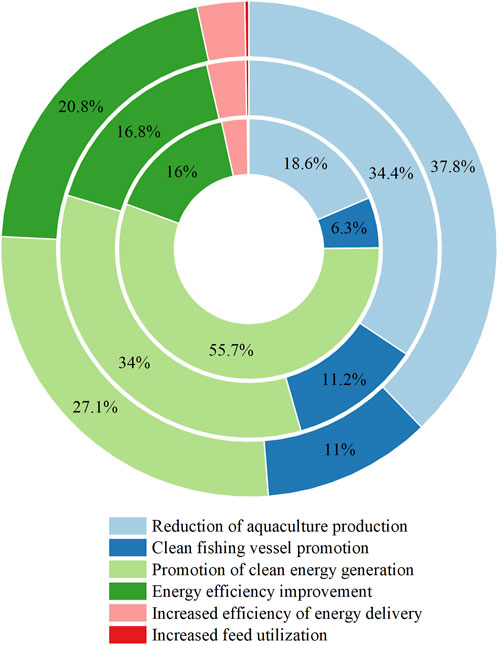
FIGURE 8. Emission reduction contribution levels of various measures under the strengthened low-carbon scenario. From inside to outside, the circles represent the years 2025, 2030, and 2035.
3.4 Energy consumption verification
In order to test the model results, the energy consumption of the Zhoushan City fishery was calculated according to the latest statistical yearbook released by Zhoushan City. According to the 2022 Statistical Yearbook, the energy consumption of fishing boats in 2021 will be 105.67 × 10⁴ t (measured in standard coal units), while it will be 74 × 104 t for aquaculture, 30.55 × 10⁴ t for aquatic product processing, 1.19 × 10⁴ t for fishing machine manufacturing, and 4.17 × 10⁴ t for feed production. In 2021, the fishery energy consumption in Zhoushan City totaled 215.58 × 10⁴ t. Table 3 shows the comparisons of the predicted and actual values of different primary energy uses by the Zhoushan fishery under the business-as-usual scenario of 2021. As can be seen from the comparison, primary energy sources whose actual energy consumption was lower than the predicted value include diesel, wind, and solar energy. The actual energy consumption of coal and water energy was greater than the predicted energy consumption. The actual value of total fishery energy consumption in 2021 was slightly lower than the predicted value, but the difference was not very large. The actual value was 7.11 × 10⁴ t lower than the predicted value, and the error percentage of both was 3.30%. The actual results are in good agreement with the predicted results.
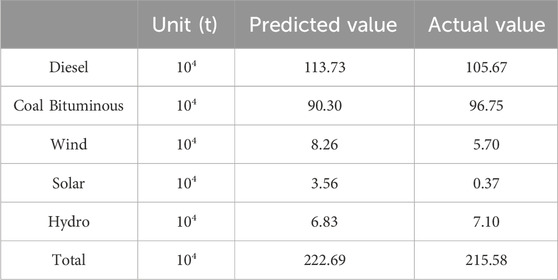
TABLE 3. Comparison of predicted and actual 2021 results.
3.5 Cost analysis of carbon reduction measures
The marginal cost of reducing CO2 emissions is an important indicator of the potential and cost of regional emission reductions, which is directly proportional to the degree of economic development. Therefore, the economy of the eastern region is more developed than those of the central and western regions with greater carbon emissions and higher costs of emission reduction (Yang et al., 2019). The marginal cost curve for emission reductions was used to evaluate the economic costs of different carbon reduction measures for the scenario of strengthened low-carbon fisheries in Zhoushan. Table 4 shows the marginal costs for different carbon reduction measures in 2035 under the strengthened low-carbon scenario. From the perspective of economic benefits, among the six carbon reduction measures analyzed, the best measure is reduction of aquaculture production, as this could save 1220.21 yuan per ton of reduced CO2 emissions. However, lower aquaculture production will also reduce the income of fishermen, and thus the potential benefits have limitations. The second measure is the increased efficiency of energy delivery that could save 84 yuan per ton of reduced CO2 emissions. The other four carbon reduction measures would incur additional emission reduction costs, and the most expensive measure would clean fishing vessel promotion, with the emission reduction cost reaching 1,855.52 yuan.t−1. This is primarily because LNG fishing vessels in China are still in the demonstration and promotion stages, as the technology is not yet mature, and thus the cost of investment is high. The emission reduction cost associated with the promotion of clean energy generation is 141.05 yuan.t−1 due to attitudes within the country and the gradual maturing of the technology. Thus, there is room for improvement in the future. The marginal costs of emission reductions from energy efficiency improvement and increased feed utilization are 59.81 yuan.t−1 and 80.11 yuan.t−1, which are medium-level values.
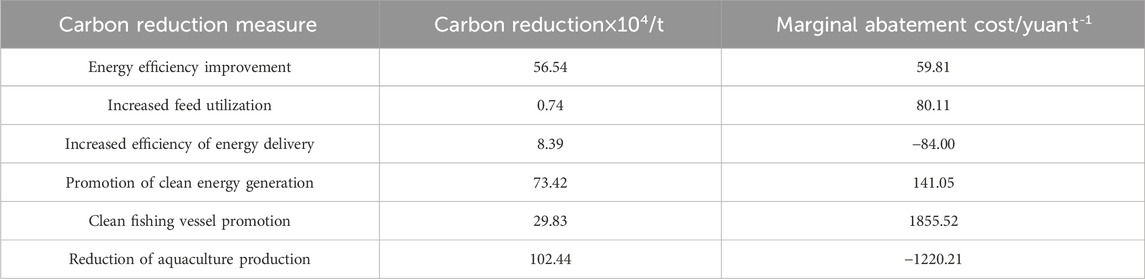
TABLE 4. Marginal costs of emission reduction using different carbon reduction measures.
4 Discussion
4.1 Factors affecting energy consumption and carbon emissions in fisheries
Zhoushan City’s fishery energy consumption under the business-as-usual scenario shows a trend of a small decrease followed by a gradual increase; under the low-carbon scenario, energy consumption is lower than in the business-as-usual scenario, and under the strengthened low-carbon scenario, energy consumption is significantly reduced and controlled, indicating that the implementation of carbon-reducing measures inhibits energy consumption. The introduction of various carbon reduction measures after 2020 is the main reason for the decrease in energy consumption, followed by an increase in energy consumption due to rapid socioeconomic development, population growth, and the consequent increased demand for fish products (Wang et al., 2020). With an emphasis on environmental protection and low-carbon development, Zhoushan City is located in the Zhejiang Province, which has issued a series of energy-saving policies to address climate change, including the 14th Five-Year Plan and the 14th Five-Year Comprehensive Energy Conservation and Emission Reduction Program (starting and ending in 2021–2025). This policy aims to strengthen the promotion of the use of clean energy for fishing vessels and promote significant improvements in energy efficiency, the development of renewable energy, and other energy-saving measures. Thus, energy consumption by fisheries is lower when carbon reduction measures are implemented than when no carbon reduction measures are implemented. Since the 15th and 16th Five-Year Plans have not yet been issued and the specific details of the policies are difficult to speculate, the overall policy of the state on energy conservation and emission reduction remains unchanged. Thus, if the “15th Five-Year Plan” and “16th Five-Year Plan” are introduced in the future, the policies related to energy conservation and emission reduction should involve the continuation and deepening of the “14th Five-Year Plan”. In this paper, according to the projection for the “14th Five-Year Plan” for 2020–2035, the trends in energy conservation and emission reduction are in line with national policies, while these trends may be more conservative than the “15th” and “16th” plans.
In terms of composition, fishing vessels and aquaculture are the main components of fishery energy consumption and CO2 emissions. In fishery production, fishing vessel equipment mainly consumes fuel oil and is highly dependent on fossil energy, with high energy consumption and CO2 emissions. Aquaculture mainly utilizes the natural conditions of the water area or region, supplemented by aquaculture equipment, and mainly consumes electric power. Although aquaculture does not consume a large amount of energy, aquaculture emits a large amount of CO2 due to its large production scale and extensive feeding methods. Shao et al. (2015) and Li et al. (2021) conducted a relevant study on the drivers of carbon emissions from the fishery industry in China, pointing out that fishery aquaculture and fishing vessels are the main sources of fishery carbon emissions. Xu et al. (2011) and others also pointed out that aquaculture and fishing accounted for 66% and 21% of the energy consumption of the fishery industry, respectively, together constituting the main component of carbon emissions from the fishery industry. In this study, the main sources of carbon emissions were fishing vessels and aquaculture, which accounted for more than 30% of carbon emissions in different scenarios. This was consistent with the results of previous studies.
From the simulation results of the carbon reduction contributions of different carbon reduction measures under the strengthened low-carbon scenario, it can be seen that the promotion of clean energy power generation, the improvement of energy efficiency, and the reduction of aquaculture production are of great significance to the reduction of carbon emissions in the fishery industry of Zhoushan City. This is mainly due to the development of clean energy power generation in Zhoushan City. Zhoushan Island is sufficiently windy, and the development of wind power in Zhoushan Island is ranked among the top in the country (Tao et al., 2017), which improves the carbon reduction effect. In addition, the energy intensity and product output are also major factors driving the energy consumption and carbon emissions (Xu et al., 2014). Improving energy efficiency and appropriately reducing the production of aquatic products can significantly reduce the carbon emissions of the Zhoushan City fishery industry.
4.2 Recommendations for future development
From the above analysis and the predictions drawn, it can be seen that in the future, with the continuous development of China’s society and economy, if effective measures are not taken, the energy consumption and carbon emissions of the fishery industry will continue to increase. Based on the current situation of Zhoushan City’s fishery industry, combining the conclusions of the scenario analysis as well as the requirements for future low-carbon development, we offer suggestions for low-carbon development of the fishery industry. Our recommendations stem from the three aspects of the energy structure: energy intensity, energy conservation, and emission reduction publicity.
(1) Optimize the energy structure and continue to promote clean energy. The results of the scenario analysis show that the type of energy consumption in Zhoushan City’s fishery industry is relatively homogeneous, with high consumption of coal and diesel fuel, both of which are non-renewable fossil energy sources. Coal emits more CO2 than other energy sources for the same calorie amount, which is not conducive to GHG emission reduction. This shows that improving the energy-use structure and establishing a consumption structure dominated by green energy is of great significance to energy conservation and emission reduction in the fishery industry. Therefore, to reduce carbon emissions, we should accelerate the construction of a long-term energy system with clean energy as the main source. In addition, clean energy fishing vessels should be gradually introduced to replace traditional high-energy-consumption diesel vessels, forming a green and clean mode of operation. Finally, we should give full play to the advantages of seaside provinces, accelerate the construction of wind power generators, and rationally utilize renewable energy sources such as tidal and wave energy to achieve the sustainable development of the fisheries industry.
(2) Improve the implementation of energy intensity and total energy control, and promote the further improvement of energy efficiency. The results of the analysis of the contributions to emission reduction show that energy efficiency improvement has obvious potential for emission reduction, and that technological research and development efforts have been intensified to reduce the energy intensity of the terminal sector and continue to promote energy conservation and consumption reduction in the terminal sector. Efforts should be made to encourage and support fishermen to install fuel-saving equipment on fishing vessels, increase subsidies for energy-saving marine diesel engines, strengthen the promotion of clean energy applications on ships, implement a mandatory scrapping system for ships, further strengthen the control of high-emission ships, and reduce the total amount of energy.
(3) Publicize the significance of energy conservation and emission reduction in the fisheries industry and enhance fishermen’s awareness of energy conservation and low-carbon goals. Policy guidance and government support should play a guiding role in industry management, promote the improvement of the fishery energy-saving and emission reduction technology level, guide enterprises to accelerate the research, development, and production of energy-saving equipment, educate fishermen on how energy-saving equipment can improve their quality of life and protect the environment through publicity and practice, and cultivate standardized fishing operation methods and habits to increase the awareness of energy-saving and emission reduction goals.
5 Conclusion
By constructing the Zhoushan City LEAP-fishery model and designing a business-as-usual scenario, a low-carbon scenario, and a strengthened low-carbon scenario, this study simulated and predicted the trend of energy consumption and carbon emission of the Zhoushan City fishery industry from 2021 through 2035. The conclusions were as follows:
(1) The future energy consumption of Zhoushan City’s fisheries industry under the business-as-usual scenario shows an overall growth trend, and the composition of energy consumption in all scenarios is mainly dominated by fossil energy. Diesel and coal the most dominant forms of energy demand under all three scenarios, accounting for 38.94% and 37.38% of total energy consumption in 2035 under the business-as-usual scenario, respectively. Compared with the business-as-usual scenario, the energy-saving effect of the carbon reduction measures under the low-carbon scenario and the strengthened low-carbon scenario is enhanced, and the strengthened low-carbon scenario will save 28.97% of energy in 2035 compared with the same year in the business-as-usual scenario, which is about 9.3 × 10⁵ t of standard coal.
(2) In terms of the structure of end-use energy consumption, fishing vessels and aquaculture consume the most energy, with their combined energy consumption exceeding 30% of the total energy consumption in all scenarios and years.
(3) With the change in energy consumption, the CO2 emissions of fisheries are also changing year by year. Taken together, carbon emissions and energy consumption show a positive correlation, and carbon reduction measures have an effect on carbon emission suppression.
(4) Among the various carbon reduction measures under the strengthened low-carbon scenario, all the carbon reduction measures considered can reduce CO2 emissions. The promotion of clean energy power generation, energy efficiency enhancement, and the reduction of aquaculture production play key roles in the low-carbon development of the fishery industry, contributing to 27.1%, 20.8%, and 37.8% of carbon emission reduction by 2035, respectively. The enhancement of energy delivery efficiency and improvement of the utilization rate of feedstuffs have relatively small emission reduction contributions, with both contributing to less than 5% of emission reduction. The economic analysis of carbon reduction measures under the strengthened low-carbon scenario shows that reduction of aquaculture production has economic benefits though carbon reduction, but there are several limitations. The second is the increased efficiency of energy delivery, but the potential for emission reductions is only average. The most expensive measure is the clean fishing vessel promotion, as LNG fishing vessels represent an emerging technology that is not yet mature, resulting in the investment cost being high. Due to the national promotion of clean energy generation and the gradual maturity of technology, the cost of emission reduction still has a large room for improvement in the future. Therefore, the proposed measures are significant for the realization of low-carbon development in the long run.
(5) Based on the results of the scenario analysis and prediction, our recommendations for the future low-carbon development of the fishery industry include optimizing the energy structure, continuously promoting energy cleanliness, improving the implementation of the control of energy intensity and the total amount of energy, and strengthening the publicity regarding energy conservation and emission reduction.
Data availability statement
The original contributions presented in the study are included in the article/Supplementary Material, further inquiries can be directed to the corresponding author.
Author contributions
XX: Data curation, Software, Writing–original draft. FG: Formal Analysis, Project administration, Supervision, Writing–review and editing. SZ: Conceptualization, Methodology, Supervision, Writing–review and editing.
Funding
The author(s) declare financial support was received for the research, authorship, and/or publication of this article. This work was funded by the National Key R&D Program of China (No. 2019YFD0901204); the Fundamental Research Funds for Zhejiang Provincial Universities and Research Institutes (No. 2021JD006); and the Key R&D Program of Zhejiang Province (No. 2019C02056).
Acknowledgments
We thank LetPub (www.letpub.com) for its linguistic assistance during the preparation of this manuscript.
Conflict of interest
The authors declare that the research was conducted in the absence of any commercial or financial relationships that could be construed as a potential conflict of interest.
Publisher’s note
All claims expressed in this article are solely those of the authors and do not necessarily represent those of their affiliated organizations, or those of the publisher, the editors and the reviewers. Any product that may be evaluated in this article, or claim that may be made by its manufacturer, is not guaranteed or endorsed by the publisher.
References
Algehed, J., Wirsenius, S., and Joensson, J. (2009). Modelling energy efficiency and carbon dioxide emissions in energy-intensive industry under stringent CO2 policies: comparison of top-down and bottom-up approaches and evaluation of usefulness to policy makers.
Amo-Aidoo, A., Kumi, E. N., Hensel, O., Korese, J. K., and Sturm, B. (2022). Solar energy policy implementation in Ghana: a LEAP model analysis. Sci. Afr. 16, e01162. doi:10.1016/j.sciaf.2022.e01162
Cai, L., Luo, J., Wang, M., Guo, J., Duan, J., Li, J., et al. (2023). Pathways for municipalities to achieve carbon emission peak and carbon neutrality: a study based on the leap model. Energy 262, 125435. doi:10.1016/j.energy.2022.125435
Cai, L. Y., Guo, J. F., Shi, C., Wang, H. B., Zhu, R. Q., Niu, Y., et al. (2023). Simulation research on the evolution pathway planning of energy supply and demand in China under the dual carbon targets. 1–19. [2023-09-15]Available at: http://kns.cnki.net/kcms/detail/11.5368.P.20230711.1311.002.html.
Chen, D. (2023). Analysis of influence factors of marine fishery industry structure optimization on carbon emission efficiency based on depth feedforward model. J. Exp. Nanosci. 18 (1), 2174696. doi:10.1080/17458080.2023.2174696
Di, Q. B., Chen, X. L., Su, Z. X., and Sun, K. (2023). Research on regional disparities in carbon emission efficiency and carbon emission reduction potential of China's marine fisheries under the “Dual-Carbon” target. Mar. Environ. Sci. 42 (01), 29–37. doi:10.13634/j.cnki.mes.2023.01.020
Dong, K. Y. (2019). Transition path of China's energy consumption structure and its optimization model in a low-carbon context. Beijing: China University of Petroleum.
Du, H. B., Zhao, L. J., Liu, C. W., Qiu, K. B., Li, H. D., et al. (2022). Prediction of peaking carbon dioxide emissions in main city areas based on LEAP model and KAYA model and analyses on its uncertainty. J. Ecol. Rural Environ. 38 (08), 983–991. doi:10.19741/j.issn.1673-4831.2022.0205
Duan, M., Xiang, D. X., Lu, T. F., Wang, B., Ma, C., Wang, R., et al. (2016). Analysis of carbon emission reduction potential and abatement cost in iron and steel sector of wuhan. China's Popul. · Resour. Environ. 26 (S1), 41–44.
Emodi, N. V., Emodi, C. C., Murthy, G. P., and Emodi, A. S. A. (2017). Energy policy for low carbon development in Nigeria: a LEAP model application. Renew. Sustain. Energy Rev. 68, 247–261. doi:10.1016/j.rser.2016.09.118
Federici, S., Tubiello, F. N., Salvatore, M., Jacobs, H., and Schmidhuber, J. (2015). New estimates of CO2 forest emissions and removals: 1990–2015. For. Ecol. Manag. 352, 89–98. doi:10.1016/j.foreco.2015.04.022
Fu, X. (2022). Viewpoints on the experiences and challenges of fishery energy internet. Front. Energy Res. 10, 884920. doi:10.3389/fenrg.2022.884920
Gao, Y., Fu, Z. W., and Zhang, Z. M. (2022). Analysis and prediction of carbon emission reduction potential of marine fishery in China. J. Guangdong Ocean Univ. 42 (03), 39–44.
General Office of the People's (2023). General office of the people's government of Zhejiang province on the issuance of energy development in Zhejiang province, "14th five-year plan" notice [EB/OL]. https://www.zj.gov.cn/art/2022/5/19/art_1229505857_2404396.html.
Greer, K., Zeller, D., Woroniak, J., Coulter, A., Winchester, M., Palomares, M. D., et al. (2019). Global trends in carbon dioxide (CO2) emissions from fuel combustion in marine fisheries from 1950 to 2016. Mar. Policy 107, 103382. doi:10.1016/j.marpol.2018.12.001
Gu, H. T., Ni, Q., Wu, S. S., Zhong, W., and Han, M. X. (2023). Analysis of energy consumption difference of traditional aeration equipment in aquaculture. Mod. Agric. Equip. 44 (02), 51–56+61.
Hong, S., Chung, Y., Kim, J., and Chun, D. (2016). Analysis on the level of contribution to the national greenhouse gas reduction target in Korean transportation sector using LEAP model. Renew. Sustain. Energy Rev. 60, 549–559. doi:10.1016/j.rser.2015.12.164
Huang, Y., Bor, Y. J., and Peng, C. Y. (2011). The long-term forecast of Taiwan’s energy supply and demand: LEAP model application. Energy policy 39 (11), 6790–6803. doi:10.1016/j.enpol.2010.10.023
Jacobsen, H. K. (1998). Integrating the bottom-up and top-down approach to energy–economy modelling: the case of Denmark. Energy Econ. 20 (4), 443–461. doi:10.1016/s0140-9883(98)00002-4
Kiani, A. (2017). Electric vehicle market penetration impact on transport-energy-greenhouse gas emissions nexus: a case study of United Arab Emirates. J. Clean. Prod. 168, 386–398. doi:10.1016/j.jclepro.2017.08.242
Li, C., Feng, W., and Shao, G. L. (2018). Spatio-temporal difference of total carbon emission efficiency of fishery in China. Econ. Geogr. 38 (05), 179–187. doi:10.15957/j.cnki.jjdl.2018.05.022
Li, C., Li, H. Y., Kong, H. Z., and Feng, W. (2021). Structural characteristics and driving factors of embodied carbon emissions from fishery production system in China. Resour. Sci. 43 (06), 1166–1177. doi:10.18402/resci.2021.06.09
Li, M., Feng, K., Zheng, H., Pan, C., Meng, J., Li, J., et al. (2021). Supply chain effects of China’s fast-growing marine economy on greenhouse gas emissions. Environ. Res. Lett. 16 (5), 054061. doi:10.1088/1748-9326/abf192
Li, Y., Du, Q., Lu, X., Wu, J., and Han, X. (2019). Relationship between the development and CO2 emissions of transport sector in China. Transp. Res. Part D Transp. Environ. 74, 1–14. doi:10.1016/j.trd.2019.07.011
Liang, S., Lin, X., Liu, X., and Pan, H. (2022). The pathway to China’s carbon neutrality based on an endogenous technology cge model. Int. J. Environ. Res. Public Health 19 (10), 6251. doi:10.3390/ijerph19106251
Liu, G., Xu, Y., Ge, W., Yang, X., Su, X., Shen, B., et al. (2023). How can marine fishery enable low carbon development in China? Based on system dynamics simulation analysis. Ocean Coast. Manag. 231, 106382. doi:10.1016/j.ocecoaman.2022.106382
Liu, G. W. (2016). Research on the model and application of sector final energy consumption. Beijing: China University of Geosciences.
Liu, G. Y., Guo, L. S., Chen, Y., Yan, N., Meng, F., Li, H., et al. (2023). Marginal abatement cost analysis of urban carbon neutralization measures: taking Beijing as a case. J. Beijing Normal Univ. Nat. Sci. Ed. 59 (02), 249–259.
Liu, H., and Che, X. (2010). Elementary study on evaluation of CO2 emissions from aquaculture in China. South. Coast Fish. 6 (04), 77–80.
Liu, R., and Yao, X. L. (2021). Study on the realizing path of carbon neutrality in power sector of Shanxi province. China coal. 47 (08), 8–16. doi:10.19880/j.cnki.ccm.2021.08.002
Ma, G. H., Zhang, Y. C., and Yao, F. B. (2022). Study on the driving factors of carbon emission of fishery economy in China-dual perspective analysis based on LMDI and decoupling model. J. Qingdao Univ. Nat. Sci. Ed. 35 (01), 117–123.
Mai, K. S. (2016). China's aquaculture, feed raw materials and world fishery resources. Feed Livest. (06), 17–19.
Mirjat, N. H., Uqaili, M. A., Harijan, K., Walasai, G. D., Mondal, M. A. H., and Sahin, H. (2018). Long-term electricity demand forecast and supply side scenarios for Pakistan (2015–2050): a LEAP model application for policy analysis. Energy 165, 512–526. doi:10.1016/j.energy.2018.10.012
Nasir, R., Ahmad, S. R., and Shahid, M. (2021). Emission reduction energy model of Punjab: a case study. J. Clean. Prod. 329, 129755. doi:10.1016/j.jclepro.2021.129755
Nieves, J. A., Aristizábal, A. J., Dyner, I., Báez, O., and Ospina, D. H. (2019). Energy demand and greenhouse gas emissions analysis in Colombia: a LEAP model application. Energy 169, 380–397. doi:10.1016/j.energy.2018.12.051
Parks, N. (2009). UN update: climate change hitting sooner and stronger. Environmental Science and Technology. doi:10.1021/es903062g
Peng, B. B., Du, H. B., Ma, S. F., and Liu, L. L. (2014). Road vehicle energy consumption and emissions based on LEAP model. J. Wuhan Univ. Technol. 36 (05), 654–657+662. Information and Management Engineering Edition.
Provincial Development and Reform (2023). Provincial development and reform commission provincial department of ecology and environment on the issuance of "Zhejiang province to cope with climate change "14th five-year plan" notice [EB/OL]. https://www.zj.gov.cn/art/2021/6/16/art_1229505857_2305563.html.
Ringkjøb, H. K., Haugan, P. M., and Solbrekke, I. M. (2018). A review of modelling tools for energy and electricity systems with large shares of variable renewables. Renew. Sustain. Energy Rev. 96, 440–459. doi:10.1016/j.rser.2018.08.002
Shahid, M., Ullah, K., Imran, K., Mahmood, A., and Arentsen, M. (2021). LEAP simulated economic evaluation of sustainable scenarios to fulfill the regional electricity demand in Pakistan. Sustain. Energy Technol. Assessments 46, 101292. doi:10.1016/j.seta.2021.101292
Shao, G. L., Kong, H. Z., Yu, J. K., and Li, C. (2015). Decomposition study of carbon emission drivers of China's marine fisheries based on the LMDI method. Agric. Technol. Econ. (06), 119–128. doi:10.13246/j.cnki.jae.2015.06.013
Tao, C., Miao, J. X., Yang, Y., and Shi, Y. M. (2017). Zhoushan wind power status and development. Rural Econ. Technol. 28 (16), 16–17.
Vieira, A. S., Stewart, R. A., Lamberts, R., and Beal, C. D. (2020). Renewable energy and energy conservation area policy (REECAP) framework: a novel methodology for bottom-up and top-down principles integration. Energy Strategy Rev. 32, 100544. doi:10.1016/j.esr.2020.100544
Wang, J., Li, Y., and Zhang, Y. (2022). Research on carbon emissions of road traffic in Chengdu city based on a LEAP model. Sustainability 14 (9), 5625. doi:10.3390/su14095625
Wang, M., Lu, K., Song, W., and Zhang, Y. (2020). Optimization and upgrading of marine fishery industry under the background of rural revitalization strategy IOP Conference Series: earth and Environmental Science. IOP Publ. 510 (3), 032016. doi:10.1088/1755-1315/510/3/032016
Wu, Q., Ma, H., Ren, H. B., Guo, M. K., Chen, P., and Li, Q. F. (2023). Medium and long-term carbon emission projections and emission reduction potential analysis of lingang special area based on the LEAP model [J/OL]. Environ. Sci., 1–17. doi:10.13227/j.hjkx.202301093
Xu, D. L., and Wang, Y. J. (2015). Regional differences and influencing factors of China's coastal fishery carbon productivity. J. China Agric. Univ. 20 (02), 284–290.
Xu, H., Liu, H., Zhang, J. H., Ni, Q., Sheng, J., and Jiang, L. (2007). Measurement of energy consumption in China's fisheries. Chin. Aquat. Prod. 11, 74–76+78.
Xu, H., Zhang, Z. L., Zhang, J. H., Liu, H., Zhao, P., Shi, R., et al. (2011). The research and development proposals on fishery energy saving and emission reduction in China. J. Aquatic Sci. 35 (03), 472–480.
Xu, H., Zhang, Z. L., and Zhao, P. (2009). Survey and analysis of energy consumption of fishing vessels in China. Chin. Aquat. Prod. (09), 5–7.
Xu, Q., Weng, S. J., and Li, Y. (2017). Energy consumption and carbon emission of motor fishing vessels in hainan province. Trop. Agric. Eng. 41 (03), 20–25.
Xu, Y. X., Zhou, R., and Wang, X. J. (2014). Decomposition analysis of the fishery industry energy consumption of dongmem Island ZHEJIANG province. Fudan J. 53 (06), 752–757+763. Natural Science Edition.
Yan, D., Liu, F., Ye, P. F., Fu, B. R., Song, Y. T., Zhang, G. H., et al. (2021). Main methods and models for peak carbon scenario projections. Environ. Prot. Circular Econ. 41 (07), 97–101.
Yang, D., Liu, D., Huang, A., Lin, J., and Xu, L. (2021). Critical transformation pathways and socio-environmental benefits of energy substitution using a LEAP scenario modeling. Renew. Sustain. Energy Rev. 135, 110116. doi:10.1016/j.rser.2020.110116
Yang, F., Zhang, G. C., Sun, J., Xie, F. J., Chuai, X. W., and Sun, R. L. (2023). Study of peak carbon emission of a city in yangtze river delta based on LEAP model[J/OL]. Environ. Sci., 1–19. doi:10.13227/j.hjkx.202301129
Yang, Z. H., Chen, L. X., and Luo, T. (2019). Marginal cost of emission reduction and regional differences. J. Manag. Sci. 22 (02), 1–21.
Yue, D. D., Wang, L. M., Ruan, W., and Ji, W. W. (2014). Time series analysis and factor decomposition of greenhouse gas emissions of marine fishing in China. Yangtze River Basin Resour. Environ. 23 (08), 1057–1063.
Yue, D. D., Wang, L. M., Wang, D. W., Zhou, Y. S., and Geng, R. (2013). Influencing factors of marine fishing fuel consumption in Changdao County. Fish. Inf. strategy 28 (04), 279–284. doi:10.13233/j.cnki.fishis.2013.04.005
Zhang, Z. L. (2010). “Study on greenhouse gas emissions from fishing vessels in China”, in Department of Science and Technology Education, Ministry of Agriculture. Developing low-carbon agriculture to address climate change——Proceedings of the Workshop on Low Carbon Agriculture. China Agricultural Publishing House, 5.
Zhang, Z. L., Wang, W., and He, Y. P. (2010). Estimation of carbon emissions from fishing vessel operations in China. J. Shanghai Ocean Univ. 19 (06), 848–852.
Zhejiang Provincial People's (2022). Zhejiang Provincial People's Government on the issuance of Zhejiang Province, "14th Five-Year" energy saving and emission reduction comprehensive work program notice [EB/OL], Available at: https://www.zj.gov.cn/art/2022/8/29/art_1229505857_2421999.html.
Keywords: fishery, energy consumption, carbon emissions, long-range energy alternatives planning system model, emission reduction contribution
Citation: Xu X, Gui F and Zhao S (2024) Simulation of fishery energy consumption and carbon emissions in Zhoushan City based on the long-range energy alternatives planning system model. Front. Energy Res. 11:1319915. doi: 10.3389/fenrg.2023.1319915
Received: 11 October 2023; Accepted: 27 December 2023;
Published: 10 January 2024.
Edited by:
Nan Yang, China Three Gorges University, ChinaReviewed by:
Wei Dai, Guangxi University, ChinaHadi Farabi-Asl, Chalmers University of Technology, Sweden
Ran Li, Shanghai Jiao Tong University, China
Copyright © 2024 Xu, Gui and Zhao. This is an open-access article distributed under the terms of the Creative Commons Attribution License (CC BY). The use, distribution or reproduction in other forums is permitted, provided the original author(s) and the copyright owner(s) are credited and that the original publication in this journal is cited, in accordance with accepted academic practice. No use, distribution or reproduction is permitted which does not comply with these terms.
*Correspondence: Sheng Zhao, emhhb3NoQHpqb3UuZWR1LmNu