 Yuanyuan Zhao
 Guang Li1
 Chaobin Dang
- 1Department of Energy and Power Engineering, Ludong University, Yantai, China
- 2Graduate School of Engineering, University of Fukui, Fukui, Japan
Loop Heat Pipes (LHPs) are efficient heat transfer devices, providing a highly efficient and energy-saving thermal control integrated management method for Unmanned Aerial Vehicles (UAVs) with their flexible structural design. In this paper, a conceptual design of LHP anti-icing system was proposed, using LHP to transfer waste heat to wing’s leading edge. The outer surface temperature of wing skin is one of the main indicators to measure the anti-icing effect. As a result, this paper mainly focused on the heat transfer process of the condenser section by experimental and numerical simulation methods. A stainless steel-nickel LHP was fabricated and tested at different conditions. Volume of Fluid (VOF) method and Lee model were adopted to simulate the condensation process. Results showed that increasing the heating power (from 35 W to 60 W) slowed down the condensation and lengthened the two-phase zone. However, when the angle of attack changes within the range of 0°–10°, the liquid-vapor distribution in the tube remains almost unchanged. The average error of surface temperature between experiment and simulation results is 3.6% and 2.5% for the heating power of 180 W and 60 W respectively. Additionally, because the volume of water droplets collected is the largest at the leading edge of the wing, we recommend arranging the LHP condenser tube inlet near the leading edge of the wing and increasing the density of pipe arrangement to achieve better anti-icing effect.
1 Introduction
An effective anti-icing/de-icing system is essential to ensure flight safety, as ice can accumulate on the leading edge of wings or the engine lip when an aircraft encounters clouds containing super-cooled droplets. Thermal methods, such as engine bleed air (Khalil et al., 2020) and electro-thermal pads (Wallisch and Hann, 2022), require a significant amount of engine bleed air or electricity, which can lead to onboard energy deficiency, especially for Unmanned Aerial Vehicles (UAVs). However, some other systems, such as airborne electronic equipment (Park et al., 2010) or lubrication oil with high temperature, generate excess waste heat which can exceed their temperature thresholds, penalizing aircraft safety. In this regard, Loop Heat Pipes (LHPs) represent a highly appealing solution that could be employed to address the contradictory thermal controlling demand effectively.
LHPs are passive closed two-phase heat transfer devices, using the vapor-liquid phase change of working fluid to transfer heat and the capillary force of fine-pored porous wick to circulate the working fluid with no extra power input (Juan Pablo and Mantelli, 2017). With the development of More Electric Aircraft (MEA) and aerospace technology, LHPs are gradually being widely used in the thermal control systems of aircraft and space (Hodot et al., 2016). In the case of anti-icing, cold air with super-cooled water droplets supplies cold source to the working fluid inside the LHP. In the operation process of the LHP anti-icing system, the superheated vapor with high temperature and high pressure enters the condenser and gradually releases sensible and latent heat under the cooling effect of air and water droplets. The impinging water droplets on the surface are heated, raising their temperature above the freezing point, and preventing ice formation. At the first beginning, LHPs were utilized for the anti-icing/de-icing purpose in the engine inlet. In 1995, a conceptual design was proposed by Anderson and Chow (Anderson and Chow, 1995), using LHP to extract heat from the air-oil cooler to prevent ice formation. Then, Philips et al. (Phillips and Nelson, 1998; Phillips and Kevin, 2000) developed a LHP anti-icing system for the “Global Hawk” UAV which utilized four distribution heat pipes and one transfer heat pipe, with ammonia as the working fluid. They conducted experiments in the icing wind tunnel with different temperature. Comparison results showed that when the LHP system was on, ice accumulation on the surface of the engine cowl was significantly reduced at the temperature of −20°C and there was no ice formation at the temperature of −5°C, indicating that LHP could effectively achieve the anti-icing and de-icing purpose.
The complex and changeable flight environment of UAVs makes the normal operation of LHP face challenges, such as the ambient temperature that changes with the altitude, flight accelerations up to 10 g (Yerkes et al., 2014), and mechanical vibrations with frequencies up to 2000 Hz (Fred et al., 1998; Holman et al., 2020). The low-temperature environment imposes high demands on the material selection for LHPs. Research of Filippo Pagnoni et al., 2021 found out that when exposed to a cold environment, the sintered titanium wick showed excellent mechanical resistance to repeated cycles of water freeze/thaw. For thermal management of electronics, various types of heat pipes have been developed such as flat heat pipes (Wang et al., 2023), pulsating heat pipes (Cai et al., 2015; Alhuyi Nazari et al., 2018) and vapor chamber (Jones and Chen, 2015). For heat dissipation applications, water is one of the most commonly used working fluid due to its high heat transfer coefficient, chemical stability and low cost. However, when it comes to anti-icing/de-icing situation, water freezes when the temperature is below 0°C, which will impede the normal circulation flow of the working fluid. To solve this problem, for the comprehensive utilization of energy in thermal control systems, acetone, methanol, and ethanol can be better choice due to their lower freezing point (Accorinti et al., 2019). Based on the research of Becker et al. (Becker et al., 2011) and Su et al., 2019, flight accelerations may have diverse impacts on the start-up process and operational behavior of the LHP anti-icing system, thereby imposing elevated demands on the LHP’s reliability and operational stability. Both the acceleration and the heat load can cause localized dry out phenomenon (Fleming et al., 2010).
The heat transfer performance of condenser, such as the outer surface temperature, is an important parameter for evaluating the anti-icing effect. Due to the complex flight environment of UAVs, the surface temperature of the skin is affected by complicated heat transfer processes inside and outside the aircraft skin, as shown in Figure 1. Outside the skin, there are convective heat dissipation, pneumatic heating, kinetic energy of water droplets, cooling by water droplets, and evaporative heat loss. Inside the skin, there are latent and sensible heat released by working fluid. Pneumatic heating and kinetic energy of water droplets will positively impact anti-icing results, whereas convection and water droplet evaporation will have a negative impact. Based on the state of working fluid, the condenser pipeline can be divided into three parts: vapor zone, two-phase zone, and liquid zone, as shown in Figure 1. Research has shown that the amount of latent heat released during the condensation process is much higher than the amount of sensible heat (Cao et al., 2020). When designing the system, it is crucial to ensure that the working fluid is fully condensed into a liquid state before it exits the condenser to achieve maximum heat release. Eventual failure of the loop is observed, where a significant amount of vapor bubbles return through the liquid line (Parker et al., 2005). As a result, it is necessary to investigate heat transfer performance of the condensation process.
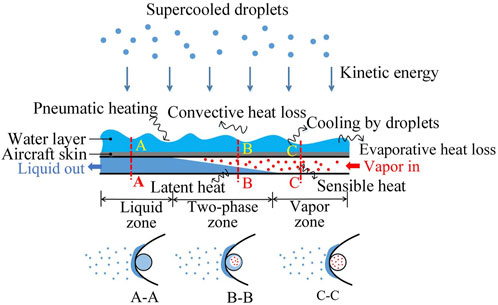
FIGURE 1. Schematic of the heat transfer processes in the condenser of LHP anti-icing system.
The distribution or flow pattern of vapor-liquid two-phase inside the pipe is an important factor that affects the condensation heat transfer and pressure drop. Existing studies have found that there are mainly six types of flow patterns inside the pipe: bubble flow, plug flow, slug flow, stratified flow, wavy stratified flow, and annular flow (Wang et al., 2018). With the condensation process and the transformation of flow patterns, the equivalent liquid film in the tube gradually thickens, and the heat conduction resistance increases, which eventually leads to a decrease in the heat transfer coefficient (Kruzel et al., 2020). At present, scholars have investigated factors such as flow pattern, physical properties (Bohdal et al., 2019), pipe diameter (Klahm et al., 2010), and mass flow rate (Chun and Seon-Oh, 2000), and have established a relatively comprehensive flow pattern for the condensation heat transfer and pressure drop of single component (Dorao and Fernandino, 2022) and multi-component (He et al., 2020) working fluids in horizontal pipes. To enhance the condensation performance, the inner surface of the pipe can be modified using surface modification techniques to reduce the thermal resistance of the liquid film, which can be achieved by adding different types of fins (Ho et al., 2019), grooves (Stallbaumer-Cyr et al., 2022), or inserts (Ahmadi Moghaddam et al., 2020). This can increase the effective heat transfer area, increase the disturbance effect on the flow, and make the liquid generate centrifugal force to accelerate the transition of the flow pattern inside the tube from stratified flow to annular flow.
In this research, both the simulation and the experiment of the LHP anti-icing system are conducted. Steel-ethanol combination and the nickel wick are chosen for the present investigation. A wind tunnel was employed to simulate the flight conditions (air velocity, angle of attack) and the meteorological conditions (environment temperature, Liquid Water Content, droplet diameter) which could affect the anti-icing results. The research of Ref. (Zhao et al., 2017). is Part 1 of the whole study, which investigated the start-up and the operating characteristics of the designed DCCLHP through experimental methods, mainly focusing on the startup time, surface temperature and thermal resistance of the DCCLHP anti-icing system in the dry air environment. Due to the visualization design, it was easy to observe the liquid-vapor distribution in the two compensation chambers. However, it is quite difficult to carry out visual design for the condenser section, whose thermal characteristics is important for measuring the anti-icing performance of the whole system. Due to the reasons above, we conducted the research of this study, which is Part 2 of the whole investigation, focusing on the anti-icing effect of the system in the wet air and cold environment through numerical methods. The Volume of Fluid (VOF) model and the Lee model are used to simulate condensation process of the multi-phase flow inside the pipe. This study compared the experimental and computational results of the wing’s surface temperature. Results can provide some meaningful references for the design of the LHP anti-icing system.
2 Experimental set-up and procedures
An experimental prototype and image of the LHP anti-icing system as shown in Figure 2 was constructed to carry out the present investigation. Table 1 shows the geometric characteristics of each component. Other detailed information of this prototype and the test system is referred in Ref. (Zhao et al., 2017). The whole LHP anti-icing system includes evaporator, condenser, vapor line, liquid line, and compensation chamber (CC). To ensure sufficient supply of the working fluid from the CC to the wick in the evaporator, even under variable flight attitudes, 2 CCs located at both ends of the evaporator were designed with visual transparency to allow observation of the internal working fluid phase distribution during system operation. The experiments were carried out in a wind tunnel with different air velocity, angle of attack and heating power. On the wing skin’s surface, seven T-type thermocouples were set along the chord direction to record the surface temperature. T6 is the surface temperature of the stagnation point. The distance between each thermocouple is 20 mm along the chord direction on the surface (Zhao et al., 2017).
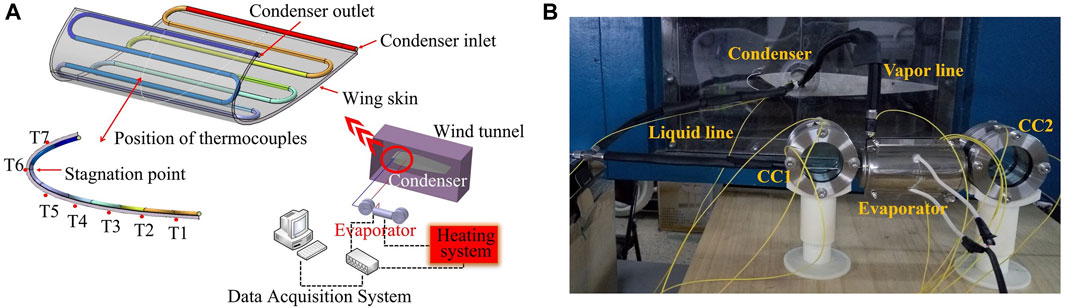
FIGURE 2. (A) Schematic and (B) Image of the LHP anti-icing system.

TABLE 1. LHP geometric characteristics.
Data reduction and uncertainty analysis:
Thermal resistance is generally utilized to evaluate the heat transfer efficiency of the LHP, which is defined as:
Where R is the thermal resistance; Te is the temperature of the evaporator, which is assumed to be equal to the temperature of the evaporator outlet Te_out, as shown in Eq. 2; Tcond is the temperature of the condenser, which is calculated as the mean temperature of the condenser inlet Tcond_in and the outlet Tcond_out, as shown in Eq. 3; Q is the heat load attached to the evaporator, which is calculated by multiplying the current I and the voltage U, as shown in Eq. 4.
Standard uncertainty of the heat load can be calculated as:
Where the accuracy grade of the ammeter and the voltmeter is δ = 1.5%. When the heat load is set to be 100W, the corresponding voltage and current values are U = 91V and I = 1.1A respectively. The ranges of the voltmeter and ammeter are U′ = 250 V and I′ = 3.0A respectively.
The measurement of temperature, current and voltage is the main source of the uncertainty of the thermal resistance R. Finally, the standard uncertainty for R can be obtained by:
Where ∆Te and ∆Tc are the accuracy of the thermocouples, which is taken as ±0.5°C in this investigation. (Te–Tc)min is the minimum temperature difference between the evaporator and the condenser, and the value is 32.4°C.
3 Model and parameter settings
This study uses steady-state calculations, focusing on the location of the two-phase region, the vapor-liquid distribution, and the outer surface temperature of the skin. The following assumptions are made.
(1) Fluids are incompressible.
(2) Physical parameters (density, specific heat capacity, thermal conductivity, and viscosity), surface tension and latent heat are constant.
(3) The mass transfer process occurs only at the vapor-liquid interface.
(4) The temperature at the vapor-liquid interface is equal to the vapor’s saturation temperature.
(5) The effect of gravity is considered.
3.1 Simulation model
In this section, the Volume of Fluid (VOF) method combined with the Lee model is utilized to investigate the temperature distribution of the skin’s outer surface and the phase distribution of the fluid in the LHP condenser. In 1981, Hirt and Nichols (Hirt and D Nichols, 1981) proposed VOF model, which was one of the important methods for numerical simulation of moving interface tracking under fixed Euler grid. The main feature is to define the fluid volume function in the space grid and use the fluid volume function to reconstruct and obtain the accurate position of the moving interface. The defined phase function takes a value of 1 in one fluid and a value of 0 in the other fluid. The location of the phase interface is then determined by the value of the phase function between 0 and 1. The basic control equations are as follows.
Fluid volume function equation:
Where αi is the volume portion of the ith phase,
Momentum equation:
Energy equation:
In Eq. 10 and Eq. 11, E, sensible energy, is treated as mass-averaged variable in the VOF model:
Where Ev and El are based on the specific heat of vapor/liquid phase and the shared temperature respectively; kveff and kleff are the effective heat conductivities of vapor phase and liquid phase respectively. Sh is a custom source item, which is imported by combining the phase change model. The most widely used phase change model for VOF modeling of condensation heat and mass transfer is the Lee model, which assumes that phase change is driven by the difference between the interface temperature and the saturation temperature. The mass transfer source term corresponding to the vapor-liquid phase interface in the condensation process is described as follows:
Where ml and mv are the mass diffusivity of liquid and vapor phase respectively, kg/(m3∙s); αv is the volume ratio of vapor phase in VOF model; r is the factor that controls the phase transition intensity, whose value is set based on maintaining the temperature of the calculation grid containing the liquid-vapor interface at the saturation temperature. For the condensation problem inside the pipe, the temperature of the liquid-vapor interface is set to be the saturation temperature Tsat.
Surface tension arises from an imbalance of attractive forces between the molecules of a fluid. The influence of surface tension is crucial for tracking interface problems. The continuous surface tension model is used in VOF, and its basic idea is converting the area integral of the surface tension on the vapor-liquid interface into a volume integral according to the divergence theorem, then adding this volume force to the momentum equation as a source term. It’s expressed as follows:
where σlv is the surface tension between vapor and liquid, N/m; κ is the surface curvature, defined as the divergence of the unit normal vector on the interface.
For the calculation of air flow field in the wind tunnel, the SIMPLE algorithm is used for the pressure-velocity coupling. The momentum, energy, and turbulence equations are discretized using the QUICK scheme, which has a fast convergence rate and is equivalent to the second-order upwind scheme in terms of computational accuracy. For the calculation of condensation inside the tube, the momentum and energy equations are discretized using the second-order upwind scheme and the VOF equation is discretized using the Geo-Reconstruct scheme. Detailed information of the models and boundary conditions adopted in this investigation are shown in Table 2.
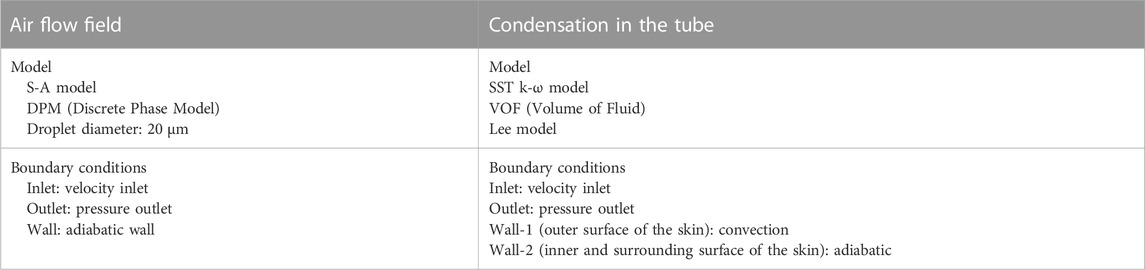
TABLE 2. Models and boundary conditions.
3.2 Validation of grid independence and model
3.2.1 Grid independence validation
Figure 3 shows the grids of test section of the wind tunnel and the condenser pipe in this research. The geometric size of the test section is 500 × 400 × 300 mm. The calculation was performed using a structured mesh with refinement near the wall surface. The first layer thickness is 0.05 mm. The growth rate is 1.1. The boundary layer number of the pipe wall is 15. A grid independent test is carried out using five grid numbers for the test section of wind tunnel and the condenser pipe respectively. The five grid numbers for the test section of wind tunnel are: 116883, 711122, 1811082, 2712762, and 3725862. The five grid numbers for the condenser pipe are: 110000, 585765, 1344630, 1786252, and 2529430. Figure 4A shows the trend of heat transfer coefficient of the skin’s surface with the air inlet velocity of 5.0 m/s. Figure 4B shows the trend of heat transfer coefficient of the pipe wall surface with the water inlet velocity of 3.0 m/s and water temperature of 363.15 K. After grid independence verification, mesh 4 of 2712762 grids of the wind tunnel and mesh 4 of 1786252 grids of condenser pipe were finally chosen to ensure both calculation accuracy and time efficiency.

FIGURE 3. Grid in this study: (A) Gird of wind tunnel test section; (B) Grid of condenser pipe.
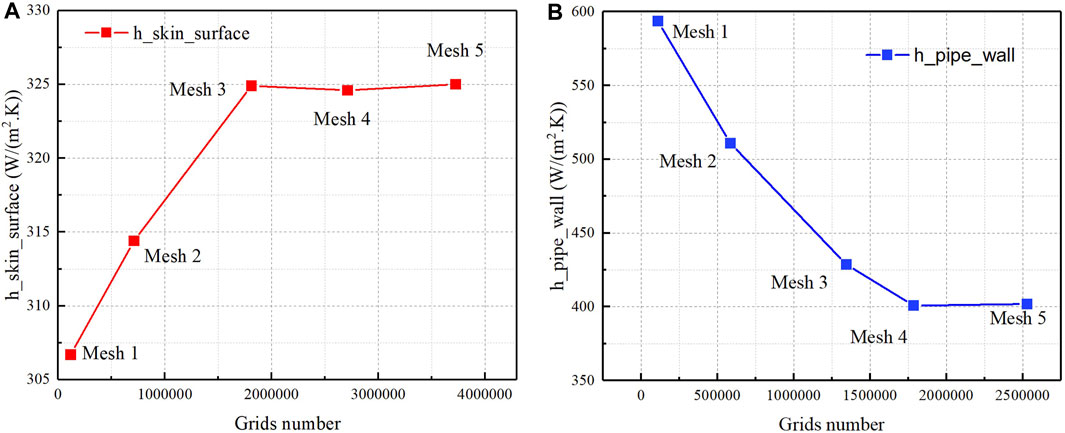
FIGURE 4. Grid independence test: (A) h of surface skin; (B) h of pipe wall.
3.2.2 Model validation
According to S.B. Al-Shammari et al. (Al-Shammari et al., 2004), experimental conditions as shown in Figure 5A are designed, a numerical simulation is carried out according to the numerical method presented above, and the simulation results are compared with the experimental data. The test subject is a vertical cooper tube with the diameter of 28.25 mm and the length of 3.0 m. The computational domain is reduced to an axisymmetric 2D model. The mass flux of the inlet is 6.71 kg/h. The inlet temperature is 60°C. Pressure is 0.19 bar. The condensation heat transfer coefficient from top of tube is shown in Figure 5B. The results show that the relative error of the heat transfer coefficient is below 11.5%. Therefore, the numerical model in this study can be considered a reasonable calculation method.
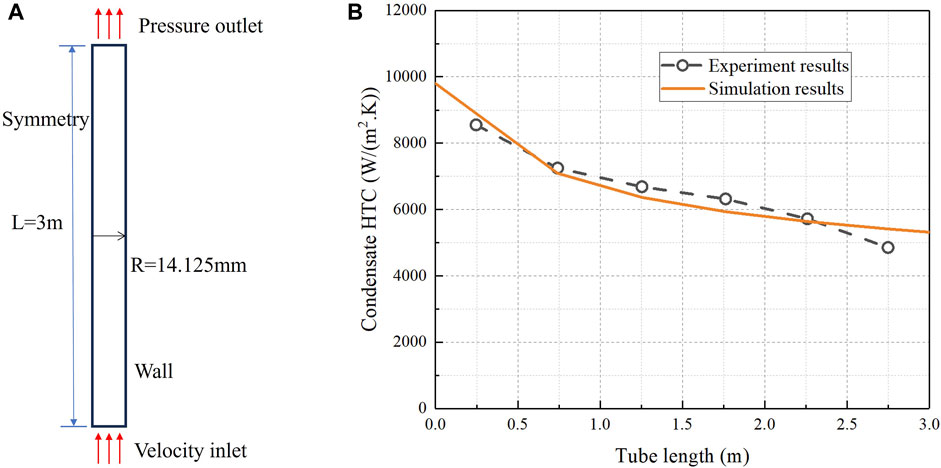
FIGURE 5. Model validation of this study: (A) Schematic diagram of computational domain for numerical method validation; (B) Comparison of condensation HTC between simulation results and experiment results.
4 Results and analysis
4.1 Phase distribution
The position of the pipe inside the wing skin is shown in Figure 6. For the convenience of analysis, the pipe along the chord direction is named as P1∼P10 from the condenser’s inlet to the condenser’s outlet. The spanwise direction is named as Z direction, ranging from Z = 0 m to Z = 0.2 m. Several cross sections are taken from Z = 0.02 m to Z = 0.18 m every 0.02 m.
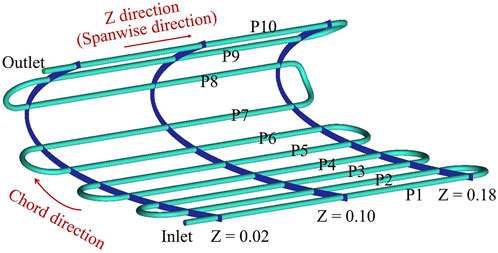
FIGURE 6. Condenser tube and positions of the cross section.
4.1.1 Effect of heating power
The vapor volume fraction with heating power of 35 W and air velocity of 30.9 m/s is shown in Figure 7. Along the chord direction, the temperature of working fluid gets lower gradually from P1 to P10. Vapor with high temperature and pressure flows into the condenser tube and does not begin to condense immediately but after a flowing distance, which is consistent with the analysis in Figure 1. It can be known from the result in Figure 7 that the condensation process mainly happened in the sixth tube of the condenser, which means the main two-phase zone is in P6.
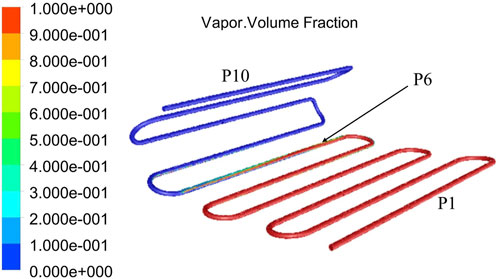
FIGURE 7. Vapor distribution in the condenser tube with Q = 35 W and v = 30.9 m/s.
For a more detailed understanding of internal condensation situation, the phase distribution in P6 is shown in Figure 8. The flow direction of the working fluid in P6 is from Z = 0.2 to Z = 0, along which the proportion of vapor phase in the pipe decreases gradually, while the proportion of liquid phase increases gradually. Due to the airfoil and the distribution positions of the condenser tube, for P6, the left side of the pipe wall is attached to the inner surface of the skin. Based on the facts above and the existence of gravity, the condensation process first happened in the left side and then the condensing liquid accumulated around the inner surface of the tube, forming the annular flow pattern.
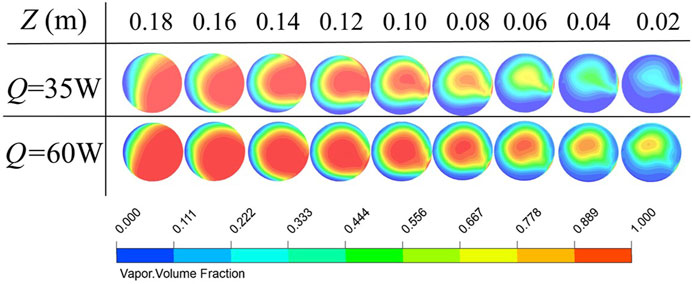
FIGURE 8. Phase change process in the two-phase zone with different heating power (v = 30.9 m/s).
In Figure 8, results with a heating power of 60 W were also included for comparison. As the heating power increased, the proportion of vapor at the same position increased, and the length of the two-phase zone became longer. This is because the flow rate and velocity of vapor also increased with increasing heating power. The increased system pressure promoted the movement of vapor over a longer distance, leading to a slower rate of condensation. Consequently, the location and length of the two-phase zone were altered.
Figure 9 shows the pressure distribution along the flow direction in the two-phase zone. The pressure drop is 274.9 Pa and 646.1 Pa with different heating power of 35 W and 60 W respectively. Increasing heating power leads to the increasement of pressure drop. A larger pressure drop will increase the flow velocity of the working fluid, increase the turbulence of the flow, and thus enhance the convective heat transfer efficiency.
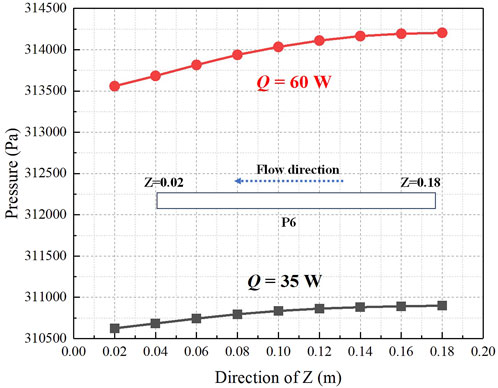
FIGURE 9. Pressure distribution in the two-phase zone with different heating power (v = 30.9 m/s).
4.1.2 Effect of angle of attack
This section investigated the impact of angle of attack on phase distribution during the condensation process. Angle of attack is represented by α, as illustrated in Figure 10. In this part, α is set to be 0°, 5°, and 10° respectively.
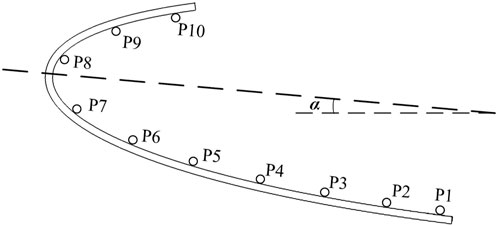
FIGURE 10. Diagram of the angle of attack (α).
The simulation results indicate that the main phase transition positions for the three states occur at P6. The results of different Z-value sections are compared and shown in Figure 11. The results demonstrate that the proportion of vapor at the same pipeline position does not change significantly as the angle of attack increases, but the vapor phase value slightly decreases when the angle of attack increases from Z = 0.10 m to Z = 0.06 m. With an inner diameter of 2 mm, the effect of surface tension on the flow and heat transfer process cannot be ignored. Additionally, due to the small change in the angle of attack, the convective heat transfer of external air at P6 is also only slightly affected. Therefore, the condensation process in the two-phase zone of P6 is basically similar, and the phase distribution remains largely the same within a range of 10°.
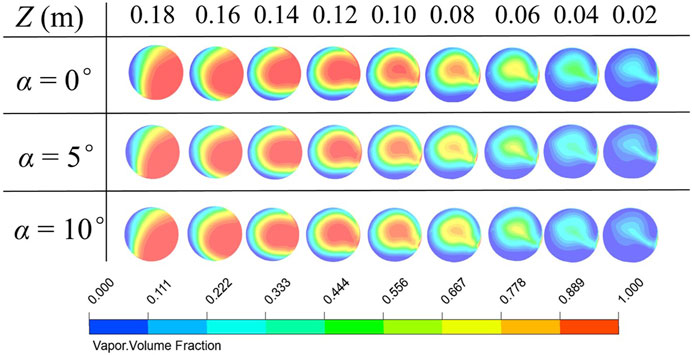
FIGURE 11. Phase change process in the two-phase zone under different α (Q = 35 W, v = 30.9 m/s).
4.2 Surface temperature of the wing skin
Measuring the surface temperature is crucial to evaluate the effectiveness of the LHP anti-icing system. This section investigates the skin temperature distribution under different conditions, including dry and moist air, as shown in Figure 12. The angle of attack in both conditions is 0°. The temperature distribution trends in the two conditions are consistent. The surface temperature near the condenser inlet is higher than that near the outlet. This indicates that the temperature of the LHP’s working fluid is the primary parameter affecting the wing’s surface temperature. With the comparison between the dry air and moist air conditions, it is evident that the skin temperature significantly decreased when water droplets hit the skin surface, especially near the stagnation point. This is due to water droplets collecting near the stagnation point and the latent heat of water evaporation causing the skin temperature to drop considerably.
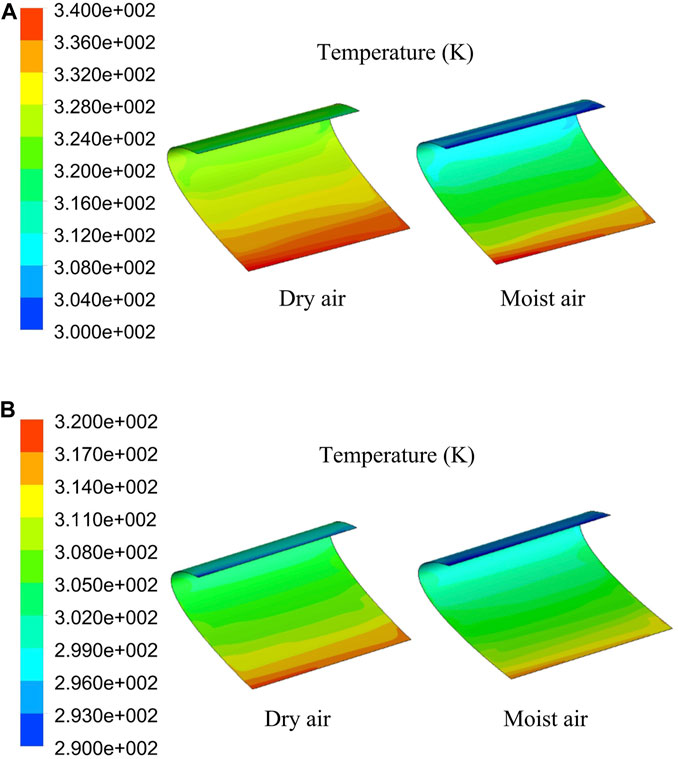
FIGURE 12. Surface temperature distribution results in simulation: (A) Q = 180 W, v = 30.9 m/s, LWC = 1.0 g/m3, MVD = 20 μm; (B) Q = 60 W, v = 50.0 m/s, LWC = 1.0 g/m3, MVD = 20 μm.
Figure 13 presents a comparison between the experimental and simulation results. The heating power used was 180 W and 60 W, respectively, while the air velocity and angle of attack were 11.7 m/s and 0°, respectively. The abscissa shows the chordwise distance from the stagnation point. The surface temperature was found to be the highest at the position with x = - 0.07 m, which is close to the condenser inlet, and the lowest at the position with x = 0.03 m, which is close to the condenser outlet. The comparison results show that the average error of surface temperature is 3.6% and 2.5% for the heating power of 180 W and 60 W respectively. The experimental and simulation results are in good agreement, indicating that the models and methods used in the simulation are reasonable and effective, and can serve as a reference for further research.
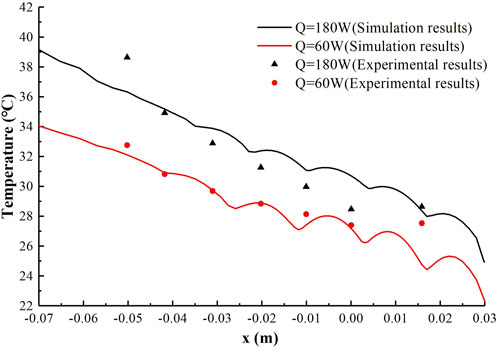
FIGURE 13. Comparison of the surface temperature between experimental and numerical results.
5 Conclusion
In this research, the heat transfer performance of condenser in LHP anti-icing system was investigated through numerical and experimental methods, mainly focusing on the two-phase flow pattern, surface temperature distribution of the wing skin, and the position and length of the two-phase zone. The main conclusions obtained are as follows.
(1) The condensation process mainly happened at the position of P6 of the condenser pipe when the heating power was 35 W and 60 W. Increasing power from 35 W to 60 W will result in an increase in the vapor volume fraction at the same location in the two-phase region of the condenser, which slows down the condensation process, and the length of the two-phase region will correspondingly increase. However, small variations in the angle of attack (0°–10°) will not have a significant impact on the phase distribution in the two-phase zone.
(2) When the heating power is 180 W and 60 W, the surface temperature obtained by experiment and simulation methods are in good agreement with the average error of 3.6% and 2.5% respectively. The skin’s surface temperature close to the condenser’s inlet is the highest, while the temperature near the outlet is relatively the lowest. Compared with the dry-air situation, when it comes to the anti-icing situation, the skin’s surface temperature will decrease, and the temperature drop near the leading edge is the largest. Therefore, to achieve better anti-icing effect, this study suggests arranging the inlet of the condenser pipe close to the leading edge of the wing.
Data availability statement
The original contributions presented in the study are included in the article/Supplementary material, further inquiries can be directed to the corresponding authors.
Author contributions
YZ: Conceptualization, Funding acquisition, Project administration, Resources, Validation, Writing–original draft. GL: Formal Analysis, Software, Writing–original draft. CD: Data curation, Methodology, Supervision, Validation, Writing–review and editing. HW: Investigation, Validation, Visualization, Writing–original draft.
Funding
The author(s) declare financial support was received for the research, authorship, and/or publication of this article. This research was supported by the Natural Science Foundation of Shandong Province under Grant No. ZR2020QE195 and the program of China Scholarship Council (CSC) under Grant No. 202008370051.
Conflict of interest
The authors declare that the research was conducted in the absence of any commercial or financial relationships that could be construed as a potential conflict of interest.
The author(s) declared that they were an editorial board member of Frontiers, at the time of submission. This had no impact on the peer review process and the final decision.
Publisher’s note
All claims expressed in this article are solely those of the authors and do not necessarily represent those of their affiliated organizations, or those of the publisher, the editors and the reviewers. Any product that may be evaluated in this article, or claim that may be made by its manufacturer, is not guaranteed or endorsed by the publisher.
References
Accorinti, F., Erroui, N., Ayel, V., Gateau, G., Bertin, Y., Roux, N., et al. (2019). “High-efficiency cooling system for highly integrated power electronics for hybrid propulsion aircraft,” in IEEE 28th International Symposium on Industrial Electronics (ISIE), Vancouver, BC, Canada, June, 2019, 870–877.
Ahmadi Moghaddam, H., Sarmadian, A., Asnaashari, A., Hossein, A. N. J., Islam, M. S., Saha, S. C., et al. (2020). Condensation heat transfer and pressure drop characteristics of Isobutane in horizontal channels with twisted tape inserts. Int. J. Refrig. 118, 31–40. doi:10.1016/j.ijrefrig.2020.06.019
Alhuyi Nazari, M., Ghasempour, R., Behshad Shafii, M., and Ahmadi, M. H. (2018). Experimental investigation of triton X-100 solution on pulsating heat pipe thermal performance. J. Thermophys. Heat. Tr. 32 (3), 806–812. doi:10.2514/1.T5295
Al-Shammari, S. B., Webb, D. R., and Heggs, P. (2004). Condensation of steam with and without the presence of non-condensable gases in a vertical tube. Desalination 169, 151–160. doi:10.1016/j.desal.2003.11.006
Anderson, W. G., and Chow, P. (1995). “Loop heat pipes for anti-icing of gas turbine inlets,” in Proceedings of the IX International Heat Pipe Conference, New Mexico, USA, May, 1995.
Becker, S., Vershinin, S. V., Sartre, V., Laurien, E., Bonjour, J., and Maydanik, Y. F. (2011). Steady state operation of a copper-water LHP with a flat-oval evaporator. Appl. Therm. Eng. 31 (5), 686–695. doi:10.1016/j.applthermaleng.2010.02.005
Bohdal, T., Charun, H., Kruzel, M., and Sikora, M. (2019). High pressure refrigerants condensation in vertical pipe minichannels. Int. J. Heat. Mass Tran. 134, 1250–1260. doi:10.1016/j.ijheatmasstransfer.2019.02.037
Cai, Q., Chen, C.-lung, and JulieAsfia, F. (2015). Experimental investigations of an avionics cooling system for aerospace vehicle. J. Spacecr. Rockets 44 (2), 439–444. doi:10.2514/1.16051
Cao, X., Zhang, N., Yuan, Y., and Luo, X. (2020). Thermal performance of triplex-tube latent heat storage exchanger: simultaneous heat storage and hot water supply via condensation heat recovery. Renew. Energy 157, 616–625. doi:10.1016/j.renene.2020.05.059
Chun, M.-H., and Seon-Oh, Yu (2000). A parametric study and a guide chart to avoid condensation-induced water hammer in a horizontal pipe. Nucl. Eng. Des. 201 (2-3), 239–257. doi:10.1016/S0029-5493(00)00280-6
Dorao, C. A., and Fernandino, M. (2022). The heat transfer coefficient similarity between binary and single component flow condensation inside plain pipes. Int. J. Heat. Mass Tran. 186, 122450. doi:10.1016/j.ijheatmasstransfer.2021.122450
Fleming, A. J., Thomas, S. K., and Yerkes, K. L. (2010). Titanium-water loop heat pipe operating characteristics under standard and elevated acceleration fields. J. Thermophys. Heat. Tr. 24 (1), 184–198. doi:10.2514/1.45684
Fred, A. L. (, Phillips, J. E. F., Gernert, N. J., and Sarraf, D. B. (1998). “Loop heat pipe qualification for high vibration and high-g environments,” in 36th AIAA Aerospace Sciences Meeting and Exhibit, Reno, NV, USA, January, 1998.
He, R., Yi, P., and Li, T. (2020). Evaporation and condensation characteristics of n-heptane and multi-component diesel droplets under typical spray relevant conditions. Int. J. Heat. Mass Tran. 163, 120162. doi:10.1016/j.ijheatmasstransfer.2020.120162
Hirt, C. W., and D Nichols, B. (1981). Volume of fluid (VOF) method for the dynamics of free boundaries. J. Comput. Phys. 39 (1), 201–225. doi:10.1016/0021-9991(81)90145-5
Ho, J. Y., Leong, K. C., and Wong, T. N. (2019). Forced convection condensation of R134a in three-dimensional conical pin fin tubes. Int. J. Heat. Mass Tran 144, 118599. doi:10.1016/j.ijheatmasstransfer.2019.118599
Hodot, R., Sartre, V., Lefèvre, F., and Sarno, C. (2016). Modeling and experimental tests of a loop heat pipe for aerospace applications. J. Thermophys. Heat. Tr. 30 (1), 182–191. doi:10.2514/1.T4551
Holman, T. D., Baldauff, R. W., and Khrustalev, D. K. (2020). Stabilized loop heat pipe architecture for reliable operation under high-power transients. J. Thermophys. Heat. Tr. 34 (3), 530–537. doi:10.2514/1.T5790
Jones, A. B., and Chen, R. (2015). Experimental assessment of vapour chamber heater spreader implementation in avionic cooling. AIAA J., doi:10.2514/6.2015-0712
Juan Pablo, M., and Mantelli, M. B. H. (2017). Thermal model for sintered cylindrical evaporators of loop heat pipes. J. Thermophys. Heat. Tr. 31 (1), 165–177. doi:10.2514/1.T4790
Khalil, E. E., Said, E., AlSaheh, A., and ElHarriry, G. (2020). “Effect of hot air jet arrangement from a piccolo tube in aircraft wing anti-icing system,” in AIAA Propulsion and Energy, VIRTUAL EVENT, August, 2020.
Klahm, T., Auracher, H., and Ziegler, F. (2010). Heat transfer during reflux condensation of an R134a/R123 mixture in vertical and inclined narrow tubular and rectangular channels. Int. J. Refrig. 33 (7), 1319–1326. doi:10.1016/j.ijrefrig.2010.07.002
Kruzel, M., Bohdal, T., and Sikora, M. (2020). Heat transfer and pressure drop during refrigerants condensation in compact heat exchangers. Int. J. Heat. Mass Tran. 161, 120283. doi:10.1016/j.ijheatmasstransfer.2020.120283
Pagnoni, F., Vincent, A., Bertin, Y., Coulloux, J., and Zebian, M. (2021). Loop heat pipe for thermal management of aircraft engine equipment. J. Thermophys. Heat. Tr. 35 (2), 1–12. doi:10.2514/1.T6049
Park, Y. J., Jun, S., Kim, S., and Lee, D.-Ho (2010). Design optimization of a loop heat pipe to cool a lithium-ion battery onboard a military aircraft. J. Mech. Sci. Technol. 24 (2), 609–618. doi:10.1007/s12206-009-1214-6
Parker, M. L., BruceDrolen, L., and Portonovo, S. (2005). Loop heat pipe for spacecraft thermal control, Part 2: ambient condition tests. J. Thermophys. Heat. Tr. 19 (2), 129–136. doi:10.2514/1.4530
Phillips, A. L., and Kevin, L. W. (2000). “Loop heat pipe anti-icing system development program summary,” in 30th International Conference on Environmental Systems, Toulouse, France, July, 2000.
Phillips, A. L., and Nelson, J. G. (1998). “Passive aircraft anti-icing system using waste heat,” in 28th International Conference on Environmental Systems, Danvers, Massachusetts, July, 1998.
Stallbaumer-Cyr, E. M., Derby, M. M., and Betz, A. R. (2022). Physical mechanisms for delaying condensation freezing on grooved and sintered wicking surfaces. Appl. Phys. Lett. 121, 071601. doi:10.1063/5.0105412
Su, Q., Chang, S., Song, M., Zhao, Y., and Dang, C. (2019). An experimental study on the heat transfer performance of a loop heat pipe system with ethanol-water mixture as working fluid for aircraft anti-icing. Int. J. Heat. Mass Tran. 139, 280–292. doi:10.1016/j.ijheatmasstransfer.2019.05.015
Wallisch, J., and Hann, R. (2022). “UAV icing: experimental investigation of ice shedding times with an electrothermal de-icing system,” in AIAA AVIATION 2022 Forum, Chicago, June, 2022.
Wang, L., Yue, X., Chong, D., Chen, W., and Yan, J. (2018). Experimental investigation on the phenomenon of steam condensation induced water hammer in a horizontal pipe. Exp. Therm. Fluid Sci. 91, 451–458. doi:10.1016/j.expthermflusci.2017.10.036
Wang, Y., Mu, X., Xie, Yi, Li, W., Dan, D., Qian, Y., et al. (2023). A coupled model and thermo-electrical performance analysis for flat heat pipe-based battery thermal management system. Appl. Therm. Eng. 233, 121116. doi:10.1016/j.applthermaleng.2023.121116
Yerkes, K. L., Scofield, J. D., Courson, D. L., and Jiang, H. (2014). Steady-periodic acceleration effects on the performance of a loop heat pipe. J. Thermophys. Heat. Tr. 28 (3), 440–454. doi:10.2514/1.T3900
Keywords: loop heat pipe, anti-icing, condensation, phase change, volume of fluid
Citation: Zhao Y, Li G, Dang C and Wu H (2023) Research on the thermal performance of the condenser in a loop heat pipe anti-icing system. Front. Energy Res. 11:1306563. doi: 10.3389/fenrg.2023.1306563
Received: 04 October 2023; Accepted: 16 November 2023;
Published: 27 November 2023.
Edited by:
Young-Deuk Kim, Hanyang University, Republic of KoreaReviewed by:
Seong-Yong Woo, Hanyang University, Republic of KoreaHaitao Hu, Shanghai Jiao Tong University, China
Seung Jin Oh, Korea Institute of Industrial Technology, Republic of Korea
Copyright © 2023 Zhao, Li, Dang and Wu. This is an open-access article distributed under the terms of the Creative Commons Attribution License (CC BY). The use, distribution or reproduction in other forums is permitted, provided the original author(s) and the copyright owner(s) are credited and that the original publication in this journal is cited, in accordance with accepted academic practice. No use, distribution or reproduction is permitted which does not comply with these terms.
*Correspondence: Yuanyuan Zhao, eXl6aGFvQGxkdS5lZHUuY24=; Chaobin Dang, ZGFuZ2NiQHUtZnVrdWkuYWMuanA=