 Mousumi Basu1
 Baseem Khan
- 1Department of Power Engineering, Jadavpur University, Kolkata, India
- 2Department of Electrical Engineering, KIIT University, Bhubaneswar, India
- 3Department of Electrical and Computer Engineering, Hawassa University, Hawasa, Ethiopia
- 4Department of Electrical and Electronic Engineering Technology, University of Johannesburg, Johannesburg, South Africa
The economical use of available fuel for producing electricity has been a very important challenge for power companies due to the continuously declining supply of fossil fuels. FCJHPDEED (fuel-constrained joint heat and power dynamic economic environmental dispatch) and JHPDEED (joint heat and power dynamic economic environmental dispatch) with DSM (demand-side management) integrating solar PV plants, WTGs (wind turbine generators), and PHS (pumped hydro storage) plants have been presented. Using SPEA 2 (strength Pareto evolutionary algorithm 2) and NSGA-II (non-dominated sorting genetic algorithm-II), FCJHPDEED and JHPDEED have been solved. It is seen that the results obtained without fuel constraints are more optimal than the results obtained with fuel constraints. The joint heat and power dynamic economic dispatch cost obtained with fuel constraints is approximately 2.14% more than the cost obtained without fuel constraints and joint heat and power dynamic emission dispatch, and the emission obtained with fuel constraints is approximately 6.7% more than the emission obtained without fuel constraints.
1 Introduction
The primary source of electricity production until now has been fossil fuel-based power plants. There is a chance of a fuel shortage since fossil fuel production is progressively declining. Power producers are required to reorganize power production depending on the fuel that is available since fuel suppliers have added further restrictions to their fuel-providing agreement.
With the growing debate on climate alteration and pollution-free energy, wind power and solar power are increasingly utilized today as they are free from harmful emissions. However, renewable energy sources have their own challenges due to their irregularity and intermittent nature, which can cause fluctuations in power generation scheduling. This can be overcome by assimilating PHS plants to reduce power fluctuations.
The economic dispatch problem has been described briefly in Le et al. (2019); Dashtdar et al. (2022). Trefny and Lee have explained economic dispatch, taking into account fuel restrictions (Trefny and Lee, 1981). The fuel resource arrangement in managing power systems is described in Kumar and Vemuri (1984); Vemuri et al. (1984).
The optimal generation schedule of a small sovereign system using WTGs and solar PV facilities, both of which produce no pollution, has been described in Bakirtzis and Gavanidou (1992). However, due to their limited generation capacity, the combined use of different energy-producing systems (Mondal et al., 2013; Khan et al., 2015) is increasing rapidly.
PHS plants are drawing a lot of interest throughout the world (Perez-Diaz and Jim, 2016) because of their capacity to store energy. The main purpose of a PHS plant is to pump water from the lower reservoir into the higher reservoir in order to save low-cost extra electric energy generated in off-peak power demand times (Wood and Wollenberg, 1984; Fadil and Urazel, 2013). This hoarded energy is used to generate energy throughout peak power demand periods.
Electricity is produced inefficiently using fossil fuels. Heat is the main kind of energy destroyed during the conversion process. Co-generation utilizes this heat efficiently and produces lower harmful gas emanation. Utilizing CHPDED, the production of electricity and heat is distributed in a way that minimizes the overall cost while also meeting a number of limitations. Several methods (Rooijers and van Amerongen, 1994; Guo et al., 1996; Su and Chiang, 2004; Vasebi et al., 2007; Wang and Singh, 2008; Subbaraj et al., 2009; Mohammadi-Ivatloo et al., 2013; Basu, 2016) have been described to resolve this problem.
JHPDEED optimizes the total generation cost and emission level of steam turbine generators, co-generation units, and heat-only units throughout a particular period of time, considering power ramp rate limitations of co-generation and steam turbine generating units.
Several approaches to resolve economic dispatch, assimilating WTGs and solar PV plants, are explained in Hetzer et al. (2008); Reddy et al. (2015); Tang et al. (2015); Li et al. (2016); Liu and Nair (2016); Peng et al. (2016); Yang et al. (2016); Liu et al. (2017).
According to the International Energy Agency’s strategy plan, DSM has been established as the most significant choice of the overall energy policy directives. DSM can reduce the price and boost system safety (Yousefi et al., 2013).
Here, both FCJHPDEED and JHPDEED with DSM have been described. The system comprises thermal generators, heat-only units, co-generation units, solar PV plants, WTGs, and PHS plants. The uncertainty of WTGs and solar PV plants has been considered. The primary restrictions are restrictions on different fuel types for co-generation units and thermal generators, PHS plants, time-varying load demand, and on the generation capabilities and power ramp rates. The valve-point effect and forbidden viable region of steam turbine generating units have been considered. Both FCJHPDEED and JHPDEED with DSM have been solved using SPEA 2 and NSGA-II.
2 Formulation of the problem
Here, the system considered has fuel-constrained steam turbine generating units, heat-only units, co-generation units, WTGs, PHS plants, and solar PV plants. Figure 1 demonstrates the heat-power possible range of a combined cycle co-generation unit. Power output and heat output are indivisible. Heat-power workable county is enfolded by the frontier ABCDEF.
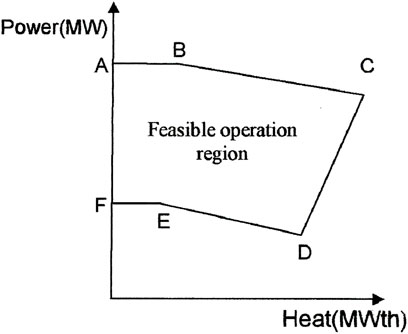
FIGURE 1. Heat-power viable workable area of a co-generation unit.
The output power of the steam turbine generating units, WTGs, solar PV plants, and PHS plants and the heat output of heat-only units are limited by the individual minimum and maximum limits. Power is generated by steam turbine generating units, WTGs, solar PV plants, co-generation units, and PHS plants, while heat is generated by heat-only units and co-generation units.
The FCJHPDEED issue with DSM-integrating solar PV plants, WTGs, and PHS plants distributes heat and power generation among all dedicated thermal generating units, WTGs, co-generation units, PHS plants, solar PV plants, and heat-only units in a way that the emission and total price are optimized over a specific time period while satisfying a number of constraints, including generation limit restrictions, power and heat balance constraints, and dissimilar types of fuel construction. When formulating the FCJHPDEED issue, the objective functions and restrictions mentioned below are considered.
2.1 Objectives
2.1.1 Cost
The total price is expressed as
The fuel price function of the
The price function of the
The price function of the
The reserve and penalty price of wind power (Hetzer et al., 2008) can be shown as
The reserve and penalty price of solar power (Liang and Liao, 2007) can be shown as
2.1.2 Emission
Thermal power plants are the main sources of sulfur oxides, nitrogen oxides, and carbon dioxide. Emission from a steam turbine generating unit is the addition of quadratic function and exponential function (Gent and Lamont, 1971). The total emission from steam turbine generating units, co-generation units, and heat-only units can be expressed as
2.2 Constraints
i)Power balance constraints:
Whilst power demand is cut back because of DRP,
Loss in transmission
The number of plants
ii) Fuel delivery constraints:
Over the course of the scheduling horizon, the total fuel provided to all co-generation units and steam turbine generating units should match the fuel that is supplied by the purveyor.
iii) Fuel storage constraints of steam turbine generators:
The residual fuel at the start of the subsequent interlude is calculated by subtracting the fuel burned at the thermal generator from the fuel volume of every steam turbine generating unit at the start of every interlude plus the fuel provided to that steam turbine generating unit.
iv) Fuel delivery limits of steam turbine generators:
Fuel that is delivered to each steam turbine generating unit at every interlude must be within its lower limit
v) Fuel storage limits of steam turbine generators:
The fuel storage limit of each steam turbine generating unit at each interlude must be within its lower limit
vi) Fuel storage constraints of co-generation units:
The amount of fuel available at the start of the subsequent interlude is determined by the fuel volume of each co-generation unit at the beginning of each interlude, fuel supplied to that co-generation unit, and fuel burned at that co-generation unit.
vii) Fuel delivery limits of co-generation units:
Fuel delivered to each co-generation unit at each interlude must be within its minimum limit
viii) Fuel storage limits of co-generation units:
The fuel storage limit of each co-generation unit at each interlude must be within its minimum limit
ix) Generation limits of the thermal generator:
x) Forbidden workable region of thermal generating units:
The restricted area of a steam turbine generating unit is due to the shaft bearing tremor caused by a steam valve or a flaw in the machine or supporting equipment. It is challenging to determine the input–output curve’s shape in the hinterland of a possible but restricted zone using actual routine testing. In actuality, avoiding operating in certain areas results in the biggest cost-saving strategy. The following is a possible area of operation for the
where
xi) Power ramp rate limit constraints of steam turbine generators and co-generation units:
xii) Heat balance constraints:
xiii) Capacity boundary limits of co-generation units:
The heat output and power output of the co-generation unit are inseparable, and they intrude one another.
xiv) Capability boundary limits of heat-only units:
xv) Wind power model:
The WTG’s output power mostly depends on wind velocity. Cut-in pace, rated pace, and cut-out pace of wind are used to clarify the nonlinear connection between wind velocity and output power. Power output (Giorsetto and Utsurogi, 1983) of the
Constants
xvi) Solar power model:
The power output (Shilaja and Ravi, 2017) acquired from the
xvii) Pumped hydro storage plant constraints:
Whilst the PHS unit runs in the generating type and decides to run in the pumping type or vice versa, the PHS unit must be switched off for at least 1 hour because of physical restrictions of the unit, and it is recognized as switching time.
The starting and ending volumes of the water of the upper reservoir of the PHS plant are presumed to be identical here.
Demand-side management (DSM)
DSM initiates many benefits (Yousefi et al., 2013). DSM is categorized as DRP (demand response program), planned conservation, and so on. In this manuscript, DRP is utilized, and it is shaped as the TOU (time-of-use) program (Mehdizadeh and Taghizadegan, 2017). In the TOU program, a small proportion of demand is switched from peak to off-peak hours while keeping the overall demand constant. Equation 43 explains the TOU program, while Eq. 44 restricts it (47).
3 Principle of multi-objective optimization
Most actual-world issues require concurrent optimization of various conflicting objective functions. MOO with contradictory objective functions generates a number of optimum solutions in place of one optimum solution as no solution is superior to every other relating to all objective functions. Francis Ysidro Edgeworth proposed the concept of a trade-off optimality criterion in 1881, and Vilfredo Pareto clarified it in 1896. It is usually referred to as Pareto optimum, and optimum solutions are referred to as Pareto-optimal solutions.
The following is affirmed for a MOO problem with several goals and equality and inequality constraints:
subject to
where
a. Sufficient condition: The decision vector
b. Necessary condition: The decision vector
4 Non-dominated sorting genetic algorithm-II
Srinivas and Deb (1994) ascertained NSGA for competing with MOO problems. Non-domination has been exploited as a grading decisive factor of solutions, and on the other hand, fitness distribution has been exploited for diversification control in the investigated space. Since NSGA is very receptive to fitness distribution parameters, Deb et al. (2002) initiated NSGA-II, which generates more consistent solutions swifter than its ancestor.
5 Strength Pareto evolutionary algorithm 2
Strength Pareto evolutionary algorithm 2 (SPEA 2) (Zitzler et al., 2001) is the superior edition of SPEA. It blends a well-tuned fitness assignment approach, a density assessment technique, and an improved archive truncation technique with the conventional SPEA. In SPEA 2, the fitness value assigned to every entity is computed based on the strength value and the density degree. As each individual has its own value of density, the calculation starts with sorting the values of all objectives. The density value of every entity is the same as the sum of the difference between each objective value and its nearest neighbor. The fitness value is the summation of the strength value and the density degree. SPEA 2 uses an improved archive truncation method, where the size of the external storage file is fixed. The crossover and mutation procedure only occur in the storage file.
6 Numerical results
NSGA-II and SPEA 2 have been utilized for solving FCJHPDEED and JHPDEED with DSM integrating WTGs, PHS plants, and solar PV plants.
Total price and emission are two conflicting objective functions. To elucidate contrary relationships among objective functions, each objective function, namely, total price and total emission, is lowered distinctly by using RCGA (real-coded genetic algorithm). The population size, maximum number of iterations, crossover, and mutation probabilities are chosen as 100, 300, 0.9, and 0.2, respectively.
SPEA 2 and NSGA-II are used for optimizing total price and total emission objectives concurrently. The population size, maximum number of iterations, crossover, and mutation probabilities are taken as 20, 30, 0.2, and 0.9 for SPEA 2 and NSGA-II, respectively.
An equivalent WTG, an equivalent solar PV plant, an equivalent PHS plant, 13 thermal generating units with a banned working region and valve point impact, six co-generation units, and five heat-only units are all included in the test system. The data on co-generation units, steam turbine generating units, heat-only units, and hourly heat and power demand have been taken from Basu (2019). The whole schedule is divided into six 4-h intermissions, totaling 1 day. Table A contains information on coal-burning thermal generating units, including emission coefficients, coal “consumption coefficients, fuel delivery and storage limits, and starting fuel storage. 1. Table A contains information on the co-generation unit, including coal consumption coefficients, fuel supply and storage limits, and starting fuel storage. 2. Table A lists the emission coefficients for heat-only and co-generation units. 3. Table A lists the fuel that was supplied throughout the scheduled period.
The WTG rating is denoted as
The solar PV plant rating is denoted as
Generating mode:
Pumping mode:
Working restrictions: The PHS plant is allowed to operate only at −100 MW while pumping. The reservoir begins at 3000 acre/ft and should be at 3000 acre/ft at the ending of 24 h.
The 12, 13, and 14 hours are peak power demand hours. It is observed that 10% of 12-, 13-, and 14-hour power demands is transferred to the second, third, and fourth hour throughout DSM, respectively.
Power generation of thermal generating units, solar PV plants, WTGs, co-generation units, and PHS plants obtained from FCJHPDEED utilizing NSGA-II is portrayed in Figure 2 and Figure 3. Heat generation of heat-only units and co-generation units obtained from FCJHPDEED utilizing NSGA-II is portrayed in Figure 4. Fuel delivered to thermal generators and co-generation units obtained from FCJHPDEED using NSGA-II is mentioned in Table 1 and Table 2. TC and total emission acquired from CHPDED and joint heat and power dynamic environmental dispatch with and without fuel constraints are summarized in Table 3. Figure 5 and Figure 6 portray cost convergence characteristics, emission convergence characteristics, and the Pareto-optimal front obtained from the last iteration using SPEA 2 and NSGA-II with and without fuel constraints, respectively.
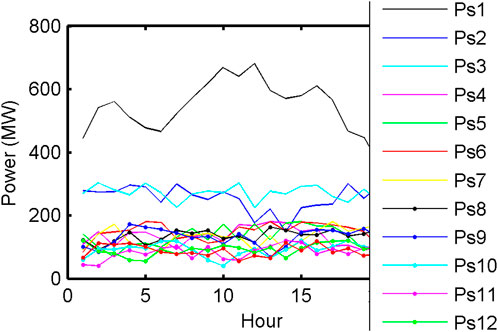
FIGURE 2. Output power of thermal generators from FCJHPDEED using NSGA-II.
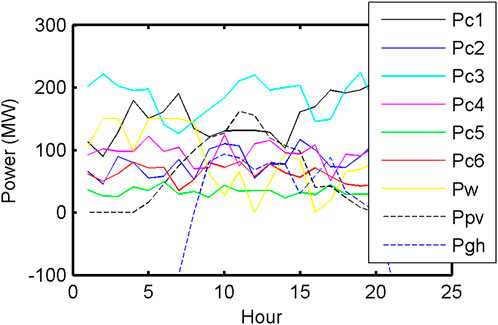
FIGURE 3. Output power of co-generation units, WTG, solar PV plant, and PHS plant from FCJHPDEED using NSGA-II.
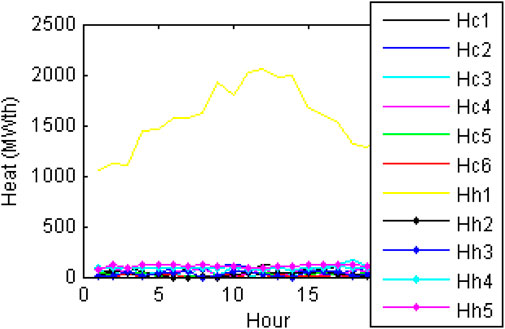
FIGURE 4. Heat output of co-generation units and heat-only units from FCJHPDEED using NSGA-II.
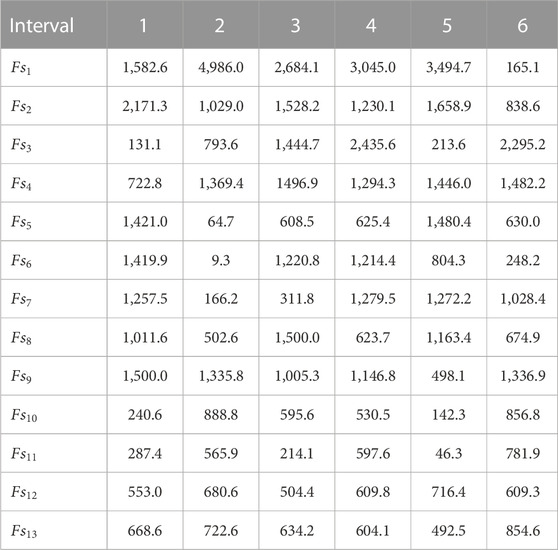
TABLE 1. Fuel delivered (ton) to thermal generating units acquired from FCJHPDEED using NSGA-II.
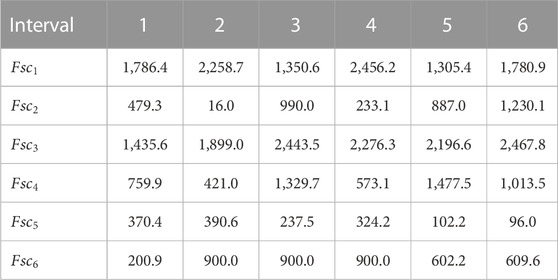
TABLE 2. Fuel delivered (ton) to co-generation units acquired from FCJHPDEED using NSGA-II.
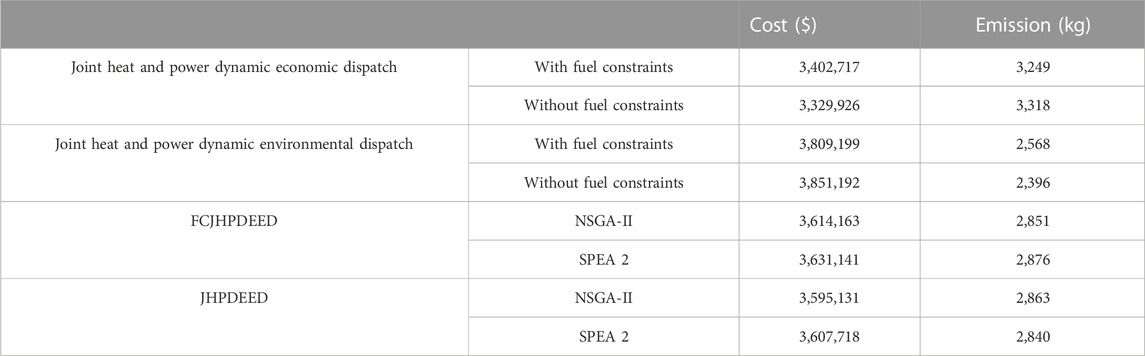
TABLE 3. Comparison of performance.
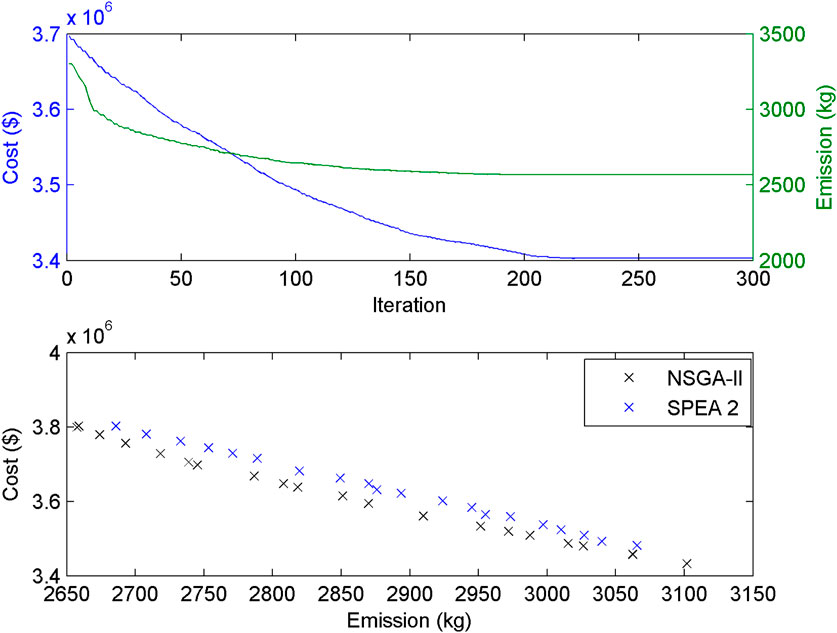
FIGURE 5. Cost convergence, emission convergence, and Pareto-optimal front obtained from the last iteration with fuel constraints.
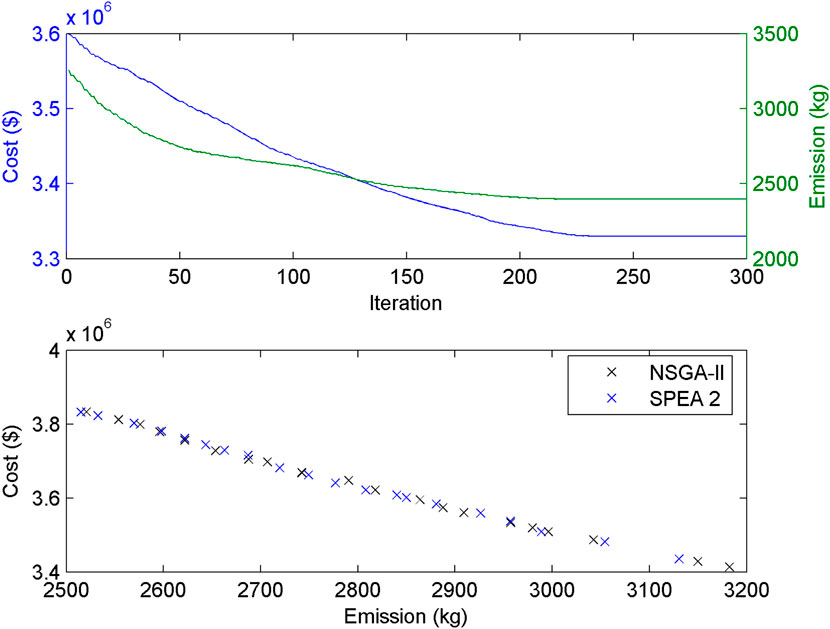
FIGURE 6. Cost convergence, emission convergence, and Pareto-optimal front obtained from the last iteration without fuel constraints.
Because of space limitations, detailed results obtained from joint heat and power dynamic economic dispatch, CHPDED with and without fuel constraints, JHPDEED without fuel constraints, and FCJHPDEED with fuel constraints using SPEA 2 cannot be given here.
7 Conclusion
In the present work, NSGA-II and SPEA 2 are used in order to solve real-world fuel-constrained joint heat and power dynamic economic environmental dispatch (FCJHPDEED) and joint heat and power dynamic economic environmental dispatch (JHPDEED) with DSM integrating the WTG, solar PV plant, and PHS plant. It is seen from numerical results that fuel consumption is satisfactorily managed for satisfying constraints inflicted by fuel purveyors utilizing the proposed techniques. It is observed that the results obtained without fuel constraints are more optimal than the results obtained with fuel constraints. In the case of joint heat and power dynamic economic emission dispatch, the cost acquired with fuel constraints is approximately 0.53% more than the cost acquired without fuel constraints, and the emission acquired with fuel constraints is approximately 0.42% lower than the emission acquired without fuel constraints. Although optimal dispatch is not achieved at all times, however, this is typically much better than the penalty imposed due to fuel constraint violations.
Data availability statement
The original contributions presented in the study are included in the article/Supplementary Material; further inquiries can be directed to the corresponding author.
Author contributions
MB: conceptualization, data curation, formal analysis, investigation, methodology, project administration, resources, software, supervision, validation, visualization, writing–original draft, and writing–review and editing. CJ: conceptualization, data curation, formal analysis, investigation, methodology, project administration, resources, software, supervision, validation, visualization, and writing–review and editing. BK: conceptualization, data curation, formal analysis, methodology, project administration, resources, software, supervision, validation, visualization, writing–original draft, and writing–review and editing. AA: conceptualization, data curation, formal analysis, investigation, methodology, project administration, resources, software, supervision, validation, visualization, and writing–review and editing. PB: data curation, formal analysis, methodology, project administration, resources, software, supervision, validation, visualization, and writing–review and editing.
Funding
The author(s) declare that no financial support was received for the research, authorship, and/or publication of this article.
Conflict of interest
The authors declare that the research was conducted in the absence of any commercial or financial relationships that could be construed as a potential conflict of interest.
Publisher’s note
All claims expressed in this article are solely those of the authors and do not necessarily represent those of their affiliated organizations, or those of the publisher, the editors, and the reviewers. Any product that may be evaluated in this article, or claim that may be made by its manufacturer, is not guaranteed or endorsed by the publisher.
Supplementary material
The Supplementary Material for this article can be found online at: https://www.frontiersin.org/articles/10.3389/fenrg.2023.1305076/full#supplementary-material
References
Bakirtzis, A. G., and Gavanidou, E. S. (1992). Optimum operation of a small autonomous system with unconventional energy sources. Electr. Power Syst. Res. 23 (1), 93–102. doi:10.1016/0378-7796(92)90056-7
Basu, M. (2019). Combined Heat and Power Dynamic Economic Dispatch with demand side management incorporating renewable energy sources and pumped hydro energy storage. IET Gener. Transm. Distrib. 13 (17), 3771–3781. doi:10.1049/iet-gtd.2019.0216
Basu, M. (2016). Group search optimization for combined heat and power economic dispatch. Int. J. Electr. Power and Energy Syst. 78, 138–147. doi:10.1016/j.ijepes.2015.11.069
Dashtdar, M., Flah, A., Mohammad Sadegh, S., Hosseinimoghadam, , Rami Reddy, Ch., Kotb, H., et al. (2022). Solving the environmental/economic dispatch problem using the hybrid FA-GA multi-objective algorithm. Energy Rep. 8, 13766–13779. doi:10.1016/j.egyr.2022.10.054
Deb, K., Pratap, A., Agarwal, S., and Meyarivan, T. (2002). A fast and elitist multiobjective genetic algorithm: NSGA-II. IEEE Trans. Evol. Comput. 6 (2), 182–197. doi:10.1109/4235.996017
Fadil, S., and Urazel, B. (2013). Solution to security constrained non-convex pumped-storage hydraulic unit scheduling problem by modified sub-gradient algorithm based on feasible values and pseudo water price. Electr. Power Components Syst. 41, 111–135. doi:10.1080/15325008.2012.732660
Gent, M. R., and Lamont, J. W. (1971). Minimum emission dispatch. IEEE Trans. PAS (90), 2650–2660. doi:10.1109/tpas.1971.292918
Giorsetto, P., and Utsurogi, K. F. (1983). Development of a new procedure for reliability modeling of wind turbine generators. IEEE Trans. Power App. Syst. 102 (1), 134–143. doi:10.1109/tpas.1983.318006
Guo, T., Henwood, M. I., and Ooijen, M. V. (1996). An algorithm for combined heat and power economic dispatch. IEEE Trans. Power Syst. 11 (4), 1778–1784. doi:10.1109/59.544642
Hetzer, J., Yu, D. C., and Bhattarai, K. (2008). An economic dispatch model incorporating wind power. IEEE Trans. Energy Convers. 23 (2), 603–611. doi:10.1109/tec.2008.914171
Khan, N. A., Awan, A. B., Mahmood, A., Sohail, R., Zafar, A., and Sidhu, G. A. S. (2015). Combined emission economic dispatch of power system including solar photo voltaic generation. Energy Convers. Manag. 92 (1), 82–91. doi:10.1016/j.enconman.2014.12.029
Kumar, A. B. R., and Vemuri, S. (1984). Fuel resource scheduling, Part-II- contrained economic dispatch. IEEE Trans. Power Apparatus Syst. 7, 1549–1555. PAS-103. doi:10.1109/TPAS.1984.318624
Le, C., Trung Nguyen, T., Trong Hien, C., and Quan Duong, M. (2019). A novel social spider optimization algorithm for large-scale economic load dispatch problem. Energies 12 (6), 1075. doi:10.3390/en12061075
Li, Y. Z., Wu, Q. H., Jiang, L., Yang, J. B., and Xu, D. L. (2016). Optimal power system dispatch with wind power integrated using nonlinear interval optimization and evidential reasoning approach. IEEE Trans. Power Syst. 31 (3), 2246–2254. doi:10.1109/tpwrs.2015.2449667
Liang, R.-H., and Liao, J.-H. (2007). A fuzzy-optimization approach for generation scheduling with wind and solar energy systems. IEEE Trans. PWRS 22 (No. 4), 1665–1674. doi:10.1109/tpwrs.2007.907527
Liu, F., Bie, Z., Liu, S., and Ding, T. (2017). Day-ahead optimal dispatch for wind integrated power system considering zonal reserve requirements. Appl. Energy 188, 399–408. doi:10.1016/j.apenergy.2016.11.102
Liu, Y., and Nair, N. K. C. (2016). A two-stage stochastic dynamic economic dispatch model considering wind uncertainty. IEEE Trans. Sustain. Energy 7 (2), 819–829. doi:10.1109/tste.2015.2498614
Mehdizadeh, A., and Taghizadegan, N. (2017). Robust optimisation approach for bidding strategy of renewable generation-based microgrid under demand side management. IET Renew. Power Gener. 11 (11), 1446–1455. doi:10.1049/iet-rpg.2017.0076
Mohammadi-Ivatloo, B., Moradi-Dalvand, M., and Rabiee, A. (2013). Combined heat and power economic dispatch problem solution using particle swarm optimization with time varying acceleration coefficients. Electr. Power Syst. Res. 95, 9–18. doi:10.1016/j.epsr.2012.08.005
Mondal, S., Bhattacharya, A., and Nee Dey Halder, S. (2013). Multi-objective economic emission load dispatch solution using gravitational search algorithm and considering wind power penetration. Electr. Power Energy Syst. 44 (1), 282–292. doi:10.1016/j.ijepes.2012.06.049
Peng, C., Xie, P., Pan, L., and Yu, R. (2016). Flexible robust optimization dispatch for hybrid wind/photovoltaic/hydro/thermal power system. IEEE Trans. Smart Grid 7 (2), 751–762. doi:10.1109/tsg.2015.2471102
Perez-Diaz, J., and Jim, J. (2016). Contribution of a pumped-storage hydropower plant to reduce the scheduling costs of an isolated power system with high wind power penetration. Energy 109 (1), 92–104. doi:10.1016/j.energy.2016.04.014
Reddy, S. S., Bijwe, P. R., and Abhyankar, A. R. (2015). Real-time economic dispatch considering renewable power generation variability and uncertainty over scheduling period. IEEE Syst. J. 9 (4), 1440–1451. doi:10.1109/jsyst.2014.2325967
Rooijers, F. J., and van Amerongen, R. A. M. (1994). Static economic dispatch for co-generation systems. IEEE Trans. Power Syst. 9 (3), 1392–1398. doi:10.1109/59.336125
Shilaja, C., and Ravi, K. (2017). Optimization of emission/economic dispatch using Euclidean affine flower pollination algorithm (eFPA) and binary FPA (BFPA) in solar photo voltaic generation. Renew. Energy 107, 550–566. doi:10.1016/j.renene.2017.02.021
Srinivas, N., and Deb, K. (1994). Muiltiobjective optimization using nondominated sorting in genetic algorithms. IEEE Trans. Evol. Comput. 2 (3), 221–248. doi:10.1162/evco.1994.2.3.221
Su, C. T., and Chiang, C. L. (2004). An incorporated algorithm for combined heat and power economic dispatch. Electr. Power Syst. Res. 69 (2-3), 187–195. doi:10.1016/j.epsr.2003.08.006
Subbaraj, P., Rengaraj, R., and Salivahanan, S. (2009). Enhancement of combined heat and power economic dispatch using self adaptive real-coded genetic algorithm. Appl. Energy 86, 915–921. doi:10.1016/j.apenergy.2008.10.002
Tang, Y., Zhong, J., and Liu, J. (2015). A generation adjustment methodology considering fluctuations of loads and renewable energy sources. IEEE Trans. Power Syst. 99 (1), 1–8.
Trefny, F. J., and Lee, K. Y. (1981). Economic fuel dispatch. IEEE Trans. Power Apparatus Syst. 7, 3468–3477. PAS-100. doi:10.1109/tpas.1981.316690
Vasebi, A., Fesanghary, M., and Bathaee, S. M. T. (2007). Combined heat and power economic dispatch by harmony search algorithm. Int. J. Electr. Power Energy Syst. 29 (29), 713–719. doi:10.1016/j.ijepes.2007.06.006
Vemuri, S., Kumar, A. B. R., Hackett, D. F., Eisenhauer, J. T., and Lugtu, R. (1984). Fuel resource scheduling, Part-I- overview of an energy management problem. IEEE Trans. Power Apparatus Syst. 7, 1542–1548. PAS-103. doi:10.1109/tpas.1984.318623
Walters, D. C., and Sheble, G. B. (1993). Genetic algorithm solution of economic dispatch with valve point loading. IEEE Trans. Power Syst. 8 (3), 1325–1332. doi:10.1109/59.260861
Wang, L., and Singh, C. (2008). Stochastic combined heat and power dispatch based on multi-objective particle swarm optimization. Int. J. Electr. Power Energy Syst. 30 (30), 226–234. doi:10.1016/j.ijepes.2007.08.002
Wood, A. J., and Wollenberg, B. F. (1984). Power generation, operation and control. New York, NY, USA: Wiley, 230–239.
Yang, L., He, M., Vittal, V., and Zhang, J. (2016). Stochastic optimization-based economic dispatch and interruptible load management with increased wind penetration. IEEE Trans. Smart Grid 7 (2), 730–739. doi:10.1109/tsg.2015.2444813
Yousefi, A., Iu, H., Fernando, T., and Trinh, H. (2013). An approach for wind power integration using demand side resources. IEEE Trans. Sustain. Energy 4 (4), 917–924. doi:10.1109/tste.2013.2256474
Zitzler, E., Laumanns, M., and Thiele, L. (2001). SPEA2: improving the strength pareto evolutionary algorithm. TIK- Report 103. Zurich, Switzerland: Swiss Federal Institute of Technology ETH.
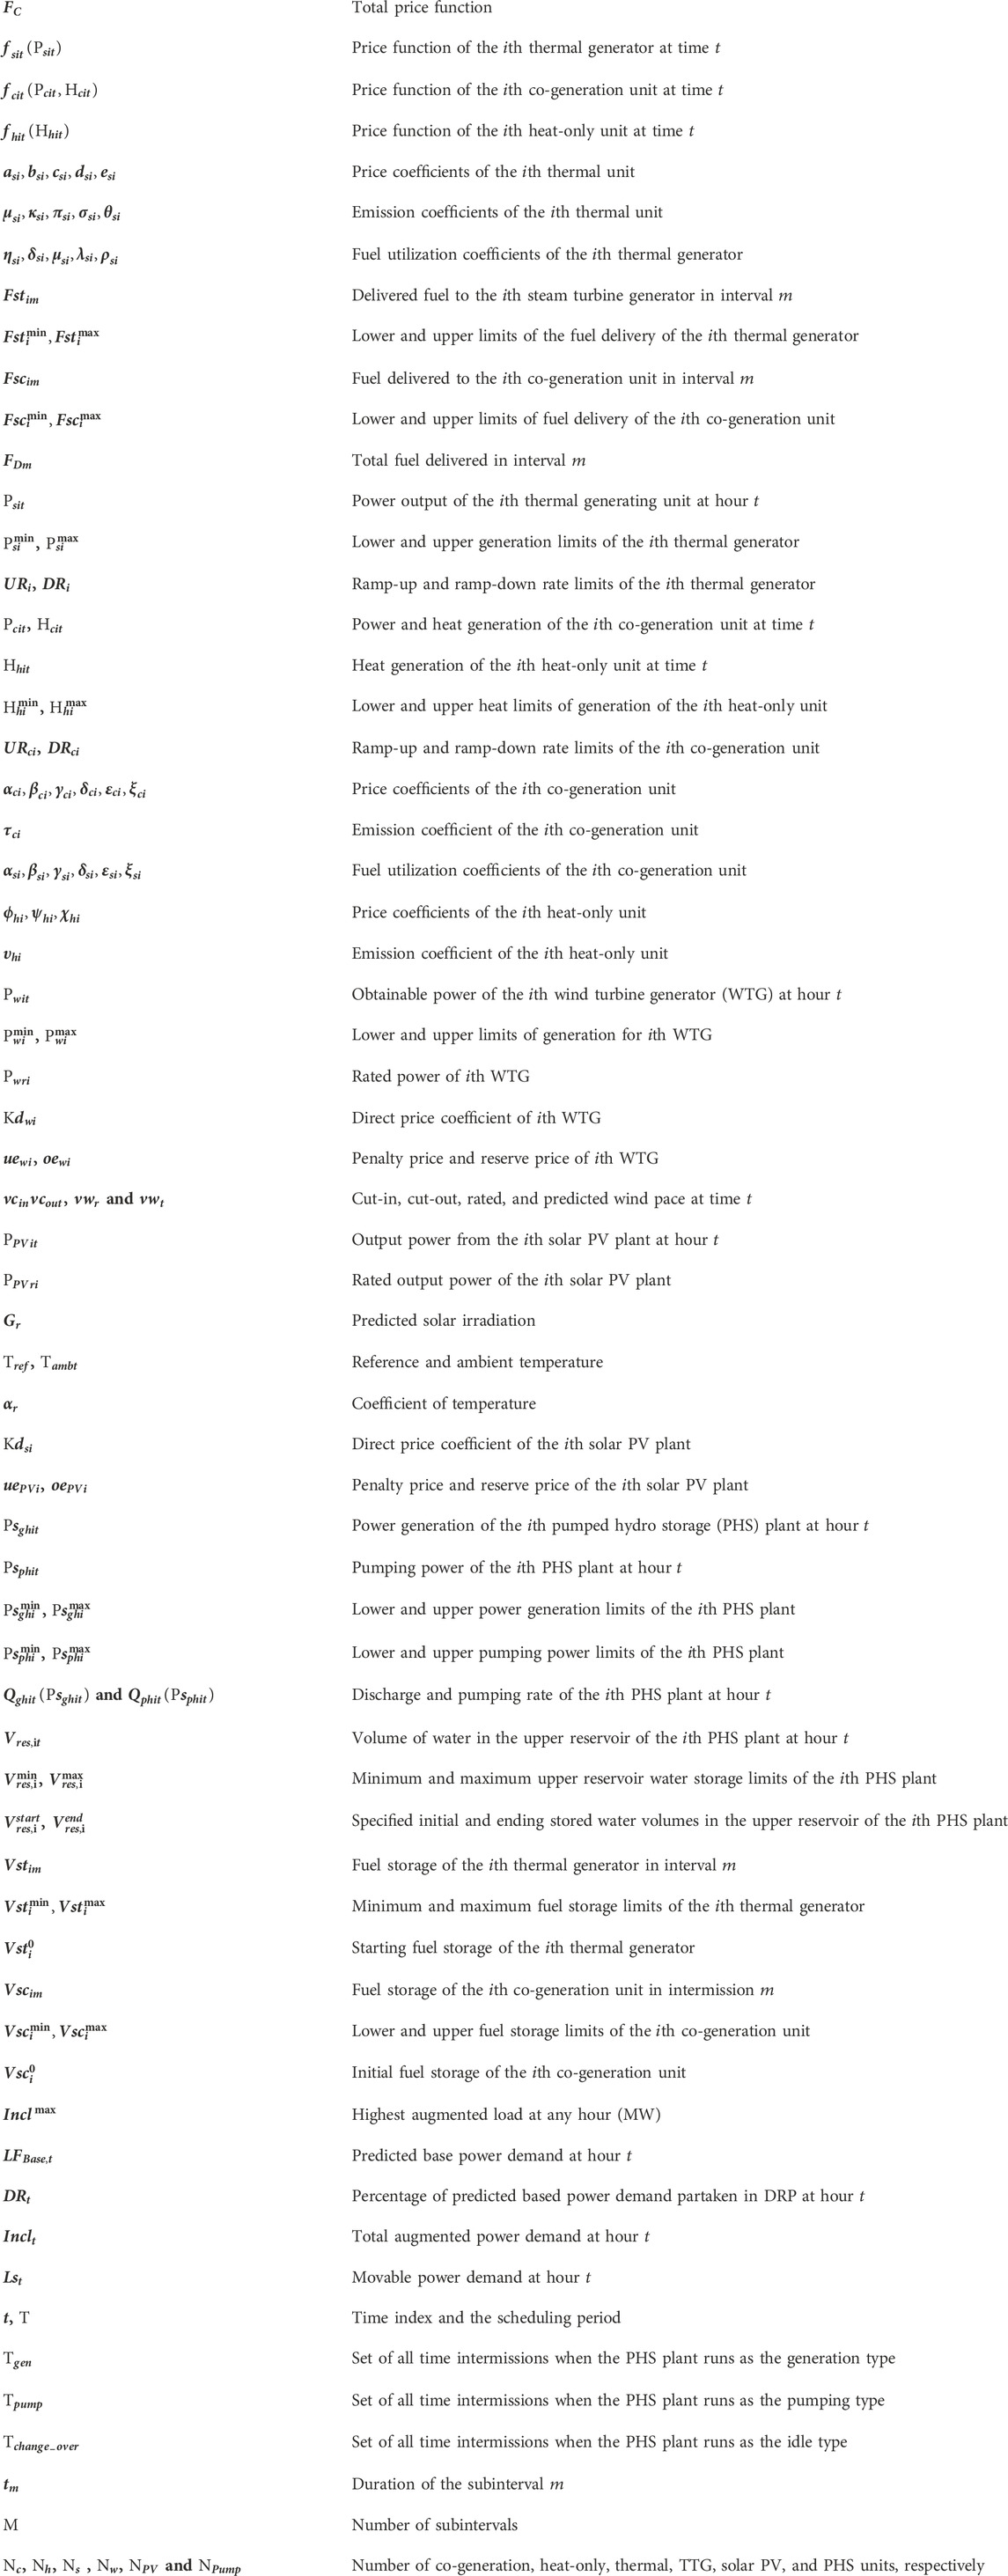
Nomenclature
Keywords: fuel-constrained co-generation units, fuel-constrained thermal generating units, demand-side management, dynamic economic environmental dispatch, optimization
Citation: Basu M, Jena C, Khan B, Ali A and Bokoro P (2023) Fuel-constrained joint heat and power dynamic economic environmental dispatch. Front. Energy Res. 11:1305076. doi: 10.3389/fenrg.2023.1305076
Received: 30 September 2023; Accepted: 01 December 2023;
Published: 20 December 2023.
Edited by:
Deepak Kumar, Birla Institute of Technology, IndiaReviewed by:
Minh Quan Duong, The University of Danang, VietnamMasoud Dashtdar, Islamic Azad University, Iran
Copyright © 2023 Basu, Jena, Khan, Ali and Bokoro. This is an open-access article distributed under the terms of the Creative Commons Attribution License (CC BY). The use, distribution or reproduction in other forums is permitted, provided the original author(s) and the copyright owner(s) are credited and that the original publication in this journal is cited, in accordance with accepted academic practice. No use, distribution or reproduction is permitted which does not comply with these terms.
*Correspondence: Baseem Khan, YmFzZWVtLmtoYW4wNEBnbWFpbC5jb20=