 Liu Yanfei
 Zhu Hejie1
 Li Long
94% of researchers rate our articles as excellent or good
Learn more about the work of our research integrity team to safeguard the quality of each article we publish.
Find out more
ORIGINAL RESEARCH article
Front. Energy Res. , 29 December 2023
Sec. Sustainable Energy Systems
Volume 11 - 2023 | https://doi.org/10.3389/fenrg.2023.1304272
Internal carbon pricing has the potential to positively influence enterprises’ carbon emissions. However, the strategies for implementing internal carbon pricing for enterprises and internal organizations remain unclear. In this study, employing a differential game research methodology, we design three implementation strategies for internal carbon pricing from a dynamic time perspective. Through comparative research and numerical analysis of these three different strategies’ effects on the changes in enterprise carbon emission reduction and goodwill, we find that for both enterprises’ carbon emission reduction and goodwill, Model C (implementing secondary investment for internal carbon fee collection) is optimal when the proportion of internal organizational revenue allocation is high and the proportion coefficient of internal carbon fee collection is low. When the proportion coefficient of internal carbon fee collection meets certain conditions, it makes the total profit of system under model C (implementing secondary investment for internal carbon fee collection) larger than the other two strategies. Due to short-sighted behavior, both enterprises’ profits and carbon emissions gradually decrease, leading to the internal carbon prices of enterprises under the three strategies will approach a stable value.
In recent years, China has proposed to actively implement the national independent contribution target and action plan for peaking carbon emissions in addressing climate change by 2030 and has formulated a system that focuses on carbon intensity control, supplemented by total carbon emission control, to support local and key industries and enterprises with necessary conditions to take the lead in achieving carbon emission peaks. While enterprises bear the responsibility of reducing greenhouse gas emissions and environmental management, their profit-oriented economic nature requires them to optimize their economic interests while taking relevant carbon emission reduction strategies.
Currently, carbon reduction mechanisms in enterprises can be divided into two types (Peng et al., 2022; Zhang and Meng, 2022): one is the administrative directive-based mechanism formed by the government’s imposition of carbon taxes, the establishment of carbon emission trading agencies, and the promulgation of carbon emission trading laws and regulations, which has been widely studied and accepted by many scholars. The other is the internal control self-initiated carbon reduction mechanism formed by employee incentives, financial methods, etc., but relatively less researched (Zhu et al., 2021). The achievement of carbon reduction goals cannot rely solely on administrative directive-based mechanisms but must be combined with other carbon reduction strategies (Chang and Wang, 2010; Ding et al., 2010; Sun et al., 2014; Lu et al., 2019). There is a growing trend for enterprises to internalize carbon pricing to better cope with the threat posed by the growing “carbon risk” (such as supply chain transportation risks caused by extreme weather damage and financial risks arising from it). For example, Volvo Car Group CEO Hanken Samuelsson signed the Glasgow Coupe Net Zero Declaration at COP26. He set internal carbon pricing within the business at a charge of SEK 1,000 per tonne of CO2 emissions to reduce carbon emissions in order to achieve the goal of becoming a global benchmark company for zero climate load by 2040 (Liu and Cao, 2023). As part of an internally controlled, self-directed carbon reduction mechanism, internal carbon pricing is seen as an efficient, flexible, and cost-saving carbon reduction management tool. Its implementation not only brings clear cost-sharing responsibilities to enterprises and internal organizations but also enhances their competitive advantages in the future low-carbon economy, in line with Porter’s statement that “appropriate environmental regulation can encourage enterprises to engage in more innovative activities, thereby offsetting corresponding costs and enhancing their profitability”. To address the shortcomings of previous studies, this paper takes carbon emission reduction as the key state variable and goodwill as another state variable to avoid the “carbon risk” crisis and survive better intangible assets (Kuo and Chang, 2021). Therefore, in this paper, we take corporate carbon emission reduction and corporate goodwill as two state variables to avoid the crisis of “carbon risk” and to survive better intangible assets. Then, we systematically analyze the combined effects of implementing different internal carbon pricing strategies on these two state variables. Finally, the implementation strategy suggestions are given, which will be of great significance and practical value.
The literature review of this paper consists of two main aspects: the use of differential games in carbon emission reduction research and research related to internal carbon pricing.
Differential game theory is a dynamic game theory in which multiple participants in a system continuously optimize their respective goals over a continuous period. It has been widely used by many scholars to study the first type of carbon reduction mechanism of enterprises. For instance, Zhao et al. (2016) investigated low-carbon development mechanisms that stimulate enthusiasm among local governments and enterprises based on social effects and constructed a political-enterprise dynamic differential game model for carbon emission reduction under two game scenarios. The analysis results showed that local governments providing support to enterprises can promote carbon emission reduction and thus drive the development of regional low-carbon economies. Wei and Wang (2021) constructed a differential game model based on the interactive mechanism between the government and enterprises to examine the mutual promotion effect between carbon emission reduction technology innovation by enterprises and government regulation. Mao and Wang (2022) used local enterprises in developing countries along the “Belt and Road” as subjects to construct a differential game model and studied the effect of investment and emission reduction with the promotion of enterprises in carbon emission reduction, low-carbon infrastructure investment, and low-carbon products. In addition to the above researchers who used differential game theory to study carbon emission reduction in political-enterprise relationships, it has also been widely applied in the study of carbon emission reduction in supply chain systems. Zhao et al. (2016) considered the intertemporal nature and low-carbon demand characteristics of emission reduction cooperation, achieving emission reduction and profit improvement for supply chain systems and enterprise members. Hou et al. (2020) constructed a differential game model under two mechanisms of a carbon trading system and emission reduction cost-sharing contract, considering the impact of consumer low-carbon preferences and uncertainty on carbon emission reduction behavior, and investigated the dynamic investment decision-making problem of emission reduction technology for manufacturers and retailers. Sun et al. (2020) considered the lag time of emission reduction technology and consumer low-carbon preferences, constructed a differential game model for manufacturers and suppliers in the supply chain, and studied the problem of carbon emissions transfer and reduction among enterprises. Most of the above research is based on the first type of administrative directive emission reduction mechanism, and revolves around the construction of carbon reduction differential game models for political-enterprise relationships and supply chain systems.
Previous scholars have mainly focused on the effectiveness of internal carbon pricing, shadow pricing, and implicit pricing methods in the daily carbon reduction management process of enterprises (Harpankar, 2019). Based on this foundation, researchers have also studied the driving factors for the use of internal carbon pricing (Aldy, 2019; Ben-Amar et al., 2022), to demonstrate its positive impact on investment evaluation, risk management, and strategic planning, which effectively prevent “carbon risk” from being eliminated by future markets. In addition, Bento and Gianfrate (2020); Bento et al. (2021) believe that national climate policies, national development, industry, and corporate management largely determine the use of internal carbon pricing. In terms of research on the application of internal carbon pricing, foreign scholars such as Oliver Gregor Gorbach first summarized the motivation for using internal carbon pricing and different methods of internal carbon pricing, described the impact of internal carbon pricing, and identified implementation obstacles, producing a process flowchart for identifying internal carbon pricing implementation (Gorbach et al., 2022). They then compared the internal carbon price with the potential regulatory carbon price in different countries using different optimization models and analyzed the differences in internal carbon prices in different countries (Gorbach et al., 2021). Finally, in the context of energy carriers, they compared the robustness of uncertain internal carbon prices in energy systems. In addition to its application in energy systems (Gorbach and Thomsen, 2022), scholars have also studied the application of internal carbon pricing in the education industry. For example, Barron et al. (2020); Lee and Lee (2022), studied the potential impact of internal carbon pricing on carbon reduction in higher education institutions, to illustrate the main benefits of internal carbon pricing in expanding campus carbon neutrality initiatives, and to discuss how schools and other institutions can use internal carbon pricing to improve the climate. However, enterprises face certain barriers in implementing internal carbon pricing, as discussed by Riedel et al. (2021), who explore the reasons why German companies do not adopt internal carbon pricing mechanisms, particularly due to the severe challenges that small German companies face in mobilizing the financial, technological, and informational resources required for internal carbon pricing implementation.
We use Table 1 to show the differences between our study and existing studies.
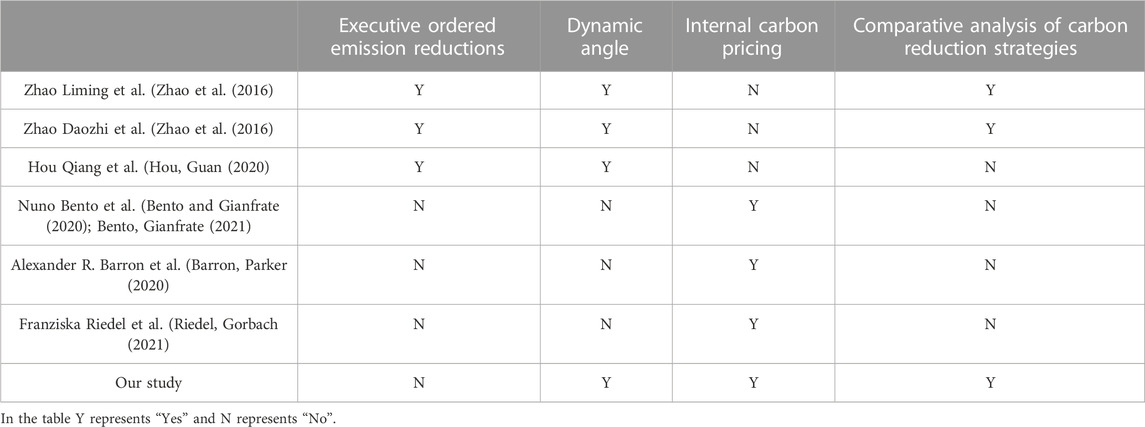
TABLE 1. Comparison of research content.
According to the combing of the above literature and Table 1, it can be found that most scholars have conducted research on enterprises’ carbon reduction based on the first type of administrative directive emission reduction mechanism. Research on internal carbon pricing within enterprises is conducted from the perspective of static case studies such as concept definition and driving factors, with few scholars studying and designing internal carbon pricing strategies for enterprises, and lacking specific analysis of the impact of internal carbon pricing strategies on carbon reduction. Building on the models for enterprises’ carbon reduction and the background of internal carbon pricing described in the literature above, this paper employs differential game theory to construct three-game strategies for implementing internal carbon pricing and analyzes the long-term dynamic impact of the three strategies on corporate carbon reduction and corporate reputation.
In this paper, we consider the internal carbon fee as the implementation strategy among the three methods of internal carbon pricing for enterprises. Enterprises need to impose actual internal carbon fees on their internal organizations, thus considering the internal organizations as the recipients of the internal carbon pricing strategy, while the enterprises as the implementers. The objective of this system is to achieve a balance of power, responsibility, and interests among relevant stakeholders through internal control mechanisms within the enterprise. It aims to enhance the cooperative capabilities of all parties involved, reduce operational risks for the enterprise, and make the achievement of expected carbon emission reduction goals more predictable. In this section, we list the symbols applied in this study as well as the assumption statements.
The symbols applied in this paper are shown in Table 2:
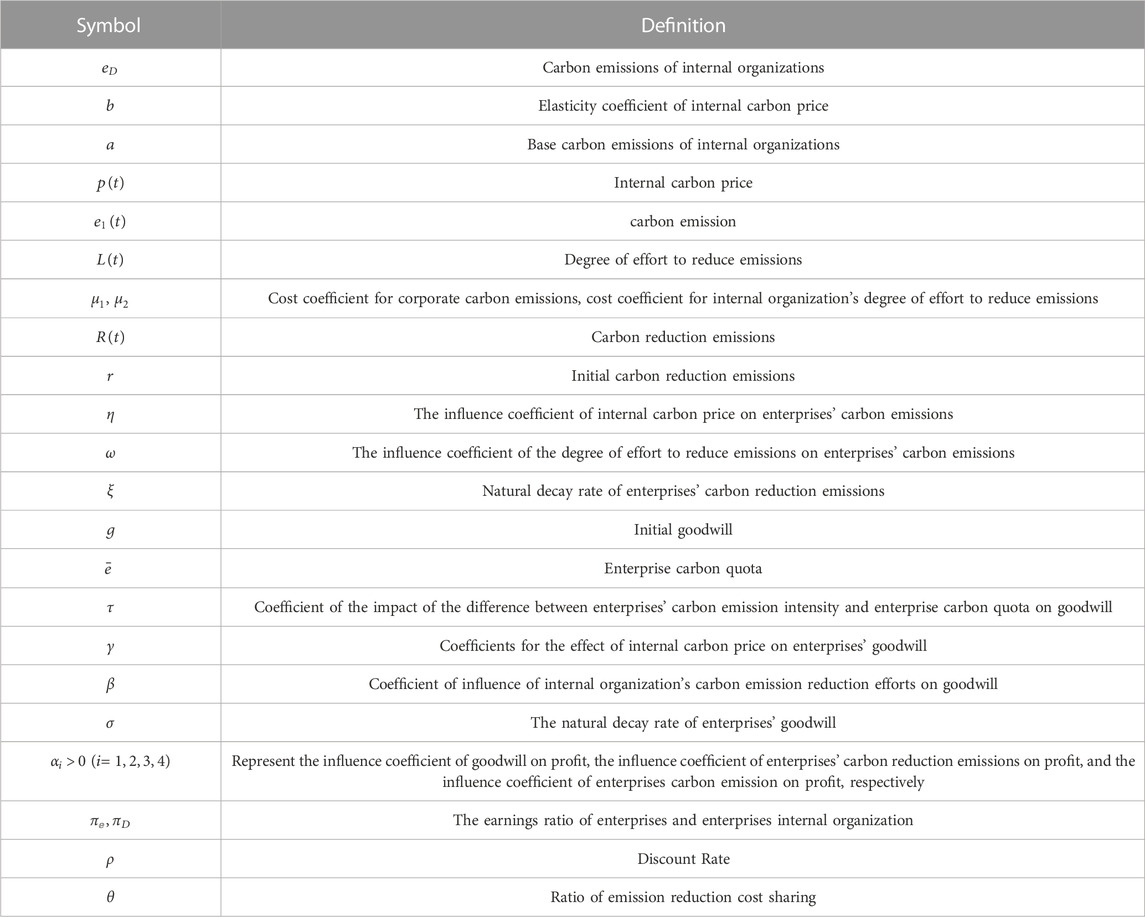
TABLE 2. Description of symbols.
Assumption 1: When considering the impact of internal carbon pricing on carbon emissions, an increase in carbon price will lead to a reduction in carbon emissions from internal organizations, and vice versa. Drawing on the findings from Ma and Kuo (2021), this negative correlation can be expressed as a linear equation, as shown in Eq. 1.
In the equation,
Assumption 2: Drawing on the literature (Xu and Tan, 2021; Zheng et al., 2021), the cost of producing products for the enterprise,
Drawing on the literature (Zhao et al., 2016; Zhang et al., 2018), consider internal organizations to measure their abatement efficiency in terms of abatement effort
where
Assumption 3: Drawing on the literature (Lee and Lee, 2022), it is assumed that enterprises’ carbon emission reduction
where
Assumption 4: The adoption of internal carbon pricing by enterprises for self-regulation and the level of carbon emission reduction efforts within their internal organization can have a positive impact on the enterprises’ reputation, aiding in carbon risk management and planning. Building upon the findings of reference (Nerlove and Arrow, 1962), the goodwill model is modified to obtain the following differential equation, as shown in Eq. 6:
where
Assumption 5: Carbon dioxide, as a by-product of production, has a relationship between its emissions and enterprises’ benefits. Drawing on the models in the literature (Jiang and You, 2019; Xu and Tan, 2021) on the relationship between enterprises’ production benefits and pollution emissions, and considering that enterprises’ profits are influenced by goodwill and carbon emission reductions, the enterprise benefits are expressed as Eq. 7:
where
Assumption 6: The profits of enterprises and their internal organizations are distributed between them, assuming that they are allocated according to the benefit allocation ratio
The internal organizations are considered the controlled objects for the implementation of internal carbon pricing, and the enterprises are the controlling subject. The objective of this system is to achieve a balance of power, responsibility, and interests among the relevant stakeholders through internal control, enhancing their cooperation and reducing their operational risks. This, in turn, leads to a more predictable achievement of the expected carbon emission reduction targets. Building upon the assumptions and descriptions outlined in the introduction, to better verify the emission reduction effect of implementing internal carbon pricing, three decision models in the following decision table are considered, as shown in Table 3:
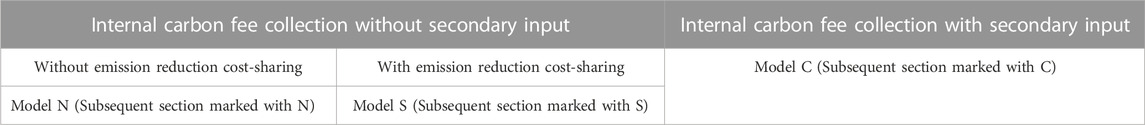
TABLE 3. Table on decisions.
In this system, two game subjects are defined: enterprises and internal organizations. There are four control variables:
In this model, enterprises will charge a complete internal carbon fee to internal organizations without implementing secondary investment, and internal organizations will not receive any cost subsidies. As a result, the cost-sharing ratio for emission reduction
Proposition 1: In model N:
(1) The equilibrium strategies for the internal carbon price, internal organizational emission reduction efforts, and the enterprises’ carbon emissions are defined as follows:
To ensure positive carbon emissions, where:
(2) The optimal trajectories of enterprises’ goodwill and carbon emission reductions, respectively, are:
Where,
(3) The profit of system members and the total profit of the system are respectively:
Proposition 1 proof can be found in Supplementary Appendix SA1.
Corollary 1: Based on Proposition 1, the following conclusions can be drawn:
(1)
This indicates that the level of emission reduction efforts within internal organizations is positively correlated with the distribution ratio of profits and inversely correlated with the discount rate. The greater the share of profits allocated to internal organizations, the lower the discount rate, which encourages internal organizations to actively engage in emission reduction efforts.
This indicates that the internal carbon price is inversely proportional to the discount rate and directly proportional to the distribution ratio of enterprises’ profits and the baseline carbon emissions of internal organizations. Furthermore, the enterprises’ carbon emissions are directly proportional to the distribution ratio of profits and the discount rate. It can be observed that for enterprises with higher carbon emission demands, a higher internal carbon price is required to constrain them.
(3) It can be deduced from
In this model, enterprises continue to fully charge internal carbon fees without secondary investments. However, as enterprises hold a leadership position and aim to incentivize internal organizations to reduce emissions, a cost subsidy is considered to share the cost of their emission reduction efforts, denoted by the cost allocation ratio
Proposition 2: In Model S:
(1) The optimal equilibrium strategies for internal carbon pricing, internal organizational efforts for emission reduction, enterprises’ carbon emissions, and cost allocation ratio are as follows:
(2) The optimal trajectories of enterprises’ goodwill and carbon emission reductions are:
Where,
(3) The profit of system members and the total profit of the system are respectively:
The proof of Proposition 2 follows a similar approach as the proof of Proposition 1 and will not be repeated here for brevity.
Corollary 2: By Proposition 2 it is known that:
(1) Only when
(2)
Corollary 2 demonstrates that as rational actors with absolute dominance, enterprises are only willing to implement cost-sharing strategies for internal organizations’ emission reduction when their profits meet certain conditions. Moreover, the larger the distribution of their profits, the greater the cost of emission reduction shared by enterprises.
In Model C, considering the collaborative relationship between enterprises and internal organizations, a carbon fee collection coefficient
Proposition 3: In Model C:
(1) The optimal equilibrium strategies for enterprises’ internal carbon price, the level of internal organizational effort to reduce emissions, and enterprises’ carbon emissions, respectively, are:
(2) The optimal trajectories for enterprises’ goodwill and carbon emission reduction are as follows:
Where,
(3) The total profit of the system is:
The proof of Proposition 3 follows a similar approach as the proof of Proposition 1 and will not be repeated here for brevity.
Corollary 3: By Proposition 3 it is known that:
(1)
This indicates that in Model C, the coefficient of internal carbon fee collection is inversely proportional to the internal carbon price. In other words, when the actual amount of internal carbon fee collected by enterprises increases, enterprises tend to set a lower internal carbon price.
(2) There is a maximum point in the internal carbon fee collection ratio coefficient
This indicates that in model C, the coefficient
The proof of Corollary 3 can be found in Supplementary Appendix SA1.
From Corollary 3, it can be found that the coefficient
This section presents comparative analyses of the optimal equilibrium strategies of the enterprises and internal organizations, the stable values of goodwill and carbon reduction emissions, and the total profits of the system across the three models. It further investigates the impact of the range of the carbon fee collection coefficient
Corollary 4: When
According to Corollary 4, under certain conditions, the following observations can be made: In Model C, the internal carbon price of enterprises is the lowest. In Models N and S, the carbon emissions of enterprises remain constant and are lower than in Model C. In Model C, internal organizationS exhibit the highest level of effort.
Corollary 5: Comparative analysis of the stable values of goodwill and carbon emission reductions in the three models reveals the following observations:
(1) When
(2) When constraint 1 is satisfied, we have
(3) When constraint 4 is satisfied, we have
The proof of Corollary 5 can be found in Supplementary Appendix SA1.
According to Corollary 5, it can be concluded that under the conditions of
Corollary 6: Comparative analysis of the total system profit in the three models reveals the following findings:
(1) When
(2) Due to the varying relationships between
According to Figure 1, when
The proof of Corollary 6 is shown in Supplementary Appendix SA1.
From Corollary 6, we know that when
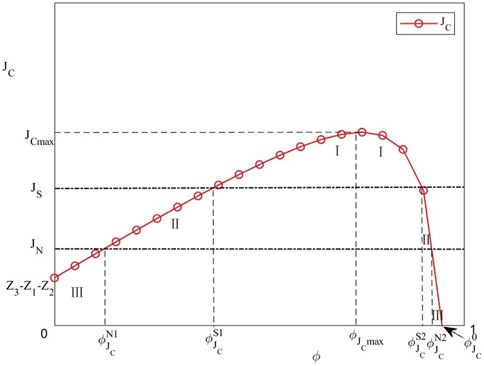
FIGURE 1. Relationship between
The preceding content primarily analyzes the differences in various internal carbon pricing strategies from a theoretical perspective by constructing models and solving them. This section mainly uses numerical analysis to further study the impact of relevant parameters on the optimal equilibrium strategy, goodwill, carbon reduction, and total system profit and then draws conclusions. Under the conditions of
Keeping other parameters constant, we set the initial carbon emission reduction value of enterprises as
According to Figures 2, 3, under certain conditions, the following observations can be made: (1) The carbon emission reduction and goodwill values gradually increase in all three scenarios and eventually converge to stable values. (2) The carbon emission reduction and goodwill values in Model S are consistently higher than those in Model N throughout the evolutionary process. (3) As the internal carbon fee collection ratio coefficient
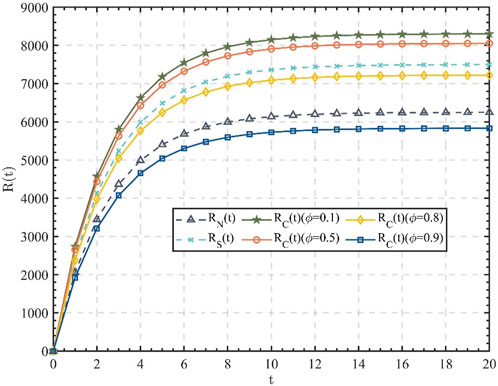
FIGURE 2. The optimal trajectory of enterprises’ carbon reduction.
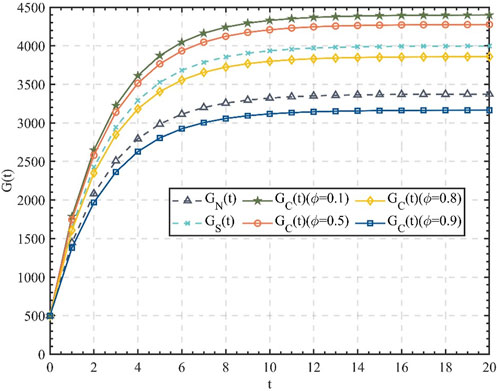
FIGURE 3. The optimal trajectory of enterprises’ goodwill.
According to Figures 4, 5, the following observations can be made: In Region I, we have
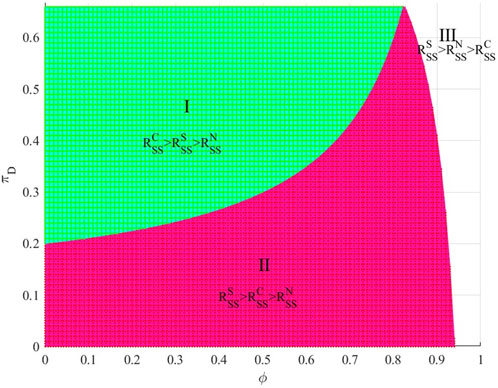
FIGURE 4. The optimal strategies for carbon emission reduction under different conditions of
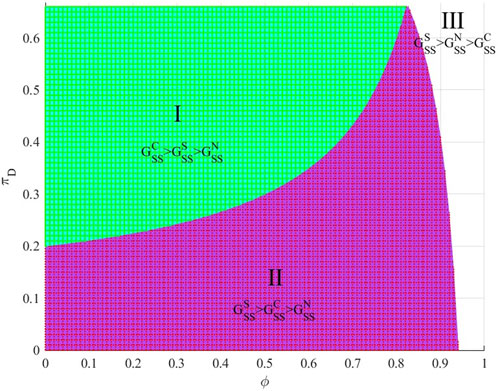
FIGURE 5. The optimal strategies for enterprises’ goodwill under different conditions of
By setting
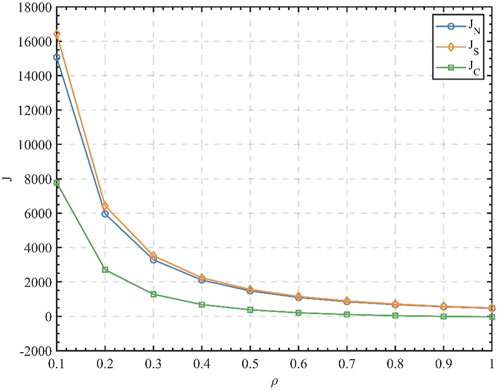
FIGURE 6. The impact of
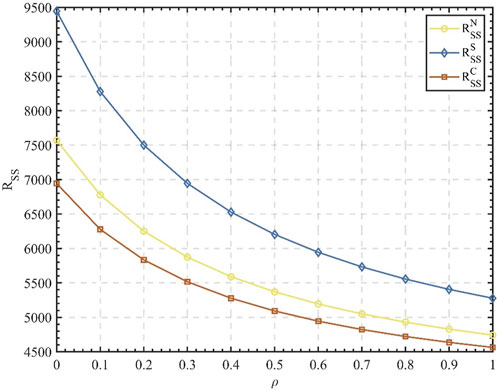
FIGURE 7. The impact of
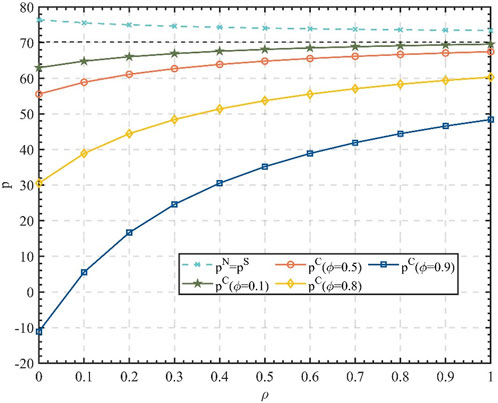
FIGURE 8. The impact of

FIGURE 9. The impact of
Based on Figures 6, 7, the following observations can be made:
(1) As the discount rate
(2) According to Figure 8, the presence of short-sighted behavior leads to a convergence of internal carbon prices across the three-game strategies, approaching a stable value. In this case, both Model N and Model S consistently exhibit higher internal carbon prices compared to Model S. This indicates that to maximize their interests, enterprises tend to choose a higher internal carbon price to maintain good carbon emission performance when the internal carbon fee is fully collected without second investment. On the other hand, due to the second investment in internal carbon fees, which results in higher carbon emission reduction and greater efforts from the internal organization, enterprises can achieve better social goodwill. In this scenario, enterprises are inclined to choose a lower internal carbon price.
(3) Combining Figures 8, 9, it can be observed that the stable values of carbon emission reduction, enterprises’ goodwill, and internal carbon price under Model C decrease continuously with an increasing internal carbon fee collection ratio, represented by
The differential game model can accurately capture the complex interactions and game relationships between the dominant player (enterprise) and the followers (internal organization) in carbon pricing within the enterprise. Thus, it truly reflects the influence of internal organizations’ willingness to collaborate on carbon pricing decisions, which makes the study closer to the actual situation. Moreover, the researchers are able to dynamically compare different internal carbon pricing strategies through the differential game model, so as to gain a deeper understanding of the impacts of different strategies on carbon emission reduction and goodwill of enterprises, and to provide more informed choices for corporate decision makers in the formulation of carbon management strategies. Finally, the model allows for the consideration of time dynamics, which reveals the changing trends of enterprise carbon emission reduction and goodwill during the evolution process, providing valuable information for long-term planning and strategy formulation for enterprises to better adapt to the dynamic changes in the market and environment. The above three aspects jointly show the outstanding contribution of differential game model in the research of internal carbon pricing, and provide strong theoretical support and practical guidance for enterprises. This paper investigates the impact of three dynamic strategies for internal carbon pricing on enterprises’ carbon emission reduction and goodwill. The study focuses on the interaction between the controlling party, represented by the enterprises, and the controlled party, represented by internal organizations, by constructing a differential game model. The following conclusions are drawn from the analysis:
(1) Under certain conditions, the carbon emission reduction and goodwill of enterprises under the three strategies gradually increase over time and reach a stable level. In the evolutionary process, the carbon emission reduction and goodwill values of enterprises under Model S (implementing internal carbon pricing without secondary investment and with shared emission reduction costs) are consistently higher than those under Model N ((implementing internal carbon pricing without secondary investment and shared emission reduction costs). When the internal organization’s profit distribution ratio
(2) According to the analysis of the variations in the discount rate
This study has designed and supplemented the implementation strategies for internal carbon pricing and further validated the impact of internal carbon pricing on enterprises’ carbon reduction and goodwill (Zhang, Lou, 2018). This provides recommendations for enterprises in dealing with uncertain carbon risks in the future and offers new insights into carbon pricing and enterprises’ carbon regulation. The management implications are as follows: when applying internal carbon pricing, enterprises should focus on setting clear carbon emission reduction targets, taking into account changes in internal and external environments, motivating collaboration among internal organizations, and ensuring that internal pricing is consistent with corporate strategy. First, transparency and communication are key. Enterprises need to ensure that employees understand the purpose and mechanism of carbon pricing, and build employee identity with carbon reduction targets. Second, enterprises should continuously monitor and evaluate the effect of carbon emission reduction in combination with the carbon market mechanism to lay a foundation for timely adjustment of strategies. In addition, companies can improve employee awareness of carbon emission reduction through education and training, and incorporate internal carbon pricing into corporate social responsibility to demonstrate a sense of environmental responsibility and enhance corporate image. Ultimately, ensuring compliance and policy alignment of carbon pricing strategies will help companies better address climate change challenges and achieve sustainable business goals.
However, this paper has limitations in that it only examines the implementation strategies of internal carbon fees among the three internal carbon pricing methods, without considering shadow pricing and implicit pricing. These areas represent future research priorities.
The original contributions presented in the study are included in the article/Supplementary Material, further inquiries can be directed to the corresponding author.
LY: Conceptualization, Data curation, Formal Analysis, Investigation, Methodology, Project administration, Resources, Software, Supervision, Validation, Visualization, Writing–original draft. ZH: Conceptualization, Data curation, Formal Analysis, Investigation, Methodology, Project administration, Resources, Software, Supervision, Validation, Visualization, Writing–original draft, Writing–review and editing. BE: Conceptualization, Data curation, Formal Analysis, Investigation, Methodology, Project administration, Resources, Software, Supervision, Validation, Visualization, Writing–original draft, Writing–review and editing. LL: Conceptualization, Formal Analysis, Investigation, Methodology, Project administration, Resources, Supervision, Validation, Visualization, Writing–original draft, Writing–review and editing.
The author(s) declare that no financial support was received for the research, authorship, and/or publication of this article.
The authors declare that the research was conducted in the absence of any commercial or financial relationships that could be construed as a potential conflict of interest.
All claims expressed in this article are solely those of the authors and do not necessarily represent those of their affiliated organizations, or those of the publisher, the editors and the reviewers. Any product that may be evaluated in this article, or claim that may be made by its manufacturer, is not guaranteed or endorsed by the publisher.
The Supplementary Material for this article can be found online at: https://www.frontiersin.org/articles/10.3389/fenrg.2023.1304272/full#supplementary-material
Aldy, J. E., and Gianfrate, G. (2019). Future-proof your climate strategy. Harv. Bus. Rev. 4, 16–86.
Barron, A. R., Parker, B. J., Sayre, S. S., Weber, S. S., and Weisbord, D. J. (2020). Carbon pricing approaches for climate decisions in US higher education: proxy carbon prices for deep decarbonization. Elem. Sci. Anth 8, 42. doi:10.1525/elementa.443
Ben-Amar, W., Gomes, M., Khursheed, H., and Marsat, S. (2022). Climate change exposure and internal carbon pricing adoption. Bus. Strategy Environ. 31, 2854–2870. doi:10.1002/bse.3051
Bento, N., and Gianfrate, G. (2020). Determinants of internal carbon pricing. Energy Policy 143, 111499. doi:10.1016/j.enpol.2020.111499
Bento, N., Gianfrate, G., and Aldy, J. E. (2021). National climate policies and corporate internal carbon pricing. Energy J. 42, 89–100. doi:10.5547/01956574.42.5.nben
Chang, Y., and Wang, N. (2010). Environmental regulations and emissions trading in China. Energy Policy 38, 3356–3364. doi:10.1016/J.ENPOL.2010.02.006
Ding, H., Zhang, P., and Huo, G. (2010). Function and countermeasures on voluntary emissions in building domestic carbon emissions trading market. Sci. Technol. Prog. Policy 27, 149–151. doi:10.3969/j.issn.1001-7348.2010.22.035
Dye, C.-Y. (2020). Optimal joint dynamic pricing, advertising and inventory control model for perishable items with psychic stock effect. Eur. J. Operational Res. 283, 576–587. doi:10.1016/j.ejor.2019.11.008
Gorbach, O. G., Hussein, N. S., and Thomsen, J. (2021). Impact of internal carbon prices on the energy system of an organisation’s facilities in Germany, Japan and the United Kingdom compared to potential external carbon prices. Energies 14, 4094. doi:10.3390/EN14144094
Gorbach, O. G., Kost, C., and Pickett, C. (2022). Review of internal carbon pricing and the development of a decision process for the identification of promising Internal Pricing Methods for an Organisation. Renew. Sustain. Energy Rev. 154, 111745. doi:10.1016/j.rser.2021.111745
Gorbach, O. G., and Thomsen, J. (2022). Comparing the energy system of a facility with uncertainty about future internal carbon prices and energy carrier costs using deterministic optimisation and two-stage stochastic programming. Energies 15, 3836. doi:10.3390/en15103836
Harpankar, K. (2019). Internal carbon pricing: rationale, promise and limitations. Carbon Manag. 10, 219–225. doi:10.1080/17583004.2019.1577178
Hou, Q., Guan, Y., and Yu, S. (2020). Stochastic differential game model analysis of emission-reduction technology under cost-sharing contracts in the carbon trading market. Ieee Access 8, 167328–167340. doi:10.1109/ACCESS.2020.3023391
Jiang, K., and You, D. (2019). Study on differential game of transboundary pollution control under regional ecological compensation. China Population,Resources Environ. 29, 135–143. doi:10.12062/cpre.20180903
Kuo, L., and Chang, B. (2021). Ambitious corporate climate action: impacts of science-based target and internal carbon pricing on carbon management reputation-evidence from Japan. Sustain. Prod. Consum. 27, 1830–1840. doi:10.1016/J.SPC.2021.04.025
Lee, S., and Lee, S. (2022). University leadership in climate mitigation: reducing emissions from waste through carbon pricing. Int. J. Sustain. High. Educ. 23, 587–603. doi:10.1108/ijshe-01-2021-0006
Li, S., Zhang, J., and Tang, W. (2014). Joint dynamic pricing and inventory control policy for a stochastic inventory system with perishable products. Int. J. Prod. Res. 53, 2937–2950. doi:10.1080/00207543.2014.961206
Liu, X., and Cao, L. (2023). Impacts and countermeasures on automotive industry. Automot. Dig., 55–62. doi:10.19822/j.cnki.1671-6329.20230159
Lu, M., Cang, Y., and Li, Y. (2019). Do enterprises choose voluntary emissions trading outside mandatory mechanism? China Population,Resources Environ. 29, 21–29. doi:10.12062/cpre.20181120
Ma, J., and Kuo, J. (2021). Environmental self-regulation for sustainable development: can internal carbon pricing enhance financial performance? Bus. Strategy Environ. 30, 3517–3527. doi:10.1002/BSE.2817
Mao, X., and Wang, Y. (2022). Cooperative carbon emission reduction through the belt and Road initiative. Environ. Sci. Pollut. Res. 29, 10005–10026. doi:10.1007/s11356-021-16130-4
Nerlove, M., and Arrow, K. J. (1962). Optimal advertising policy under dynamic conditions. Economica, 167–168. doi:10.1007/978-3-642-51565-1_54
Peng, Y., Xiong, L., Li, J., Yi, J., and Li, H. (2022). Status and trend of global carbon pricing mechanism and its impacts on petroleum industry. China Pet. Explor. 27, 41–53. doi:10.3969/j.issn.1672-7703.2022.06.005
Riedel, F., Gorbach, G., and Kost, C. (2021). Barriers to internal carbon pricing in German companies. Energy Policy 159, 112654. doi:10.1016/j.enpol.2021.112654
Shi, R., and You, C. (2023). Dynamic pricing and investment for fashion products under reference effect. Int. Trans. Operational Res. doi:10.1111/itor.13269
Sun, L., Cao, X., Alharthi, M., Zhang, J., Taghizadeh-Hesary, F., and Mohsin, M. (2020). Carbon emission transfer strategies in supply chain with lag time of emission reduction technologies and low-carbon preference of consumers. J. Clean. Prod. 264, 121664. doi:10.1016/j.jclepro.2020.121664
Sun, R., Kuang, D., and Chang, D. (2014). Analysis on carbon trading effects upon energy-economic-environment and calculation of reasonable carbon price intervals. China Population,Resources Environ. 24, 82–90. doi:10.3969/j.issn.1002-2104.2014.07.013
Wei, J., and Wang, C. (2021). Improving interaction mechanism of carbon reduction technology innovation between supply chain enterprises and government by means of differential game. J. Clean. Prod. 296, 126578. doi:10.1016/J.JCLEPRO.2021.126578
Xu, H., and Tan, D. (2021). Researchon regional cooperative pollution control and dynamic payment distribution strategy. Chin. J. Manag. Sci. 29, 65–76. doi:10.16381/j.cnki.issn1003-207x.2019.0620
Zhang, H., and Meng, J. (2022). Carbon emission abatement effect of China’s carbon market from the perspective of incentives and constraints. Resour. Sci. 44, 1759–1771. doi:10.18402/resci.2022.09.02
Zhang, Y., Lou, G., and Chang, X. (2018). Differential game of carbon abatement and low-carbon promotion considering reference effect. Industrial Eng. Manag. 23, 107–113+121. doi:10.19495/j.cnki.1007-5429.2018.02.015
Zhao, D., Yuan, B., and Xu, C. (2016b). Dynamic coordination strategy of vertical cooperative on carbon emission reduction in supply chain under low-carbon era. J. Industrial Engineering/Engineering Manag. 30, 147–154. doi:10.13587/j.cnki.jieem.2016.01.018
Zhao, L., Chen, Z., and Liu, J. (2016a). Low-carbon cooperative strategy between government and enterprise based on differential games. Syst. Eng. 34, 84–90.
Zheng, J., Dong, J., and Ren, T. (2021). A stochastic differential cooperative game based on the third-party governance of environmental pollution. J. Manag. Sci. China 24, 76–93. doi:10.19920/j.cnki.jmsc.2021.07.005
Keywords: internal carbon pricing, differential game, goodwill, enterprise carbon reduction emissions, carbon emission
Citation: Yanfei L, Hejie Z, E B and Long L (2023) From a long-term dynamic perspective: how should internal carbon pricing be implemented?. Front. Energy Res. 11:1304272. doi: 10.3389/fenrg.2023.1304272
Received: 29 September 2023; Accepted: 04 December 2023;
Published: 29 December 2023.
Edited by:
Dongdong Yuan, Chang’an University, ChinaReviewed by:
Fan Zhang, Aalto University, FinlandCopyright © 2023 Yanfei, Hejie, E and Long. This is an open-access article distributed under the terms of the Creative Commons Attribution License (CC BY). The use, distribution or reproduction in other forums is permitted, provided the original author(s) and the copyright owner(s) are credited and that the original publication in this journal is cited, in accordance with accepted academic practice. No use, distribution or reproduction is permitted which does not comply with these terms.
*Correspondence: Liu Yanfei, bGl1eWZAcy5ocmJjdS5lZHUuY24=
Disclaimer: All claims expressed in this article are solely those of the authors and do not necessarily represent those of their affiliated organizations, or those of the publisher, the editors and the reviewers. Any product that may be evaluated in this article or claim that may be made by its manufacturer is not guaranteed or endorsed by the publisher.
Research integrity at Frontiers
Learn more about the work of our research integrity team to safeguard the quality of each article we publish.