- State Grid Shanghai Electric Power Company, Shanghai, China
Introduction: Power load forecasting and market price analysis have become crucial in the context of complex power energy systems and volatile market prices. Deep learning technology has gained significant attention in time series forecasting, and this article aims to enhance the accuracy and reliability of power load and market price predictions by integrating and optimizing deep learning models.
Methods: We propose a deep learning framework that combines artificial neural networks (ANNs), long short-term memory (LSTM), and transformer models to address key challenges in electricity load forecasting and market price prediction. We leverage ANNs for their versatility and use LSTM networks for sequence modeling to generate initial predictions. Additionally, we introduce transformer technology and utilize its self-attention mechanism to capture long-distance dependencies within the data, further enhancing the model’s performance.
Results: In our experiments, we validate the proposed framework using multiple public datasets. We compare our method with traditional forecasting approaches and a single-model approach. The results demonstrate that our approach outperforms other methods in predicting power load and market prices. This increased accuracy and reliability in forecasting can be of significant value to decision-makers in the energy sector.
Discussion: The integration of deep learning models, including ANN, LSTM, and transformer, offers a powerful solution for addressing the challenges in power load and market price prediction. The ability to capture long-distance dependencies using the transformer's self-attention mechanism improves forecasting accuracy. This research contributes to the field of energy and finance by providing a more reliable framework for decision-makers to make informed choices in a complex and dynamic environment.
1 Introduction
In today’s world, the supply and demand relationship of electric energy and market price fluctuations have increasingly become key issues in the field of global energy. As one of the infrastructures of modern society, electricity directly affects the country’s development, industrial production, and people’s lives. However, the continuous increase in energy consumption leads to the increased complexity of the power system. How to ensure the stability of power supply and the rationality of market prices has become an urgent challenge that needs to be solved (Mujeeb et al., 2019). Electric power loadforecasting and market price analysis have become critical in the field of energy and finance. Electric power load forecasting can help power system operators rationally plan energy supply and effectively allocate resources, thereby improving the efficiency and reliability of the power system, while market price fluctuations directly affects the investment decisions and returns of energy market participants. Accurately predicting price changes in the electricity market can help investors gain greater returns in the market.
The main objective of this study is to conduct electricity load forecasting and market price analysis to solve key issues in the energy and financial sectors. Electricity load forecasting is an important task related to balancing power supply and demand, while market price analysis is of strategic importance to energy market participants, including suppliers and investors. We selected these two as study subjects because they play an integral role in modern society.
The importance of power load forecasting is self-evident. As the complexity of power systems continues to increase, energy suppliers and power network managers need to accurately predict power loads in order to rationally allocate resources and adjust power generation plans. This is a regression problem because our goal is to predict continuous electrical load values in order to better meet demand, reduce waste, and improve energy efficiency. Therefore, our research methods and metrics are matched to the regression problem to ensure that we can provide accurate electricity load forecasts. Market price analysis is equally important. With the continuous development of new energy technologies, the energy market has become more complex and price fluctuations have become more frequent. Investors need to understand market price trends and fluctuations in order to develop smart investment strategies. This is also a regression problem since our goal is to predict continuous market price fluctuations to help decision-makers make more informed financial decisions. Our research methods and metrics are aligned with this goal to ensure reliability in market price forecasts.
Deep learning technology has great potential in solving these problems. We selected to integrate artificial neural networks (ANNs), long short-term memory (LSTM) networks, and transformer models because their respective advantages can complement each other to improve prediction accuracy (Dabbaghjamanesh et al., 2020). ANN is versatile, LSTM is good at sequence modeling, and the transformer introduces a self-attention mechanism that can capture long-distance dependencies. This integrated approach is expected to provide more accurate and reliable solutions for power load forecasting and market price analysis.
As the complexity of power systems continues to increase, and market prices fluctuate, researchers and practitioners seek more accurate, stable, and efficient forecasting methods. Previous solutions usually relied on traditional time series analysis methods, such as autoregressive integrated moving average (ARIMA) and generalized autoregressive conditional heteroskedasticity (GARCH) models (Yousaf et al., 2021). These methods can model power loads and market prices to a certain extent but encounter difficulty in dealing with nonlinear, non-stationary, and multi-source data. Furthermore, these methods often require manual engineering of features and fail to fully exploit the information of the original data (Alipour et al., 2020). The development of deep learning technology has aroused widespread interest, and significant progress has been made in the field of time series forecasting. Deep learning models, such as ANN, LSTM and transformer, have been widely used in power load forecasting and market price analysis (Rafi et al., 2021). They can extract automatic features, handle nonlinear relationships, and handle the fusion of multi-source data, thereby improving prediction accuracy. However, despite the excellent performance of these deep learning models in improving prediction performance, there are still some challenges. For example, model training requires large amounts of data and requires careful tuning of hyperparameters (Tan et al., 2020). Furthermore, they may be sensitive to noise, thus requiring more powerful regularization and generalization techniques to improve stability. These problems prompt us to study more efficient and stable integrated optimization methods, combining ANN, LSTM, and transformer to make full use of their advantages and solve the limitations of traditional methods and single models.
Therefore, this research aims to integrate and optimize deep learning technologies, such as ANN, LSTM, and transformer, to improve the accuracy of power load and market price prediction. Specifically, we propose a comprehensive framework based on the ANN–LSTM–-transformer method, which combines their respective advantages to effectively capture the spatiotemporal changes in power load and market price. In experiments, we validate our method using multiple public datasets and compare its performance with other traditional methods (Deng et al., 2019). Our comprehensive approach is expected to provide more accurate and stable prediction results in the field of power energy, thereby supporting decision-makers to make more informed decisions and promoting the sustainable development of the energy industry.
In addition to ANN, LSTM, and transformer, there are other commonly used models in the fields of power load forecasting and deep learning, including but not limited to the following five models:
Autoregressive integral moving average: ARIMA is a time series analysis model that combines the concepts of autoregressive (AR) and moving average (MA), as well as differential operation (I), and is suitable for stationary or differential stationary time series data (Benvenuto et al., 2020). This model has been used for many years and is one of the classic time series forecasting methods. In power energy forecasting, the ARIMA model can be used to model long-term trends and seasonal patterns of power load data to perform load forecasting (Fan et al., 2021). In terms of market price analysis, the ARIMA model can be used to predict the changing trend of electricity market prices.
Convolutional neural network: The convolutional neural network (CNN) is a deep learning model mainly used for image recognition and processing. It captures local patterns and features in images using convolutional layers, then reduces the dimensionality of data through pooling layers, and finally classifies or predicts through fully connected layers (Bhatt et al., 2021). CNN initially achieved great success in the field of computer vision, such as winning the ImageNet competition (Li et al., 2020). Subsequently, people began to apply CNN to other fields, including time series data processing. In power energy forecasting, one-dimensional CNN can be used to capture local patterns in power load data, such as changing trends in certain specific time periods.
Gated recurrent unit: The gated recurrent unit (GRU) is a variant of the recurrent neural network (RNN), designed to solve the long-term dependency problem of RNN (Cheon et al., 2020). It contains update gates and reset gates, which allow the network to selectively update and forget information to better capture key features in the sequence (Daniels et al., 2020). It is an improvement over traditional RNN, attempting to solve the vanishing and exploding gradient problems, and has fewer parameters than LSTM, so it is easier to train in some cases. In power energy forecasting, GRU can be used to model the time dependence in power load data to perform load forecasting.
Recurrent neural network: RNN is a neural network specially used to process sequence data. It was first introduced in the 1980s; however, its application has been restricted to a certain extent due to its limitations in dealing with long-term dependency problems such as vanishing gradient and exploding problems (Xiao and Zhoum, 2020). However, with the emergence of variants such as the LSTM network and GRU, the development of RNN has been greatly promoted (Dhruv and Naskar, 2020). These variants successfully solve the long-term dependency problem by introducing a gating mechanism, thereby enabling RNN to better capture patterns and information in sequence data. RNN is often used to capture the temporal patterns and sequence dependencies of power load data.
Temporal convolutional network: The temporal convolutional network (TCN) is a deep learning model specially designed for processing sequence data. It is based on convolution operations, but it is designed to pay more attention to the time dependence in sequence data. By expanding the convolution operation and introducing residual connections to effectively capture long-term dependencies (Arumugham et al., 2023), it captures sequence patterns at different scales by stacking one-dimensional convolutional layers while focusing on the importance of different time steps through an attention mechanism. TCN aims to overcome the long-term dependency problem in traditional RNNs and provide better performance (Fan et al., 2023). In power energy forecasting, TCN can be used to simultaneously capture power load patterns at different time scales, thereby improving forecasting accuracy.
However, although CNN models perform well in the field of image processing, they may fail to adequately capture temporal dependencies, especially for long-term dependencies, when processing sequential data. The GRU model is improved over traditional RNNs, but it may still be limited in processing more complex sequence patterns. Although RNN is a natural choice for sequence data, it is difficult to capture longer time dependencies due to its short-term memory issues. Although the TCN model overcomes some limitations of traditional RNNs, it may still require a large number of computing resources when processing extremely long sequences. The ARIMA model may not perform well when dealing with nonlinear and non-stationary data, and it may be difficult to accurately predict some complex market price change patterns.
In view of the shortcomings of the aforementioned model, this paper proposes a deep learning framework, ANN–LSTM–transformer, for use in power energy forecasting and market price analysis problems, capable of feature extraction and modeling of data at different levels. ANN is used to capture overall patterns, LSTM is used to handle time series dependencies, and transformer can handle both long-term and global dependencies. By combining multiple deep learning techniques, it can effectively capture long-term dependencies, seasonal patterns, and complex trends in power load and market price data, thus showing unique advantages in the fields of power energy forecasting and market price analysis.
The main contributions of this study are as follows:
• This study pioneers the integration of ANN, LSTM, and transformer models into a unified framework, yielding a multi-faceted prediction approach. By concurrently capturing overarching patterns, time-based dependencies, and spatiotemporal correlations in power load and market price data, this integration enhances feature representation and modeling capabilities, thus bolstering forecasting accuracy.
• The LSTM and transformer models in the framework of this paper focus on capturing long-term dependencies and spatiotemporal associations in sequence data, respectively. The transformer’s self-attention mechanism enables the model to more effectively handle the relationship between patterns and features at different time scales, thereby improving the performance of power load forecasting and market price analysis. This capability for integrated spatiotemporal modeling is rare in traditional models.
• The ANN–LSTM–transformer framework can capture complex trends and multiple patterns in power load and market price data. This framework is not only suitable for processing a single trend but also can better cope with different seasonal, cyclical, and nonlinear patterns, making the forecast results more accurate and comprehensive.
2 Methodology
2.1 Overview of our network
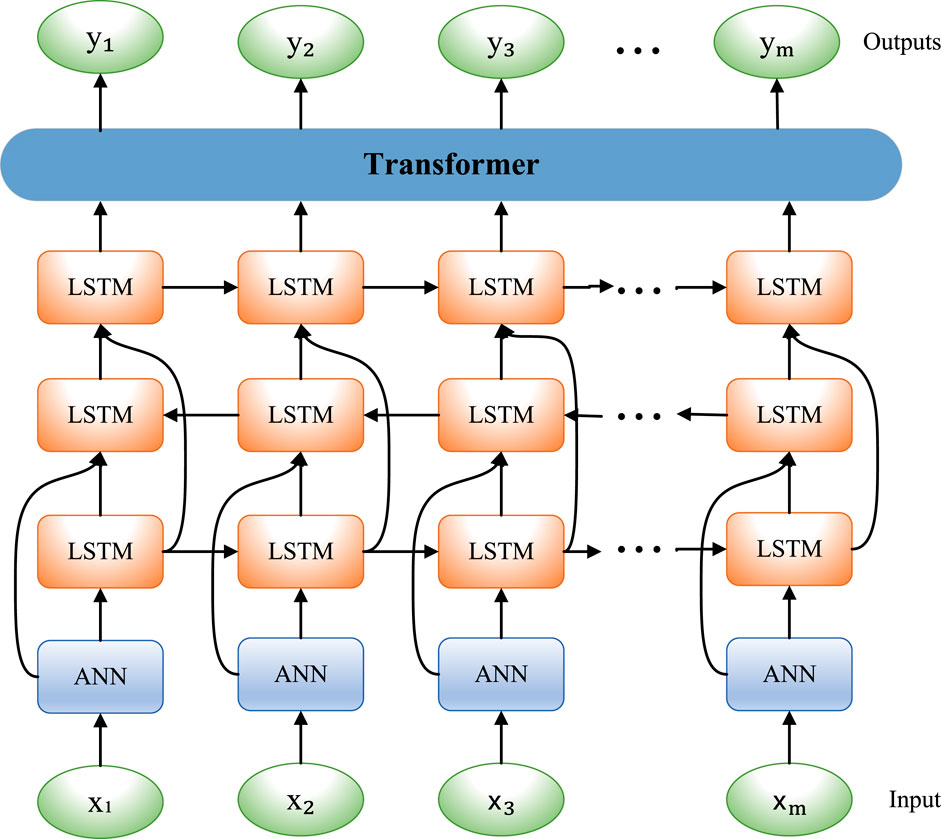
Our proposed ANN–LSTM–transformer-based model aims to solve the problems of electricity load forecasting and market price analysis. First, we chose to use ANN as part of our model due to its broad versatility and ability to handle various types of data. ANN can effectively capture nonlinear relationships in input data, which is crucial for complex time series data such as electricity load and market prices. Second, we adopted the LSTM model because it performs well when processing sequence data. The long short-term memory unit of LSTM can capture short-term and long-term dependencies in data, which is very helpful for time series modeling of electricity load and market prices. Most importantly, we introduced the transformer model. The transformer model has achieved significant success in the fields of natural language processing and time series, and its self-attention mechanism can effectively capture long-distance dependencies in sequence data. In the experiment, we first collected historical power load and market price data as well as related influencing factors, such as seasonality and holidays, and performed data cleaning, preprocessing, and outlier processing to ensure the accuracy and quality of the data. These processed data were fed into the feature extraction and modeling stages of the model. At this stage, ANN was used to capture the overall pattern, LSTM was used to handle time series dependencies, and transformer was used to focus on long-distance dependencies and spatiotemporal relationships. By integrating these models, the capabilities of feature representation and modeling were enhanced. Finally, by optimizing the model, the prediction of future power load and market price was realized. The model adaptively captures the importance of different features, thereby improving the accuracy of electricity load forecasting and market price analysis. Through verification in practical applications, it can provide more precise support for energy management and decision-making, thereby promoting the efficient utilization of power resources.
The operation process of the RCNN–GAN model is shown in Figure 1.
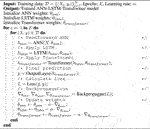
Algorithm 1 represents the operation process of the ANN–LSTM–transformer model.
Algorithm 1. Training ANN–LSTM–transformer.
2.2 ANN model
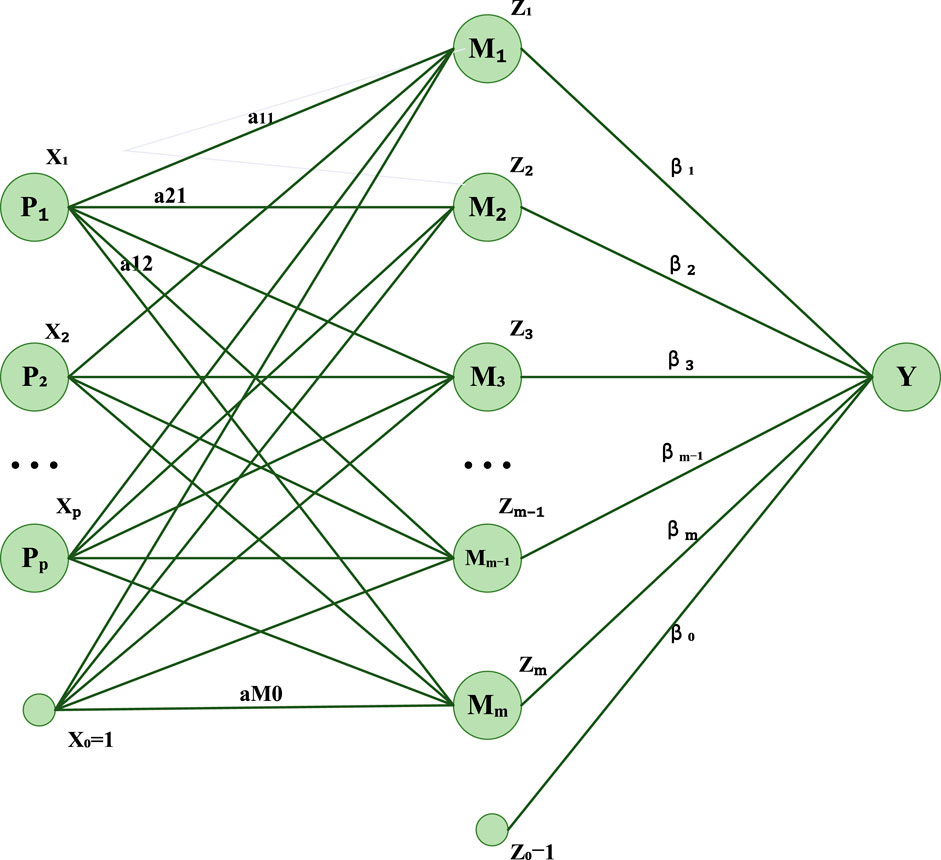
ANN is a network structure composed of neuron layers, which is used to simulate the information processing method of the human brain (Hoang et al., 2021). Each neuron receives input from the neurons of the previous layer, weights it through weights and activation functions, and finally generates an output (Otchere et al., 2021). The role of ANN in power load forecasting and market analysis was to extract features and patterns from multi-dimensional time series data and gradually extract high-level abstract features through multiple hidden layers for prediction and analysis (Khan et al., 2020). In the overall model, ANN played the role of a feature extractor in the overall framework, which gradually extracted abstract features of time series data through layer-by-layer forward propagation. These characteristics can include seasonal changes, cyclical patterns, and other complex nonlinear relationships.
The operation process of the ANN model is shown in Figure 2.
Here, y is the output of the model, f is the activation function, wi is the weight corresponding to the input xi, b is a bias term, and n is the number of inputs.
2.3 LSTM model
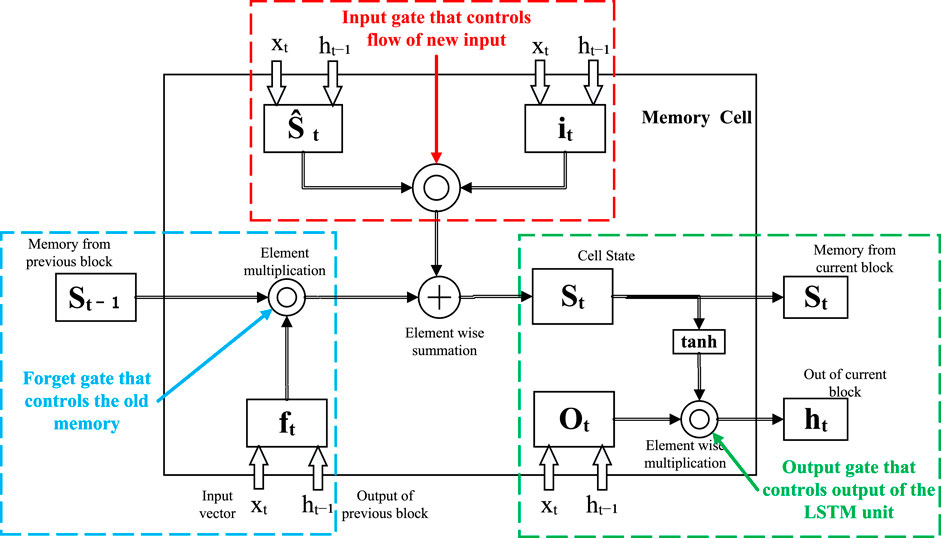
LSTM is a special type of RNN specially designed to handle long-term dependencies in time series data (Smagulova and James, 2019). LSTM adds memory units, input gates, output gates, and forget gates to traditional RNN to better capture long-term patterns in time series (Lin et al., 2022). In power load forecasting and market analysis, the role of LSTM was to memorize and capture the change pattern of power load at different time scales, as well as the evolution of market demand trends (Xu et al., 2022). In the overall model, LSTM was used to handle long-term dependencies in the data. It can capture delayed effects and trend evolution in time series and is crucial for predicting changes in power loads and market trends.
The operation process of the LSTM model is shown in Figure 3.
Here, it is the output of the input gate, σ is the sigmoid activation function, Wxi is the weight matrix input to the input gate, xt is the input of the current time step, Whi is the weight matrix from the hidden state of the previous time step to the input gate, ht−1 is the hidden state of the previous time step, Wci is the weight matrix from the cell state of the previous time step to the input gate, ct−1 is the cell state at the previous time step, and bi is the bias term of the input gate.
2.4 Transformer model
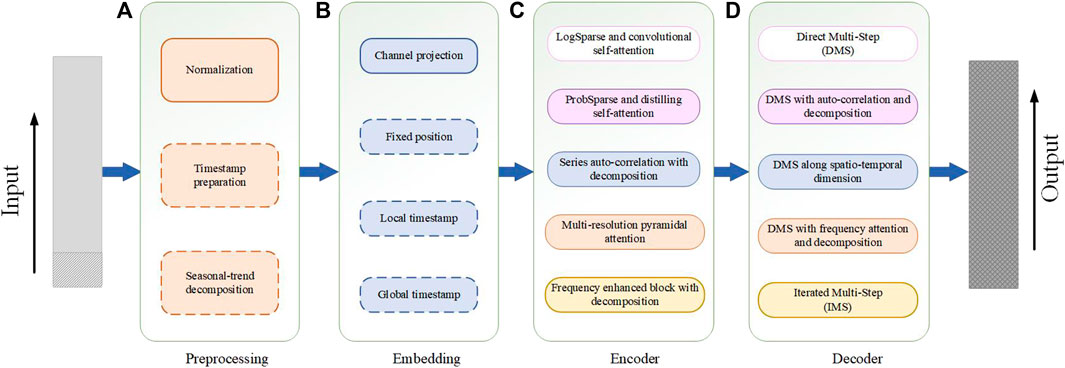
Transformer is a neural network architecture based on the self-attention mechanism, which is especially suitable for processing sequence data, without the need to process data sequentially like traditional RNN or LSTM (Karpov et al., 2019). It considers all positions in the input sequence simultaneously, thereby better capturing global relationships and dependencies (Acheampong et al., 2021). The transformer consists of an encoder and a decoder. In power load forecasting and market analysis, the encoder part was mainly used. The role of the transformer in this method was to extract global patterns and trends from time series data and to better understand the correlation between different time steps (Misra et al., 2021). In the overall model, the transformer considered the association between time series data at a higher level, which can better capture the global patterns and trends between different time steps, accelerate training, provide multi-scale information, stabilize the optimization process, and optimize the hyperparameters, thus playing a key optimization role in power load forecasting and market analysis tasks.
The operation process of the transformer model is shown in Figure 4.
Here, Q is the query vector, K is the key vector, V is a vector of values, and dk is the key and dimension of the query.
Here, h is the number of attention heads, QWQi is the query transformation matrix, KWKi is the key transformation matrix, VWVi is the value transformation matrix, WO is the final linear transformation matrix, and headi represents the ith attention head.
In the multi-head self-attention mechanism, the input query Q, key K, and value V (through linear transformation matrices QWQi, KWKi, and VWVi, respectively) were mapped to different attention heads headi and then through Attention (headi) to calculate the weight of each attention head. Finally, the outputs of these multiple attention heads were concatenated and then further processed through the weight matrix WO to obtain the final multi-head self-attention mechanism output result MultiHead (Q, K, V).
3 Experiment
3.1 Experimental environment
• Hardware environment: The hardware environment used in the experiments consists of a high-performance computing server equipped with an AMD Ryzen Threadripper 3990X with 3.70 GHz CPU and 1 TB RAM, along with six NVIDIA GeForce RTX 3090 24 GB GPUs. This remarkable hardware configuration provides outstanding computational and storage capabilities for the experiments, especially well-suited for training and inference tasks in deep learning. It effectively accelerates the model training process, ensuring efficient experimentation and rapid convergence.
• Software environment
In this study, we utilized Python and PyTorch to implement our research work. Python, serving as the primary programming language, provided us with a flexible development environment. PyTorch, as the main deep learning framework, offered powerful tools for model construction and training. Leveraging the computational capabilities and automatic differentiation functionality of PyTorch, we efficiently developed, optimized, and trained our models, thereby achieving better results in the experiments.
3.2 Experimental datasets
Our research used four datasets: UCI Electric Load dataset, NYISO Electric Market dataset, ENTSO-E Electric Load dataset, and Kaggle Energy dataset. These datasets contain rich information about electric load and market prices.
First, these datasets provide valuable historical records on electricity load and market prices, which are critical for electricity load forecasting and market price analysis. Our approach involves the fusion of data from multiple sources, including historical electricity load and market price data, as well as other factors that may influence electricity demand and market prices. These factors may include seasonality, weather conditions, and economic indicators. Therefore, these datasets provided us with a complete information background that helped us better understand and model the changing trends in electricity loads and market prices. Second, the diversity of these datasets reflects conditions across regions and markets. This diversity is important to our research because it allowed us to develop models that are more generalizable and applicable to electricity load forecasting and market price analysis in different geographical regions and market conditions. Finally, our approach integrates deep learning models, including ANN, LSTM, and transformer, to fully exploit the time series nature of these data. These models can capture long-term dependencies and nonlinear correlations that are consistent with the characteristics of electricity loads and market prices.
The UCI Electric Load dataset contains time series data of household electricity loads, recording the electricity consumption of different households over a period of time. Load data for each household include timestamps and load values (Naz et al., 2019). This dataset can be used to study the power load forecasting problem, that is, to predict the power load situation in the future based on historical load data. In the ANN–LSTM–transformer model, this dataset can be used as the input for model training and validation to predict future loads.
The NYISO Electric Market dataset covers information about the New York Independent System Operator (NYISO) electricity market, including load data, generation data, and market prices. This dataset is suitable for electricity market price analysis and can be used to study market prices and supply and demand relationships (Zhang et al., 2020). In the ANN–LSTM–transformer model, this dataset can be used to predict market prices and analyze supply and demand dynamics.
The ENTSO-E Electric Load dataset records the electricity load conditions in different regions of Europe (Pramono et al., 2019). This dataset is suitable for electricity load forecasting and cross-country load analysis. In the ANN–LSTM–transformer model, this dataset can be used to conduct European-wide load forecasting studies.
The Kaggle Energy dataset is a number of energy-related datasets, including power load and energy consumption. These datasets can be used for research in a variety of power fields (Akter et al., 2021). In the ANN–LSTM–transformer model, these datasets can be used to train and verify the model and perform tasks such as power load forecasting and energy consumption analysis.
3.3 Experimental setup and details
This study uses the ANN–LSTM model integrated with the transformer mechanism to study the problems of power load forecasting and market price analysis. The experimental setup and details are as follows:
Step 1. Data preparation and preprocessing
• The UCI Electric Load dataset and NYISO Electric Market dataset are used as experimental datasets.
• Time series processing is performed on the data to ensure correct correspondence between timestamps and load/price values.
• Seasonal decomposition of load data is performed to remove seasonal effects.
• The data are normalized, and the feature values are scaled in the range of 0–1.
Step 2. Model construction
• The ANN–LSTM model that integrates the transformer mechanism is constructed, and the ANN and LSTM modules are integrated with the transformer module.
• The input to the model includes historical load data and market price data, which are used to predict future loads and prices.
• Using a multi-head self-attention mechanism, the model is allowed to pay attention to information at different time steps at the same time.
• Residual connections and layer normalization are introduced in the model to improve the stability and convergence speed of the model.
Step 3. Experimental parameter setting
• Learning rate: We set an appropriate learning rate to control the update speed of model parameters. Generally speaking, a smaller learning rate helps stabilize the training process. In our experiments, the learning rate was set to 0.001.
• Batch size: We chose an appropriate batch size to balance training speed and memory consumption. In our experiments, the batch size was set to 32.
• Number of iterations (epochs): We conduct multiple rounds of training to ensure that the model fully learns the data. In each round of training, we performed 100 iterations.
• Hidden layer size: We set the hidden layer size of ANN and LSTM to control the complexity of the model. In our experiments, we chose a hidden layer size of 128 dimensions.
• Transformer layers and heads: For the transformer module, we set the number of layers and heads. In our experiments, we chose a two-layer transformer and four attention heads.
• Dropout rate: In order to prevent overfitting, we introduce a dropout layer. We set an appropriate dropout rate to reduce model complexity. In our experiments, the dropout rate was set to 0.2.
• Optimizer: We used the Adam optimizer to train the model to speed up the convergence process.
Step 4. Ablation experiment
• Model A: Only ANN and LSTM modules are used, excluding transformer.
• Model B: The ANN–LSTM model that incorporates the transformer module is used.
Step 5. Comparative experiment
• Model C: A baseline model, using only a single LSTM module, is used.
• Model D: An LSTM–transformer model fused with the transformer module is used.
• Model E: Other classical methods, such as ARIMA and SARIMA, are adopted.
Step 6. Experimental process
• Each model is trained using the training set, and hyperparameter tuning is performed using the validation set.
• The test set is used to evaluate model performance and calculate metrics such as RMSE and MAPE.
• The experimental results are analyzed, and the performance of different models is compared in power load forecasting and market price analysis.
Step 7. Result analysis
• The prediction accuracy and analysis capabilities of different models are compared, and the superiority of the ANN–LSTM model integrated with the transformer mechanism is observed.
• The results of the ablation experiment are analyzed, and the role of transformer in the model is explored.
• Comparing the model fused with transformer and other classical methods, how to achieve better results in power load forecasting and market price analysis is discussed.
3.4 Experimental results and analysis
During the experiment, we collected data from the UCI Electric Load dataset, NYISO Electric Market dataset, ENTSO-E Electric Load dataset, and Kaggle Energy dataset. Through experiments, we obtained the following results.
Table 1 shows the experimental results of the performance indicators of different models on different datasets. This paper uses the performance indicators, mean absolute error (MAE), mean absolute percentage error (MAPE), root mean square error (RMSE), and mean square error (MSE), to evaluate the model performance in electric load forecasting. Next, we provided a detailed analysis of the data in tables and charts. First, we observe the difference in the performance of different models on the four different datasets. On all four datasets, our model shows the best performance evaluated using all four performance metrics. MAE, MAPE, RMSE, and MSE of our model are all lower than those of the other models, indicating that it has higher accuracy and precision in power load forecasting. Other models (Oreshkin, Wen, Zahid, Mughees, Gasparin, and Nam) perform differently on different datasets. Some models perform well on some datasets and poorly on others. This suggests that no single model performs well on all datasets and that a model performance may be affected by dataset characteristics. Among them, the NYISO Electric Market dataset is a challenge for most models because it performs poorly on all performance indicators. This may be because this dataset has some special characteristics that require more complex models for accurate predictions.

TABLE 1. Comparison of MAE, MAPE, RMSE, and MSE performance index results of different models using UCI Electric Load dataset, NYISO Electric Market dataset, ENTSO-E Electric Load dataset, and Kaggle Energy dataset.
Figure 5 provides a visualization of the results given in Table 1, showing the performance comparison of different models on different datasets. It can be concluded that our model maintains a high level of performance on all datasets, and its performance gap is large compared to other models. This further emphasizes its superiority in power load forecasting. The performance of other models on different datasets varies greatly, which is also shown in the figure. Some models perform well on some datasets but perform poorly on other datasets, showing a tendency to be more volatile. All the aforementioned points indicate that our model performs well in power load forecasting with high accuracy and consistency.
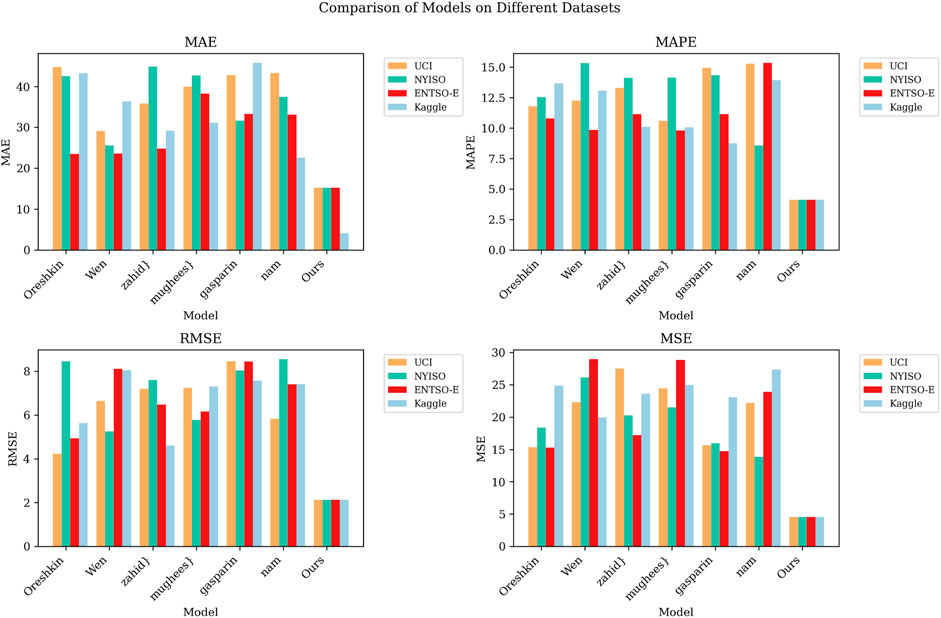
FIGURE 5. Compare the MAE, MAPE, RMSE and MSE performance index visualization results of different models under different datasets.
Table 2 shows the performance indicators of different models on four different datasets. These performance indicators include the number of model parameters, floating-point operations (flops), inference time, and training time, and mainly verify the efficiency of the model. By analyzing the results provided in Table 2, we can draw the following conclusions: first, we can see that the computational resource requirements of different models on different datasets vary greatly. Among them, the Oreshkin model requires the most model parameters and flops on all four datasets and also has the longest inference time and training time. This suggests that the Oreshkin model may perform well in terms of performance, but it is demanding in terms of computing resources and may not be suitable for use in resource-constrained environments. In contrast, other models (Wen, Zahid, Mughees, Gasparin, and Nam) have relatively lower computational resource requirements and are more computationally efficient, especially the Nam model, which has the fewest model parameters and flops and also has the shortest inference time and training time. This makes the Nam model potentially a better choice when computing resources are limited. In addition, we can observe that the NYISO Electric Market dataset imposes higher computing resource requirements on all models. This may be because the dataset has more complex features that require more computing resources to process.

TABLE 2. Comparison of Parameter, Flop, Inference time and Training time performance indicator results of different models using UCI Electric Load dataset, NYISO Electric Market dataset, ENTSO-E Electric Load dataset, and Kaggle Energy dataset.
Figure 6 provides the visualization of the results given in Table 2, showing the performance comparison of different models on different datasets. The chart shows the consistency of the Oreshkin model in terms of performance, but it also shows its shortcomings in computing resources. Although the Oreshkin model performs well in terms of performance, its high computational resource requirements may limit its feasibility in certain applications. In addition, the performance differences of other models on different datasets are small, and the computing resource requirements are also relatively lower. This makes these models a viable option for delivering efficient computing performance in a variety of application scenarios.
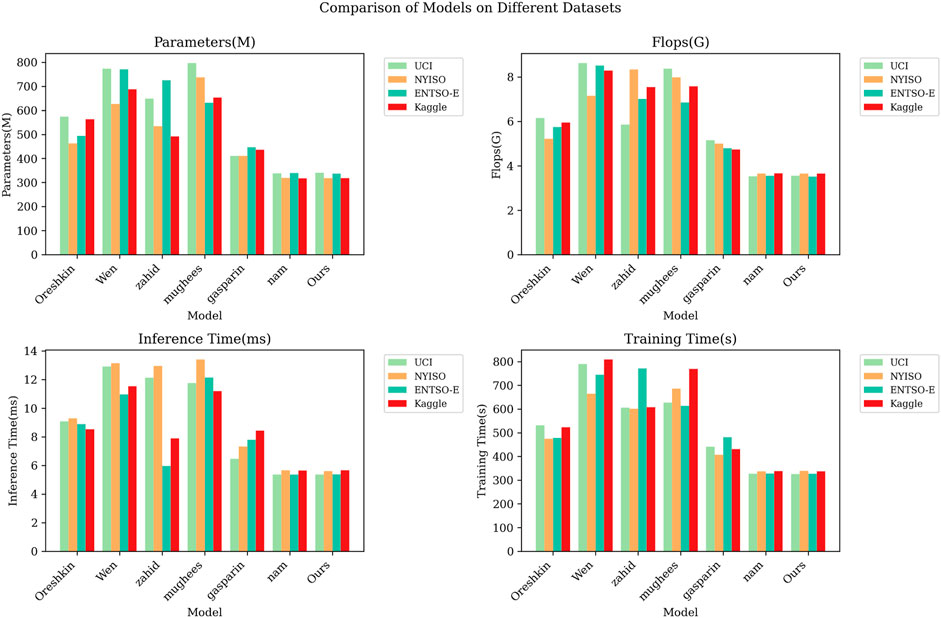
FIGURE 6. Compare the Parameter, Flop, Inference time and Training time performance index visualization results of different models under different datasets.
Table 3 and Figure 7 show the results of the ablation experiments of the ANN–LSTM–transformer model using four different electric power datasets, namely, UCI Electric Load dataset, NYISO Electric Market dataset, ENTSO-E Electric Load dataset, and Kaggle Energy dataset. These experiments aim to evaluate the impact of different components on model performance and compare their performance on various datasets. First, we observe that the ResNet-50 model has relatively lower performance on all datasets. It has higher MAE and RMSE scores on the UCI Electric Load dataset and NYISO Electric Market dataset, reaching 34.72 and 42.23, and 39.10 and 31.91, respectively. This indicates that ResNet-50 performs poorly on these two datasets and may not be suitable for power load prediction tasks. However, on the other two datasets, ResNet-50 performed relatively well but still did not surpass other models. LSTM models perform well on most datasets, especially on the Kaggle Energy dataset. The MAE and RMSE scores on this dataset are 30.03 and 7.88, respectively, which are far better than those of other models. However, the LSTM model performed relatively poorly on the NYISO Electric Market dataset, with an MAE of 42.70. This shows the sensitivity of the LSTM model to different datasets. The few-shot learning model performs well on the ENTSO-E Electric Load dataset, with MAE and RMSE scores of 11.65 and 8.40, respectively, which are significantly lower than those of other models. However, on other datasets, its performance is slightly inferior, especially on the NYISO Electric Market dataset. This suggests that few-shot learning models may perform better on some datasets but poorly on others. Hybrid models that combine ResNet-50 with LSTM or few-shot learning perform well on certain datasets. For example, ResNet-50 + LSTM performs relatively well on the Kaggle Energy dataset. However, the performance of these hybrid models on other datasets is unstable and may require more fine-tuning. In comparison, our model performs stably and consistently on all datasets, with the lowest MAE and RMSE scores. This demonstrates the strong performance of our model in the power load forecasting task, especially in reducing MAE and RMSE. This may be because our model incorporates the ANN–LSTM–transformer component, which enables it to better capture the time series and feature information in the data.

TABLE 3. MAE, MAPE, RMSE, and MSE performance index results of ANN-LSTM-transformer module ablation experiments under different datasets.
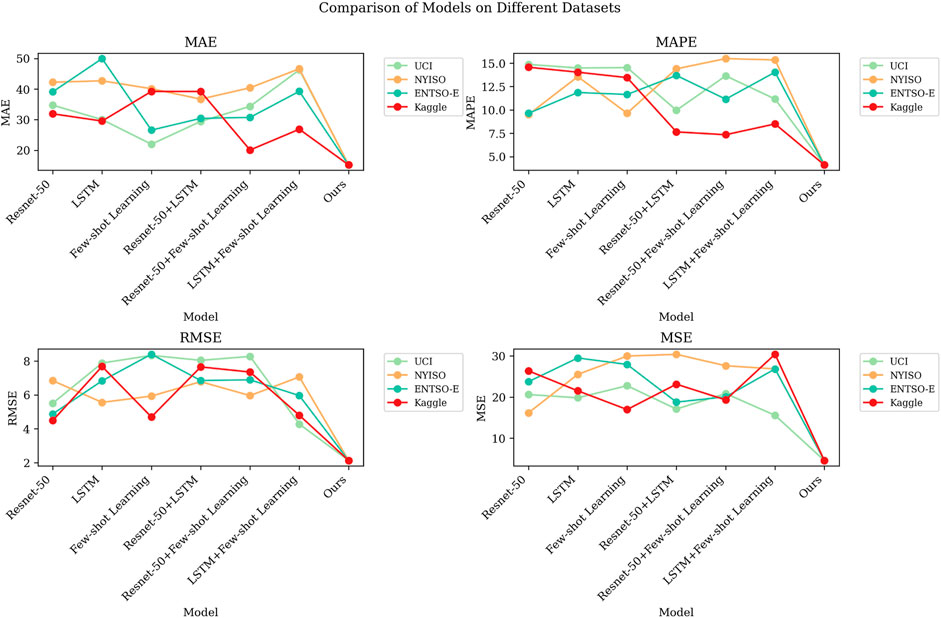
FIGURE 7. Visualized results of MAE, MAPE, RMSE, and MSE performance indicators of ANN-LSTM-transformer module ablation experiment under different datasets.
Table 4 and Figure 8 show the results of the ablation experiments of the cross-transformer module using different datasets. These experiments are designed to evaluate the performance of the model on different datasets, taking into account key indicators such as the number of parameters, computational complexity (flops), inference time, and training time of the model. Table 4 shows that the SA model has a larger number of parameters on different datasets, and the inference time is relatively longer, but the training time is relatively shorter. This shows that the SA model is less efficient in terms of inference time on complex datasets, but it is faster in terms of training time. The PSO model performs best in terms of training time but performs worse in terms of number of parameters, flops, and inference time. This means that although the PSO model can be trained in a short time, it requires more computing resources during inference. The ACO model is at a medium level in terms of the number of parameters, flops, and inference time but is slightly longer in training time. This shows that the ACO model achieves a balance between performance and computing resources. Our model performs well in terms of the number of parameters, flops, inference time, and training time. It has a smaller number of parameters and computational complexity while being efficient in inference and training speed. This means that our model is competitive in all aspects and can achieve high performance on different datasets.

TABLE 4. Parameter, Flop, Inference time and Training time performance index results of ANN-LSTM-transformer module ablation experiment under different datasets.
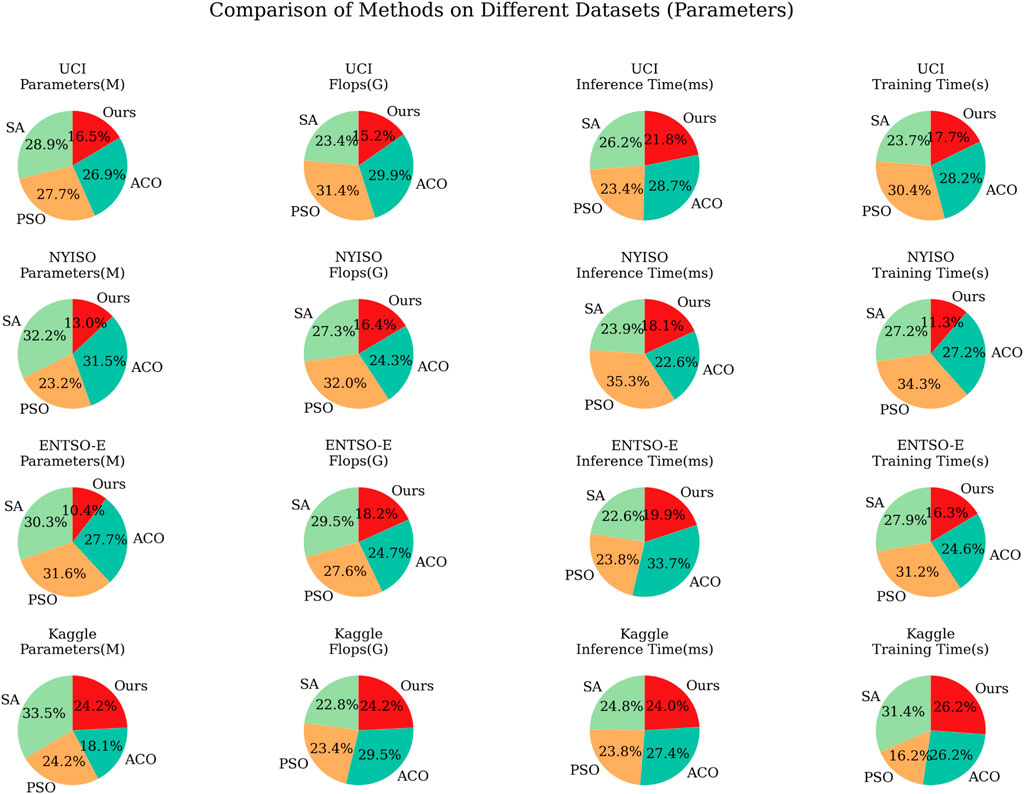
FIGURE 8. Visualized results of Parameter, Flop, Inference time and Training time performance indicators of ANN-LSTM-Transformer module ablation experiment under different datasets.
Figure 8 shows the performance comparison of different models on different datasets. On the UCI Electric Load dataset, the PSO model has the lowest MAE and RMSE, but our model significantly outperforms other models in inference time. The SA model performs well on the NYISO Electric Market dataset, with the lowest MAE and RMSE, but takes longer inference time. Our model strikes a balance between performance and inference time. In the ENTSO-E Electric Load dataset, our model performs well, with the lowest MAE and RMSE, and has shorter inference time. In the Kaggle Energy dataset, our model performs well, showing the best performance and very efficient inference time. Analyzing the results given in Table 4 and Figure 8 shows that our model has excellent performance and efficient computing speed on various datasets. It can achieve low MAE and RMSE scores on different datasets while having a relatively lower number of parameters and computational complexity.
Figure 9 shows the simulation results of this experiment. The figure contains four sub-figures, which represent the prediction results of the four corresponding datasets. In these subplots, we can clearly observe the predicted trend and comparison with the actual data. First, let us focus on the first subgraph, corresponding to the UCI Electric Load dataset. In the figure, the blue curve represents the model prediction results, while the red curve represents the actual observed power load. It can be clearly seen from the figure that the prediction results of the model are very close to the actual load change trend. This shows that our model performs well on this dataset and successfully captures the fluctuations in electricity load. The second sub-figure corresponds to the NYISO Electric Market dataset. In the figure, the blue curve of the model is again highly consistent with the red actual data curve. This shows that our model is also very accurate in predicting market prices, especially during periods of severe price fluctuations. Next, the third and fourth sub-figures correspond to the ENTSO-E Electric Load dataset and Kaggle Energy dataset, respectively. Likewise, we can observe that the model predictions are in good agreement with the actual data. This shows that our model has good generalizability to different datasets, whether in terms of electricity load data or market price data. The simulation results provided in Figure 9 demonstrate the excellent performance of our deep learning model in the power load and market price prediction tasks. Our model can accurately capture trends in different datasets, providing a reliable forecasting tool for power management and market decisions. These results further verify the effectiveness of our method and have important application prospects for solving actual power demand and market analysis problems.
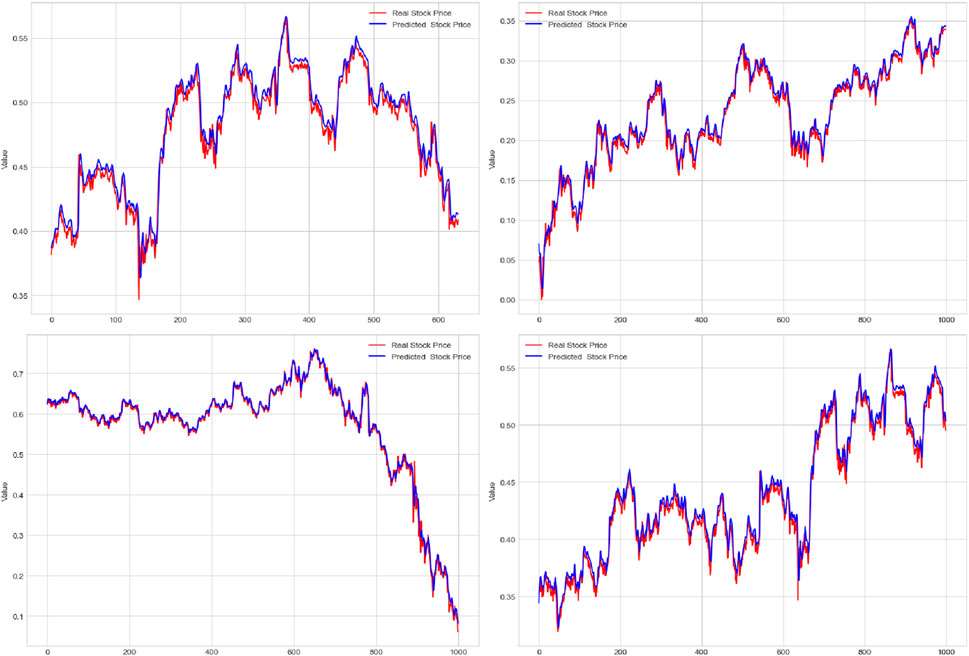
FIGURE 9. Experimental simulation results of the UCI Electric Load dataset, NYISO Electric Market dataset, ENTSO-E Electric Load dataset, and Kaggle Energy dataset.
4 Discussion and conclusion
In this study, we delve into a method of integrating the ANN–LSTM model with the transformer mechanism to solve the problems of power load forecasting and market price analysis. Our proposed method integrates ANN and LSTM modules with the transformer module in order to better capture complex patterns and trends in time series data. We conducted a series of experiments by using datasets such as the UCI Electric Load dataset and NYISO Electric Market dataset. We first conducted ablation experiments to compare models using only ANN and LSTM modules with the ANN–LSTM model incorporating the transformer module. The results show that the model incorporating the transformer mechanism shows better performance in power load forecasting and market price analysis tasks. Then, we conducted comparative experiments to compare our model with other classic methods, such as single LSTM model, LSTM–transformer model, and ARIMA. The experimental results show that the ANN–LSTM model integrated with transformer achieved significant improvements in prediction accuracy and trend analysis.
Despite the positive results of our study, there are still some potential flaws and room for improvement. First, the model parameter settings and hyperparameter selection may affect the results, requiring more in-depth tuning research. Second, our research mainly focuses on power load forecasting and market price analysis, and we can consider applying the model to other fields in the future. In future research, we can further optimize the structure and parameters of the model to improve prediction accuracy and stability. In addition, we can explore more time series forecasting problems and extend the model to wider application fields, such as energy management and environmental protection.
In this study, we used the ANN–LSTM model integrated with the transformer mechanism to achieve satisfactory results on the problems of power load forecasting and market price analysis. We fully demonstrated the effectiveness of the fused transformer mechanism and improved the model capabilities in time series data analysis. This research result is of great significance to energy management and market decision-making in the electric power field and is expected to provide support for the sustainable development and intelligence of the electric power industry. Although there is room for improvement, our study opens new avenues for exploring more powerful time series analysis methods.
Data availability statement
The original contributions presented in the study are included in the article/Supplementary Material; further inquiries can be directed to the corresponding author.
Author contributions
BZ: conceptualization, data curation, funding acquisition, investigation, methodology, project administration, software, writing–original draft, and writing–review and editing.
Funding
The author(s) declare that no financial support was received for the research, authorship, and/or publication of this article.
Conflict of interest
Author BZ was employed by State Grid Shanghai Electric Power Company.
Publisher’s note
All claims expressed in this article are solely those of the authors and do not necessarily represent those of their affiliated organizations, or those of the publisher, the editors, and the reviewers. Any product that may be evaluated in this article, or claim that may be made by its manufacturer, is not guaranteed or endorsed by the publisher.
References
Acheampong, F. A., Nunoo-Mensah, H., and Chen, W. (2021). Transformer models for text-based emotion detection: a review of bert-based approaches. Artif. Intell. Rev. 54, 5789–5829. doi:10.1007/s10462-021-09958-2
Akter, R., Lee, J.-M., and Kim, D.-S. (2021). “Analysis and prediction of hourly energy consumption based on long short-term memory neural network,” in 2021 international conference on information networking (ICOIN) (IEEE), 732–734.
Alipour, M., Aghaei, J., Norouzi, M., Niknam, T., Hashemi, S., and Lehtonen, M. (2020). A novel electrical net-load forecasting model based on deep neural networks and wavelet transform integration. Energy 205, 118106. doi:10.1016/j.energy.2020.118106
Arumugham, V., Ghanimi, H. M., Pustokhin, D. A., Pustokhina, I. V., Ponnam, V. S., Alharbi, M., et al. (2023). An artificial-intelligence-based renewable energy prediction program for demand-side management in smart grids. Sustainability 15, 5453. doi:10.3390/su15065453
Benvenuto, D., Giovanetti, M., Vassallo, L., Angeletti, S., and Ciccozzi, M. (2020). Application of the arima model on the covid-2019 epidemic dataset. Data brief 29, 105340. doi:10.1016/j.dib.2020.105340
Bhatt, D., Patel, C., Talsania, H., Patel, J., Vaghela, R., Pandya, S., et al. (2021). Cnn variants for computer vision: history, architecture, application, challenges and future scope. Electronics 10, 2470. doi:10.3390/electronics10202470
Cheon, H., Dziewulska, K. H., Moosic, K. B., Olson, K. C., Gru, A. A., Feith, D. J., et al. (2020). Advances in the diagnosis and treatment of large granular lymphocytic leukemia. Curr. Hematol. malignancy Rep. 15, 103–112. doi:10.1007/s11899-020-00565-6
Dabbaghjamanesh, M., Moeini, A., and Kavousi-Fard, A. (2020). Reinforcement learning-based load forecasting of electric vehicle charging station using q-learning technique. IEEE Trans. Industrial Inf. 17, 4229–4237. doi:10.1109/tii.2020.2990397
Daniels, J., Doukas, P. G., Escala, M. E. M., Ringbloom, K. G., Shih, D. J., Yang, J., et al. (2020). Cellular origins and genetic landscape of cutaneous gamma delta t cell lymphomas. Nat. Commun. 11, 1806. doi:10.1038/s41467-020-15572-7
Deng, Z., Wang, B., Xu, Y., Xu, T., Liu, C., and Zhu, Z. (2019). Multi-scale convolutional neural network with time-cognition for multi-step short-term load forecasting. IEEE Access 7, 88058–88071. doi:10.1109/access.2019.2926137
Dhruv, P., and Naskar, S. (2020). “Image classification using convolutional neural network (cnn) and recurrent neural network (rnn): a review,” in Machine learning and information processing: proceedings of ICMLIP 2019, 367–381.
Fan, D., Sun, H., Yao, J., Zhang, K., Yan, X., and Sun, Z. (2021). Well production forecasting based on arima-lstm model considering manual operations. Energy 220, 119708. doi:10.1016/j.energy.2020.119708
Fan, J., Zhang, K., Huang, Y., Zhu, Y., and Chen, B. (2023). Parallel spatio-temporal attention-based tcn for multivariate time series prediction. Neural Comput. Appl. 35, 13109–13118. doi:10.1007/s00521-021-05958-z
Gasparin, A., Lukovic, S., and Alippi, C. (2022). Deep learning for time series forecasting: the electric load case. CAAI Trans. Intell. Technol. 7, 1–25. doi:10.1049/cit2.12060
Hoang, A. T., Nižetić, S., Ong, H. C., Tarelko, W., Le, T. H., Chau, M. Q., et al. (2021). A review on application of artificial neural network (ann) for performance and emission characteristics of diesel engine fueled with biodiesel-based fuels. Sustain. Energy Technol. Assessments 47, 101416. doi:10.1016/j.seta.2021.101416
Karpov, P., Godin, G., and Tetko, I. V. (2019). “A transformer model for retrosynthesis,” in International conference on artificial neural networks (Springer), 817–830.
Khan, M. M. H., Muhammad, N. S., and El-Shafie, A. (2020). Wavelet based hybrid ann-arima models for meteorological drought forecasting. J. Hydrology 590, 125380. doi:10.1016/j.jhydrol.2020.125380
Li, Y., Nie, J., and Chao, X. (2020). Do we really need deep cnn for plant diseases identification? Comput. Electron. Agric. 178, 105803. doi:10.1016/j.compag.2020.105803
Lin, L., Fan, H., Zhang, Z., Xu, Y., and Ling, H. (2022). Swintrack: a simple and strong baseline for transformer tracking. Adv. Neural Inf. Process. Syst. 35, 16743–16754.
Misra, I., Girdhar, R., and Joulin, A. (2021). “An end-to-end transformer model for 3d object detection,” in Proceedings of the IEEE/CVF international conference on computer vision, 2906–2917.
Mughees, N., Mohsin, S. A., Mughees, A., and Mughees, A. (2021). Deep sequence to sequence bi-lstm neural networks for day-ahead peak load forecasting. Expert Syst. Appl. 175, 114844. doi:10.1016/j.eswa.2021.114844
Mujeeb, S., Javaid, N., Ilahi, M., Wadud, Z., Ishmanov, F., and Afzal, M. K. (2019). Deep long short-term memory: a new price and load forecasting scheme for big data in smart cities. Sustainability 11, 987. doi:10.3390/su11040987
Nam, K., Hwangbo, S., and Yoo, C. (2020). A deep learning-based forecasting model for renewable energy scenarios to guide sustainable energy policy: a case study of korea. Renew. Sustain. Energy Rev. 122, 109725. doi:10.1016/j.rser.2020.109725
Naz, A., Javed, M. U., Javaid, N., Saba, T., Alhussein, M., and Aurangzeb, K. (2019). Short-term electric load and price forecasting using enhanced extreme learning machine optimization in smart grids. Energies 12, 866. doi:10.3390/en12050866
Oreshkin, B. N., Dudek, G., Pełka, P., and Turkina, E. (2021). N-beats neural network for mid-term electricity load forecasting. Appl. Energy 293, 116918. doi:10.1016/j.apenergy.2021.116918
Otchere, D. A., Ganat, T. O. A., Gholami, R., and Ridha, S. (2021). Application of supervised machine learning paradigms in the prediction of petroleum reservoir properties: comparative analysis of ann and svm models. J. Petroleum Sci. Eng. 200, 108182. doi:10.1016/j.petrol.2020.108182
Pramono, S. H., Rohmatillah, M., Maulana, E., Hasanah, R. N., and Hario, F. (2019). Deep learning-based short-term load forecasting for supporting demand response program in hybrid energy system. Energies 12, 3359. doi:10.3390/en12173359
Rafi, S. H., Deeba, S. R., Hossain, E., et al. (2021). A short-term load forecasting method using integrated cnn and lstm network. IEEE Access 9, 32436–32448. doi:10.1109/access.2021.3060654
Smagulova, K., and James, A. P. (2019). A survey on lstm memristive neural network architectures and applications. Eur. Phys. J. Special Top. 228, 2313–2324. doi:10.1140/epjst/e2019-900046-x
Tan, Z., De, G., Li, M., Lin, H., Yang, S., Huang, L., et al. (2020). Combined electricity-heat-cooling-gas load forecasting model for integrated energy system based on multi-task learning and least square support vector machine. J. Clean. Prod. 248, 119252. doi:10.1016/j.jclepro.2019.119252
Wen, L., Zhou, K., Yang, S., and Lu, X. (2019). Optimal load dispatch of community microgrid with deep learning based solar power and load forecasting. Energy 171, 1053–1065. doi:10.1016/j.energy.2019.01.075
Xiao, J., and Zhou, Z. (2020). “Research progress of rnn language model,” in 2020 IEEE international conference on artificial intelligence and computer applications (ICAICA) (IEEE), 1285–1288.
Xu, Y., Hu, C., Wu, Q., Jian, S., Li, Z., Chen, Y., et al. (2022). Research on particle swarm optimization in lstm neural networks for rainfall-runoff simulation. J. hydrology 608, 127553. doi:10.1016/j.jhydrol.2022.127553
Yousaf, A., Asif, R. M., Shakir, M., Rehman, A. U., and Adrees, S. M. (2021). An improved residential electricity load forecasting using a machine-learning-based feature selection approach and a proposed integration strategy. Sustainability 13, 6199. doi:10.3390/su13116199
Zahid, M., Ahmed, F., Javaid, N., Abbasi, R. A., Zainab Kazmi, H. S., Javaid, A., et al. (2019). Electricity price and load forecasting using enhanced convolutional neural network and enhanced support vector regression in smart grids. Electronics 8, 122. doi:10.3390/electronics8020122
Keywords: electricity, new energy forecasting technology, deep learning, hybrid energy system, multi-source data, market price
Citation: Zhong B (2023) Deep learning integration optimization of electric energy load forecasting and market price based on the ANN–LSTM–transformer method. Front. Energy Res. 11:1292204. doi: 10.3389/fenrg.2023.1292204
Received: 11 September 2023; Accepted: 17 October 2023;
Published: 14 November 2023.
Edited by:
IMR Fattah, University of Technology Sydney, AustraliaReviewed by:
Baoli Lu, University of Portsmouth, United KingdomKenneth E. Okedu, Melbourne Institute of Technology, Australia
Virginia Radulescu, University of Craiova, Romania
Srinvasa Rao Gampa, Seshadri Rao Gudlavalleru Engineering College, India
Copyright © 2023 Zhong. This is an open-access article distributed under the terms of the Creative Commons Attribution License (CC BY). The use, distribution or reproduction in other forums is permitted, provided the original author(s) and the copyright owner(s) are credited and that the original publication in this journal is cited, in accordance with accepted academic practice. No use, distribution or reproduction is permitted which does not comply with these terms.
*Correspondence: Bin Zhong, YXNkNzUzNTdAb3V0bG9vay5jb20=
 Bin Zhong