 S. M. Mahfuz Alam
 Mohd. Hasan Ali
- 1Department of EEE, Dhaka University of Engineering and Technology, Gazipur, Bangladesh
- 2Department of ECE, The University of Memphis, Memphis, TN, United States
The most important feature of load forecasting is enabling the building management system to control and manage its loads with available resources ahead of time. The electricity usage in residential buildings has increased during the COVID-19 period, as compared to normal times. Therefore, the performance of forecasting methods is impacted, and further tuning of parameters is required to cope with energy consumption changes due to COVID-19. This paper proposes a new adaptive neuro-fuzzy 2 inference system (ANFIS2) for energy usage forecasting in residential buildings for both normal and COVID-19 periods. The particle swarm optimization (PSO) method has been implemented for parameter optimization, and subtractive clustering is used for data training for the proposed ANFIS2 system. Two modifications in terms of input and parameters of ANFIS2 are made to cope with the change in the consumption pattern and reduce the prediction errors during the COVID-19 period. Simulation results obtained by MATLAB software validate the efficacy of the proposed ANFIS2 in residential load forecasting during both normal and COVID-19 periods. Moreover, the performance of the proposed method is better than that of the existing adaptive neuro-fuzzy inference system (ANFIS), long short-term memory (LSTM), and random forest (RF) approaches.
1 Introduction
The amount of energy consumption in residential buildings creates a huge burden on the energy-providing utilities. This problem becomes severe during the peak hours of the day when the utility might have to look for alternative resources of energy. In addition, consumers have to pay a high electricity price during the peak hours. However, load forecasting can help overcome this problem from both the grid side and the consumer’s perspective. From the grid perspective, based on the knowledge of energy demands, alternative resources of energy can be allocated ahead of time (Kapoor and Sharma, 2018; Almalaq and Edwards, 2019). Moreover, from the consumer’s point of view, the loads can be scheduled based on the price of energy from the grid, available resources in the buildings, and energy storage. In addition, it creates an opportunity for the consumers to sell some of their residential energy to the grid, if possible, during peak hours. Therefore, researchers have been continuously searching for efficient load forecasting methods.
Among the various methods of load forecasting, time series or regression-based predictions are frequently found in the literature. The autoregressive integrated moving average (ARIMA) model has attracted scholars for predictions (Kim et al., 2019; Rana et al., 2022). ARIMA is the improved combination of the auto-regressive (AR) and moving average (MA) methods. However, without a large dataset and in changing load conditions, the performance of the ARIMA model deteriorates. Moreover, regression trees are also proposed as a forecasting method by many authors (Phyo and Jeenanunta, 2021; Sun and Bi, 2021). It is a machine learning tool that sub-divides the total data space into smaller clusters of data and divides the sub-division into small divisions whenever an interaction can be managed. Regression trees proceed with decisions in the form of a tree that starts from the root to the leaf node, where the leaf node gives the output. Random forest (RF) is the most popular homogeneous regression tree method found in the literature (Moon et al., 2018; Wang et al., 2018; Yiling and Shaofeng, 2020) that provides the decision without having any bias among the decision trees. The multiple linear regression method is also recommended by some researchers (Chowdhury et al., 2018; Oprea and Bâra, 2019). In this method, the dependent variable is expressed as a sum of non-dependent variables. Furthermore, Zheng et al. (2019) and Sharma et al. (2020) have investigated predictor systems that utilize state space models, such as the Kalman filter. However, the performance of the Kalman filter deteriorates as the non-linearity of the system increases.
The common problem associated with these above-mentioned methods is the degradation of performance with the increase in nonlinearity in the system. The nonlinear nature of residential load has enforced researchers (Wang and Srinivasan, 2017; Nair et al., 2018) to search for more robust prediction systems that can predict well when the system is highly nonlinear. The fuzzy logic system, which performs on the IF–THEN logic, has been reported in the literature (Alrizq and Doncker, 2018; Alam and Ali, 2020a) to have performed well in nonlinear conditions. Moreover, temperature and historical data are the most considered inputs for the fuzzy systems that are proposed in the literature (Anoop and Kanchana, 2017; Shao et al., 2018), although performance can still be improved further by increasing the input number. However, limited input numbers are considered because as the input number increases, the fuzzy rules also increase, which makes the system slower.
Moreover, Shabbir et al. (2019) and Moradzadeh et al. (2022) have preferred the support vector regression (SVR) method for load prediction. Although it can perform well for nonlinear systems, the performance of the SVR system heavily depends on tuning the parameters properly, and a large amount of data are required for training purposes. Long short-term memory (LSTM) is another recommended method (Kong et al., 2019; Wang et al., 2021; Zang et al., 2021) that can predict well the nonlinearity of the system. However, like SVR, for the best prediction, it requires a large number of input features and a huge amount of data for proper tuning of the parameters.
The artificial neural network (ANN) is another method that has been reported (Alonso and Chávez, 2017; Khan et al., 2018; Sulaiman et al., 2019; Banitalebi et al., 2020; Chandran et al., 2021) in the literature to show better performances under the nonlinear condition. In ANN, during training of data, hidden layer parameters such as gains and biases are to be tuned properly. Moreover, the performance of the ANN method highly depends on the conditions such as the availability of a huge amount of previous data or historical data, ensuring a good relationship between the inputs and output and appropriate tuning of the hidden and output layers. However, the adaptive neuro-fuzzy inference system (ANFIS) is reported to show better performance than the ANN system as it combines the beneficial features of both ANN and the fuzzy system (Alam and Ali, 2020b). However, like the fuzzy system, if the number of the input of ANFIS becomes more than three, a sluggish response due to high computational burden makes the system practically nonviable. Moreover, with an increase in the number of membership functions for each input, the computational burden increases further.
These above-mentioned problems can be alleviated by implementing subtractive clustering-based ANFIS. Subtractive clustering is a very efficient way to determine the number of clusters along with their centers when data characteristics are unpredictable. Therefore, a new subtractive clustering-based ANFIS is proposed (Alam and Ali, 2020a) for predicting residential loads. In that work, temperature is considered the first input. Moreover, occupancy and day type are used to formulate an equation to determine R, the second input for ANFIS.
However, the parameters of ANFIS in Alam and Ali (2020b) are tuned only by the hybrid algorithm that is a combination of backpropagation of input membership function parameters and the linear regression method for the output. It is found that converting the type-1 membership function into type-2 membership functions and tuning the parameters of ANFIS by particle swarm optimization (PSO) can improve the performance of ANFIS. Alam and Ali (2020a) proposed an equation-based system that predicts load consumption by dividing input data into different ranges and provides an equation to predict data whose parameters are tuned by the data that fall within that range. Because of this, the proposed equation-based system performs better than ANFIS.
However, this system is not robust for changing situations as the energy consumption pattern has changed dramatically during the COVID-19 situation, as reported in the recent literature. The COVID-19 impact on residential load consumption in Memphis City, United States, was investigated by Alam and Ali (2020b). In this work, the energy consumption in residential buildings during COVID-19 periods is reported to have increased during office hours for normal working days for different types of occupants. The overall per-day energy consumption on working days has also increased. Similar analyses for both short-time and long-time energy consumption were done for 87 regions of Zhejiang province, China (Zhang et al., 2021), where it is reported to have a time shift in electricity consumption in some regions and a permanent change in the energy consumption pattern in the rest of the regions. In Bompard et al. (2020), the impact of COVID-19 on the European electricity market was analyzed. Another work is found in the literature where the authors (Sławomir et al., 2020) investigated the impact of COVID-19 lockdown on energy consumption in Warsaw city in 2020 and found that the residential users who stayed at home during lockdown consumed more energy, with a change in consumption patterns as well. Moreover, pattern changes in load forecasting, demand, generations, and frequency deviations were also analyzed by Aviad et al. (2021). In this work, energy consumption is reported to have changed with load shifts from the industrial and commercial sectors to the private sectors. As new variants of the virus have been emerging, it is difficult to predict how long this situation will continue. The energy consumption pattern will be continuously changing, as compared to that before the COVID-19 period.
Based on the above background, a new subtractive clustering-based ANFIS2 is implemented in this work for residential load forecasting. To the best of our knowledge, this method has never been proposed for load forecasting. The performance of the proposed ANFIS2 has been compared with that of the subtractive clustering-based ANFIS proposed by Alam and Ali (2020a), RF and LSTM methods. The predicted outputs of all systems are simulated in the MATLAB environment first for normal conditions (before COVID-19). The same inputs, as proposed by Alam and Ali (2020a, 2020b), are considered for both ANFIS and ANFIS2 methods. Different prediction errors are computed to analyze the performance of all the methods and tabulated as performance indices.
Moreover, the impact on the performance of the proposed ANFIS2 is investigated for predicting energy consumption during the COVID-19 period due to changes in energy consumption. Moreover, one input of ANFIS2, which is determined by the number of occupants and the day type, is modified to investigate the improvements in predictions. Finally, with inputs and COVID-19 data, the parameters of ANFIS2 are tuned to further improve efficacy in predictions.
To summarize the novelty and contribution, this work does the following:
• First, it proposes a new subtracting clustering-based ANFIS2 for energy consumption prediction during the normal period.
• It investigates the performance of the proposed ANFIS2 in predicting the energy conduction during the COVID-19 pandemic situation as the residential load consumptions drastically changed during this time.
• It proposes two modifications in ANFIS2 that can efficiently predict the energy consumption during the COVID-19 situation.
• It makes a performance comparison between the proposed ANFIS2 and the conventional ANFIS, LSTM, and RF systems during both normal and COVID-19 periods.
The rest of the paper is structured as follows: the problem statement, i.e., the motivation behind the current work, is represented in Section 2. In Section 3, all the methodologies are described. Simulation results are analyzed, and performances of all the methods are provided in Section 4. In Section 5, the paper ends with the conclusion and is followed by references in Section 6.
2 Problem statement
Electrical load forecasting is a crucial element that can be effectively used to provide power to consumers by proper management of energy and keeping the cost of power at a comfortable level for the consumers. Effective forecasting requires well-trained models where the model parameters are tuned based on the parameters (inputs) that contribute to energy consumption (outputs). However, the performance of the conventional models deteriorates if there are changes in the input pattern or the system is not trained with many datasets. Therefore, it is evident that a new model is required for load forecasting that will predict well under normal conditions with limited data for training. Moreover, it should be able to predict well under varying conditions.
As the energy consumption patterns are reported to have changed significantly during the COVID-19 period, a new forecasting method has been explored to solve the problem. The performance of the proposed and existing systems is investigated for the intermittent conditions with the models tuned with data available for normal conditions. Moreover, the modifications of the proposed system that are needed to predict well under varying consumption patterns are also investigated to utilize the proposed model for any future epidemic or emergency conditions.
3 Proposed ANFIS2 prediction method
Figure 1 shows the block diagram of the proposed ANFIS2, in which the type-1 fuzzy system is Sugeno-type, and the considered two inputs are the same as in Alam and Ali (2020a). In the neural part of the ANFIS2 section, both temperature and R data on 568 days are used. The value of R is determined from occupancy and the day type, as described by Alam and Ali (2020a). When training the data, the number of membership functions for both inputs is determined by subtractive clustering, which utilizes a hybrid algorithm.
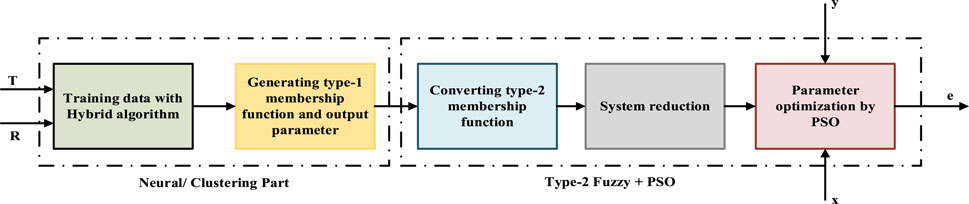
FIGURE 1. ANFIS System.
The number of membership functions, along with tuning of the membership function, is facilitated by backpropagation methods, and the linear regression function is tuned for the output section for predicting data based on the fuzzy rules. Another benefit of subtractive clustering is that the fuzzy rules are always selected based on the clustering number by the algorithm during the training period and are always less than the conventional fuzzy systems. Therefore, ANFIS runs faster compared to the fuzzy systems.
In subtractive clustering, the input space (Yeom and Kwak, 2018) is divided into several clusters by considering the radius of the cluster (range of influence). The values of the range of influence can be from 0 to 1. If the radius (range of influence) is considered to be small, then the number of clusters increases and so do the fuzzy rules. The squash factor is a positive scalar that is utilized for grading the range of influence of the centers of clusters. The accept ratio is a positive number that indicates the fraction of potential of one cluster. Another data point can be considered as the center of the cluster if its fraction of potential value is above the acceptance ratio. Moreover, any point cannot be considered the center of the cluster if its fraction of potential value falls below the rejection ratio value.
In this work, when the above stages are completed, the conventional Sugeno-type fuzzy system is converted into the type-2 fuzzy system, where the input membership functions are different from the conventional input membership function as it has both the upper and lower membership functions with an area between them considered as the footprint of uncertainty (FOU), as shown in Figure 2. For the conventional fuzzy system, the membership function has only the upper membership function, as will be shown later. Moreover, the output membership functions of the type-2 fuzzy system remain the same as in the conventional fuzzy system, which are linear functions considered for this work [38]. The parameters of the upper membership functions of type-2 fuzzy systems remain the same as the corresponding membership functions of conventional fuzzy systems [39].
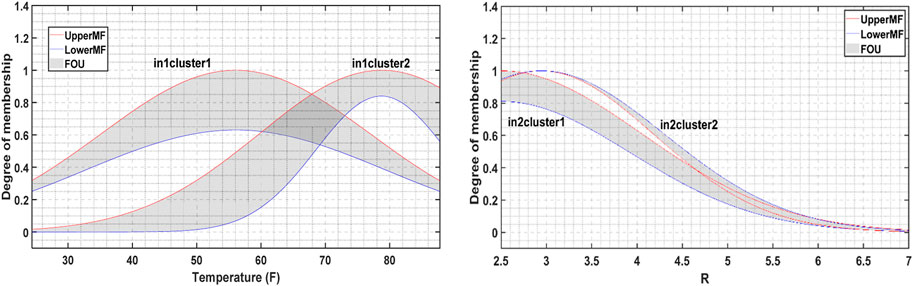
FIGURE 2. Input membership functions for ANFIS2 system.
From Figure 2, it is evident that the type-2 membership function is defined by the upper and lower membership functions that are represented by red and blue lines, respectively. The fuzzification of input values is done by calculating the degree of membership from both the upper and lower membership functions based on the rule antecedent. Then, the range of strength firing rules is obtained by implementing the fuzzy operator to the fuzzified values of the membership functions. In this case, the maximum value of the upper membership function and the minimum value of the lower membership function are considered for the Sugeno-type system. In the aggregation step, the output level of each rule of the type-2 fuzzy system remains the same as in the conventional system; however, in the conventional system, they are done in consequent steps. In addition, in the aggregation step, the rule output levels are arranged in an ascending order, which defines the universe of discourse for the type-2 fuzzy set. The upper and lower membership values for each output level are chosen based on the maximum and minimum firing range values of the corresponding rule. Finally, the type-2 fuzzy set is reduced to type-1 interval fuzzy sets using the reduction method to obtain the clear output for the inference system. The type-1 interval fuzzy set considers a range of values with lower (CL) and upper (CR) limits that are considered centroids and can be approximated by the following equations (40):
where
3.1 Conventional adaptive neuro-fuzzy inference system
As already mentioned, in this work, the efficacy of the proposed ANFIS2 has been verified with the system reported by Alam and Ali (2020a) in predicting energy consumption data. Subtractive clustering is also used for the system proposed by Alam and Ali (2020b), and the block diagram of the system is shown in Figure 3.
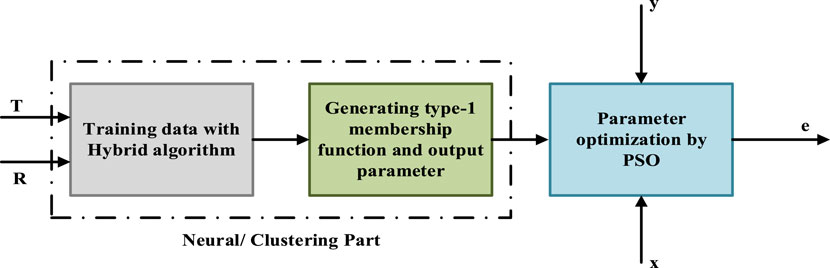
FIGURE 3. Block diagram of ANFIS System.
However, for predicting data, different parameters are determined by the PSO algorithm.
Figure 4 indicates that each input has two membership functions; therefore, only two fuzzy rules are needed for output predictions. The Gaussian fuzzy membership functions are tuned by a hybrid algorithm for both inputs. Then, the fuzzy system, based on the input membership functions, output parameters, and the input (x), as shown in Figure 3, provides the output, which comprise the energy predictions.
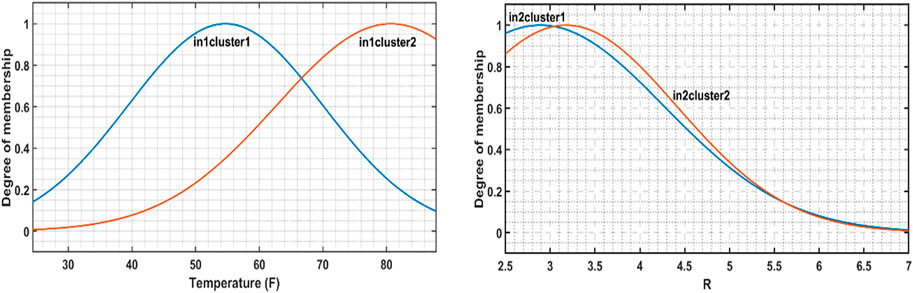
FIGURE 4. Input membership functions of ANFIS System.
3.2 Long short-term memory (LSTM) method
To compare the performance of the proposed ANFIS2, the LSTM system is used as it is a very popular method for heating load for power plants (Liu et al., 2020; Rafi et al., 2021), household load forecasting (Ageng et al., 2021), and electrical load forecasting (Islam et al., 2020; Kim et al., 2020). The block diagram of the LSTM system is shown in Figure 5 and can be explained by the following sets of equations from (3)-(8):
where
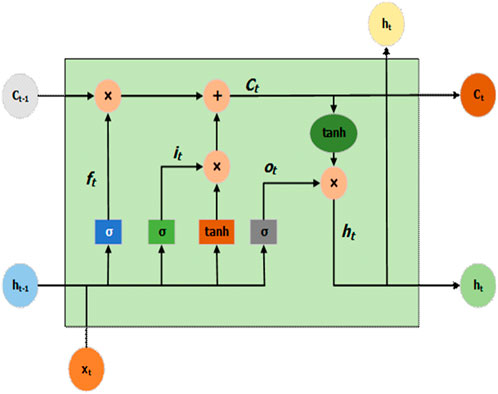
FIGURE 5. Block diagram of the LSTM system.
The ADAM optimization method is utilized for training parameter optimizations, as proposed by Wang et al. (2019).
3.3 Random forest (RF) method
The random forest method is also popular (Qi et al., 2017; Yin et al., 2020; Phyo and Jeenanunta, 2021; Sun and Bi, 2021) and widely used for load forecasting. Random forest is an ensemble approach that predicts based on the combination of decisions of all the independent trees. The randomly chosen samples are incorporated into the trees. The process of incorporation of the samples into the trees is known as bagging, whereas the chosen sample is termed a bootstrap, which is continuously changed in each step. All the decisions from each independent tree are considered with the same probability value. The classification is done by bagging algorithms, and the cart algorithm is used for determining the set of regression trees. The following equation is used to calculate the average of the output of all the trees:
where
4 Simulation results and discussion
4.1 Simulation data and conditions
The energy consumption data are obtained through the smart energy meter of an apartment in Memphis, TN, United States. The temperature is collected for Memphis City. Occupancy and day-type data are obtained from the family members living in the apartment. A total of 598 days’ data are considered in this work, and 568 days’ data are used for ANFIS2 and ANFIS network training. The remaining 30 days’ data are used for the performance evaluation of ANFIS, ANFIS2, LSTM, and RF systems for both normal and COVID-19 conditions. The parameters used for ANFIS2, ANFIS, LSTM, and RF systems are summarized in Table 1.
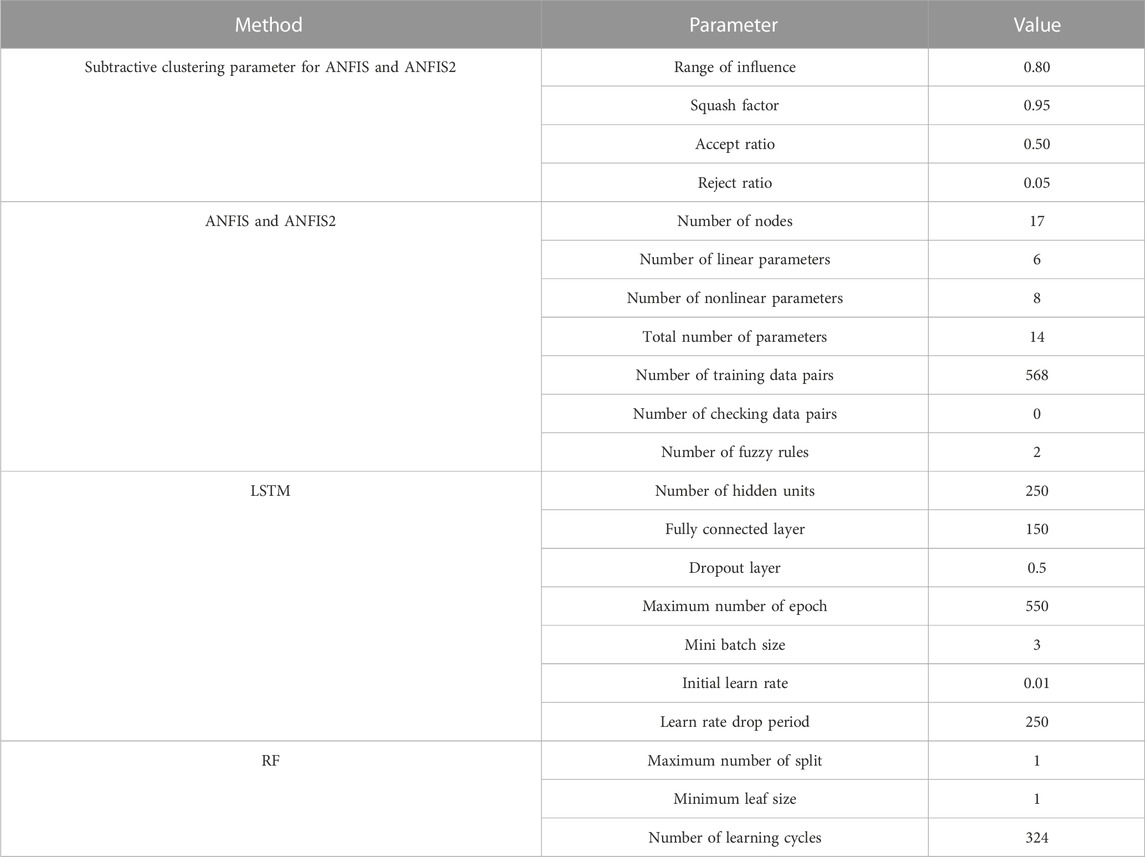
TABLE 1. ANFIS2, ANFIS, LSTM, and RF parameters.
4.2 Efficacy of the proposed ANFIS2 prediction system over ANFIS and other methods under normal conditions
As previously discussed, in this work, for both prediction systems, arbitrarily selected 30 days’ data were utilized for prediction and performance evaluation. For both systems, input occupancy data for 30 days are shown in Figure 6. Figure 7 shows input temperature data on the same days. In addition, input day-type data are shown in Figure 8.
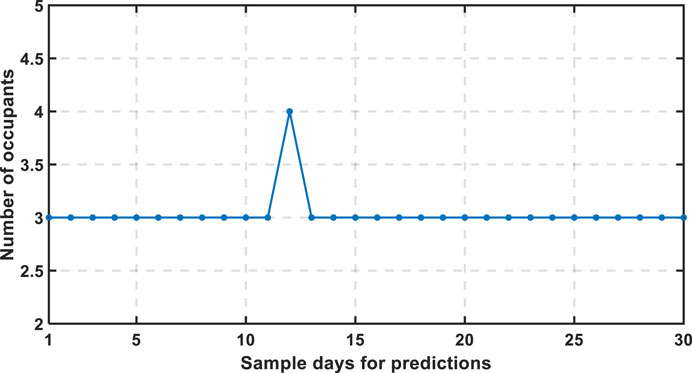
FIGURE 6. Input occupant data considered for prediction during normal time.
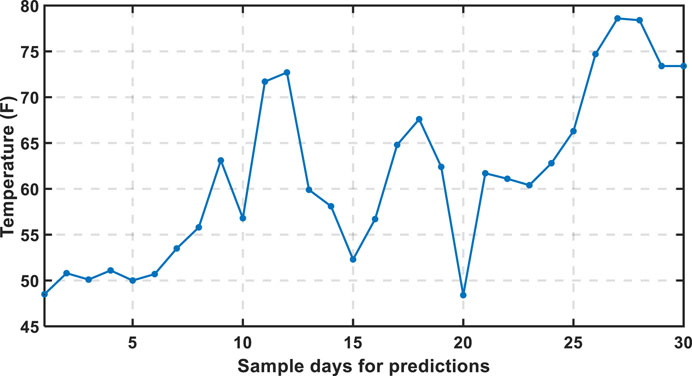
FIGURE 7. Input temperature data considered for prediction during normal time.
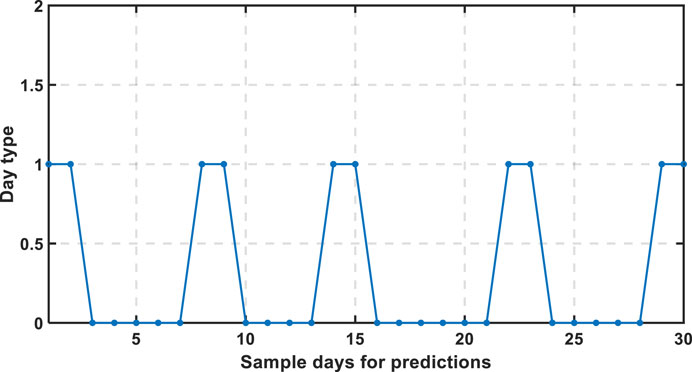
FIGURE 8. Input day-type data considered for prediction during normal time.
The performance of the ANFIS2 method and the ANFIS-based prediction systems, and the LSTM and RF methods for energy consumption data prediction are shown in Figure 9, which validates the efficacy of the proposed ANFIS2-based prediction system over ANFIS reported by Alam and Ali (2020b), LSTM, and RF system during normal times.
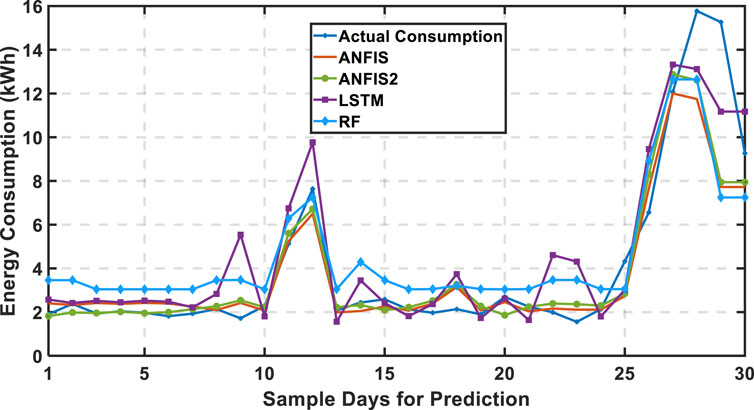
FIGURE 9. Performance of ANFIS, ANFIS2, LSTM, and RF systems for energy consumption prediction.
4.3 Index calculations for the proposed ANFIS2 and other prediction methods
The absolute percentage of error, the absolute average error, root mean square error, and mean average percentage error in prediction, which can be represented as shown in equations (10)–(13), respectively, are used for ANFIS2, ANFIS, LSTM, and RF systems as the performance index.
Here, N = 30 was used for the equations (10) to (13). Moreover, from Table 2, it can be seen that the average errors of the ANFIS2 prediction system are smaller than those of ANFIS reported in [30], LSTM, and RF systems. In this case, the performances of the ANFIS2-based system are 0.80%, 33.62%, and 45.18% better than those of ANFIS, LSTM, and RF systems, respectively. Moreover, from RMSE values calculations for all systems, it can be concluded that ANFIS2 performs 4.54%, 3.49%, and 19.82% better than the ANFIS, LSTM, and RF systems, respectively. In addition, ANFIS2 performs 2.54% better than ANFIS in terms of MAPE. Therefore, based on the performance indices tabulated in Table 2, it is obvious that the performance of the proposed ANFIS2-based prediction system is better than that of the ANFIS, LSTM, and RF systems in all cases during normal conditions.
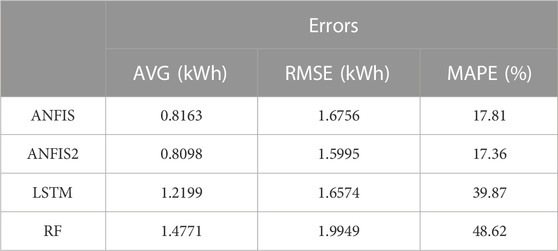
TABLE 2. Prediction errors of all predicted systems.
4.4 Effect of COVID-19 on the load pattern change and load forecasting
As already mentioned, the energy consumption patterns of residential consumers changed significantly during the COVID-19 time. The energy consumption pattern for the residential load in Memphis city, United States, is shown in Figure 10, which considers data from August 2018 to June 2021, where the data from August 2018 to 24 March 2020 are considered pre-COVID-19 data, and data from 25 March 2020 to June 2021 are considered COVID-19 data [32]. Similarly, Table 3 provides an analysis of energy consumption between pre-COVID-19 and COVID-19 conditions. Moreover, Figure 10 shows that energy consumption increased significantly for all months except May, September, and October. The maximum energy consumption increased for the month of July. In addition, from Table 3, it is evident that energy consumption has increased from January to April, ranging from 38.87% to 57.37%. The maximum increase is 60.97%, which is also evident from Figure 10. On the other hand, the minimum increase in average daily energy consumption between the pre-COVID-19 condition and the COVID-19 condition was 9.54% in August. Due to the energy consumption pattern change during the COVID-19 period, the performance of ANFIS2, ANFIS, LSTM, and RF systems requires investigations. Therefore, all systems that were tuned with normal time data are tested for COVID-19 data prediction, and randomly chosen 30 days’ data during COVID-19 conditions are used as input to all the systems.
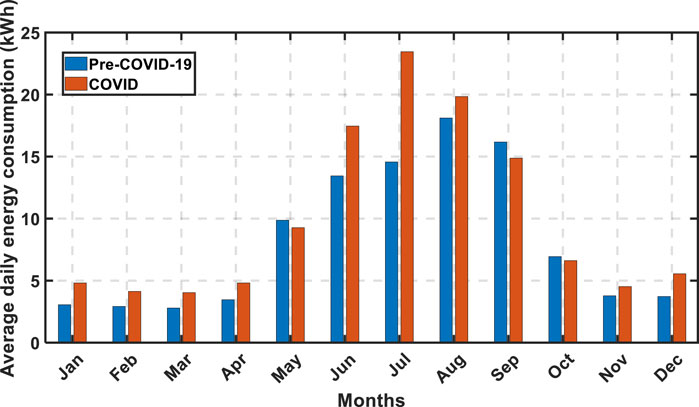
FIGURE 10. Daily average energy consumption of consumers in Memphis, United States.
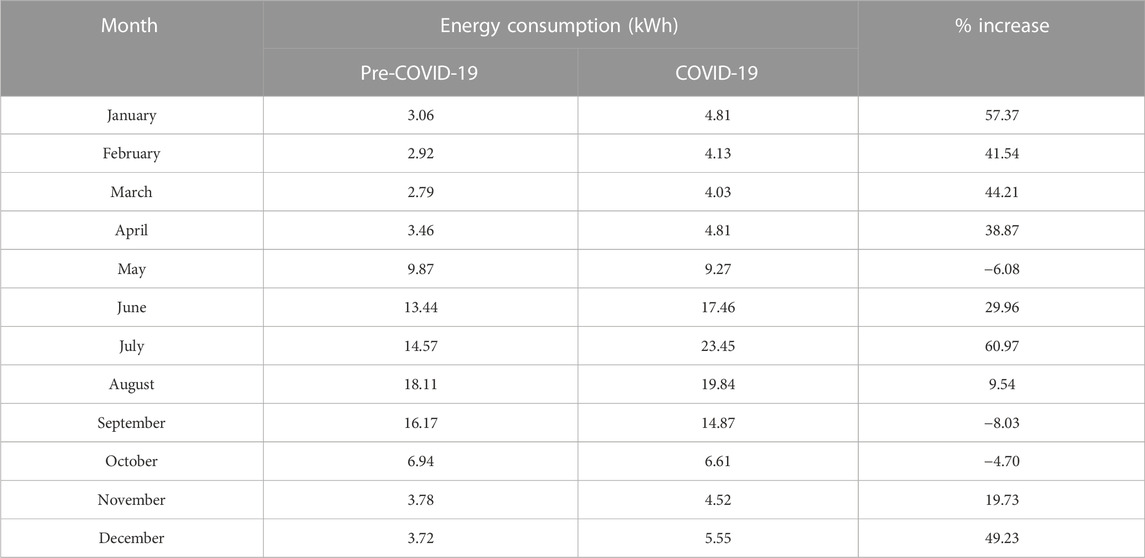
TABLE 3. Analysis of energy consumption between pre-COVID-19 and COVID-19 conditions.
Figure 11 shows the performances of the ANFIS2, ANFIS, LSTM, and RF systems in predicting daily average energy consumption during the COVID-19 period, which also validates the efficacy of ANFIS2 over ANFIS. However, the LSTM and RF systems perform better than ANFIS and ANFIS2 in predicting COVID-19 data, as shown in Table 4, as they predicted higher energy consumption for normal conditions. Therefore, predicted data by the LSTM and RF methods are closer to the actual data during COVID-19 periods. Table 4 shows that the absolute mean, RMSE, and MAPE are less (which indicates improvements of 16.19%, 6.53%, and 20.42%, respectively) for the LSTM system compared to the proposed ANFIS2.
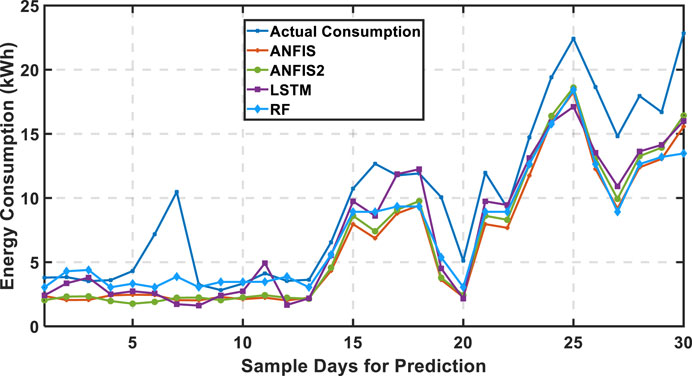
FIGURE 11. Comparison of performance of ANFIS2, ANFIS, LSTM, and RF systems for prediction during COVID-19 conditions.
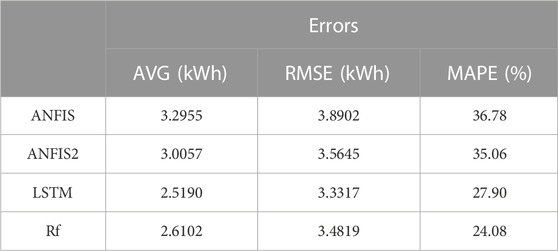
TABLE 4. Prediction errors of predicted systems for COVID-19 data.
However, the prediction errors increased for ANFIS2 for COVID-19 data, as compared to the normal condition data, which is evident from Table 5. Therefore, the absolute mean, RMSE, and MAPE of ANFIS2 have increased by 271.17%, 122.85%, and 101.96%, respectively. This means ANFIS2 should be modified so that it can also predict well for COVID-19 data.
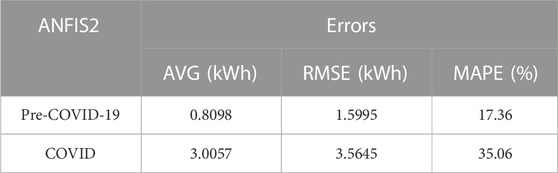
TABLE 5. Prediction error comparison of ANFIS2 system.
4.5 Tuning of the ANFIS2 method parameters to adapt with the changed load due to COVID-19
To improve the performance of ANFIS2, two situations are considered. In the first situation, the input of ANFIS2 is changed to cope with the energy consumption pattern while keeping the same ANFIS2 that has been tuned with normal condition data. In the second situation, the changed parameter is considered while ANFIS2 is tuned with COVID-19 data.
4.5.1 Condition 1
As ANFIS2 has only two inputs, one of them can be changed to cope with the energy consumption pattern change. Moreover, the first input is the temperature that cannot be changed. Therefore, the second input, R, should be changed as compared to the normal conditions. R is determined from occupancy and the day type (Alam and Ali, 2020b). The value of day type (d) is considered to be 0, 1, and 2 for weekdays, weekends, and special days, respectively. The reason behind choosing these values is that during weekdays, most of the family members will be out for work, and during the weekend, they will stay at home. Moreover, during special days, the energy consumption will be higher than the conventional days. However, during COVID-19 periods, most of the family members worked from home on weekdays. Therefore, the energy consumption changed tremendously for weekdays. As the number of occupants has not changed during COVID-19 time, the values of d for the weekdays, weekends, and special days can be considered 2, 1, and 2, respectively, for COVID-19 data.
Finally, based on the changed input R and ANFIS2 that was tuned with normal time data, the 30 days’ daily average energy consumption, which are the same as shown in Figure 11, are shown in Figure 12. Figure 12 indicates that the performance of the modified1 ANFIS2 has improved by just adjusting R and without retuning ANFIS2. Moreover, the errors are reduced, as shown in Table 6. The absolute mean error, RMSE, and MAPE are reduced by 38.65%, 41.51%, and 25.95%, respectively.
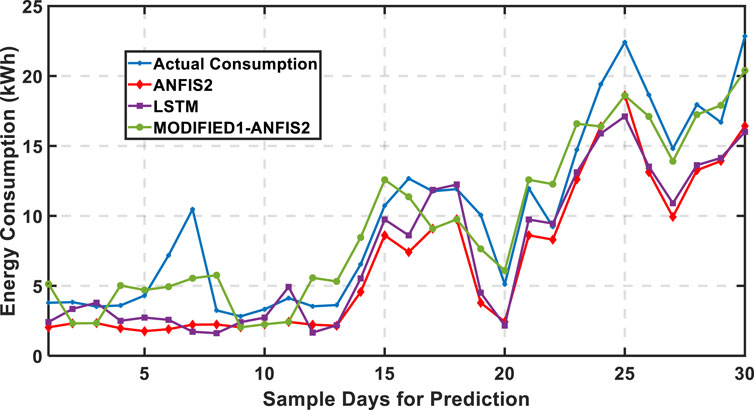
FIGURE 12. Comparison of performances of ANFIS2, modified1-ANFIS2, and LSTM systems for prediction during COVID-19 conditions.
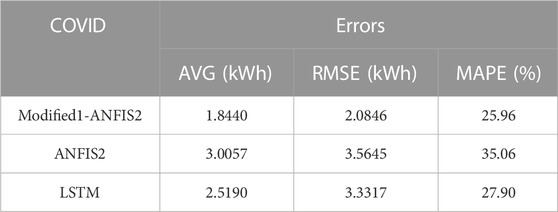
TABLE 6. Prediction error comparison among ANFIS2 and LSTM system.
Moreover, the absolute mean error, RMSE, and MAPE are less than that of the LSTM system that performs better than ANFIS2 without any modification for COVID-19 data.
4.5.2 Condition 2
Figure 13 shows the modified model for ANFIS2 that can predict well both normal data and COVID-19 data. All the data are incorporated into ANFIS2, which separates normal data and COVID-19 data, and these different data are sent to two different sections. Normal data are sent to ANFIS2 that was tuned with normal data. This section will have the same parameters as shown in Table 1 and Figure 2. Similarly, COVID-19 data are received by ANFIS2 that was tuned by COVID-19 data. This section, as tuned by the COVID-19 data, has different parameters, which are shown in Table 7 and Table 8.
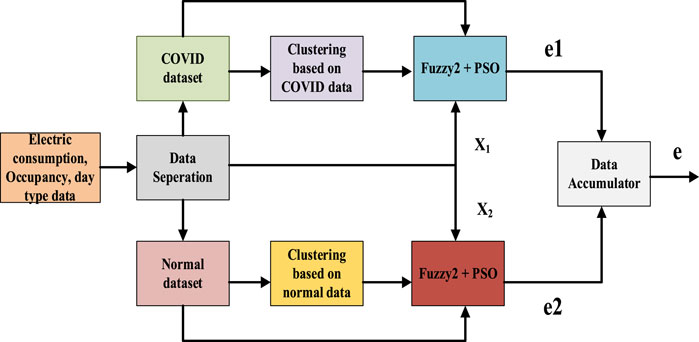
FIGURE 13. Modified2-ANFIS2 system for prediction during COVID-19.
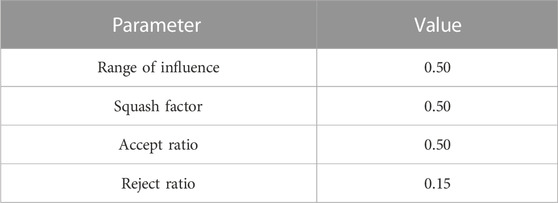
TABLE 7. Subtractive clustering parameter for COVID-19 data tuning.
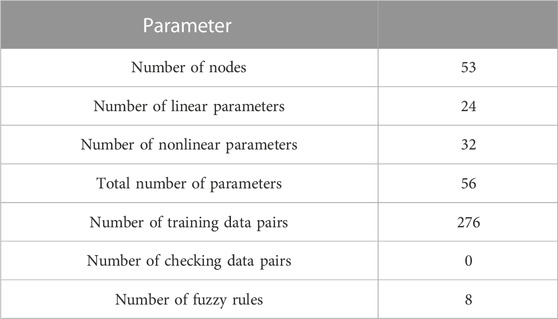
TABLE 8. ANFIS2 parameter for COVID-19 data tuning.
Moreover, the membership function is different, as shown in Figure 14, which has eight membership functions for each input compared to two membership functions for each input for the ANFIS2 section that will process normal data. The eight membership functions are selected based on subtractive clustering that considers the type of data and correlation between input and output data during the COVID-19 situation. Similar to the fuzzy-2 system, the membership function has upper and lower membership functions. All the membership functions inside a particular figure are tuned based on the correlation between the input and output for various ranges of input. Moreover, the output membership functions of the type-2 fuzzy system remain the same as in the conventional fuzzy system, which are linear functions considered for this work. In both sections, the two inputs are kept the same, and the day type is considered the same for both normal and COVID-19 periods, which were considered for ANFIS2. The data separation unit provides COVID-19 data input (X1) and normal data input (X2) to two separate sections. The COVID-19 (e1) and normal predicted data (e2) are incorporated into the data accumulator, which will provide predicted data (e) from modified2-ANFIS2. Therefore, both normal and COVID-19 data can be predicted by modified2-ANFIS2, and it will be robust for all conditions.
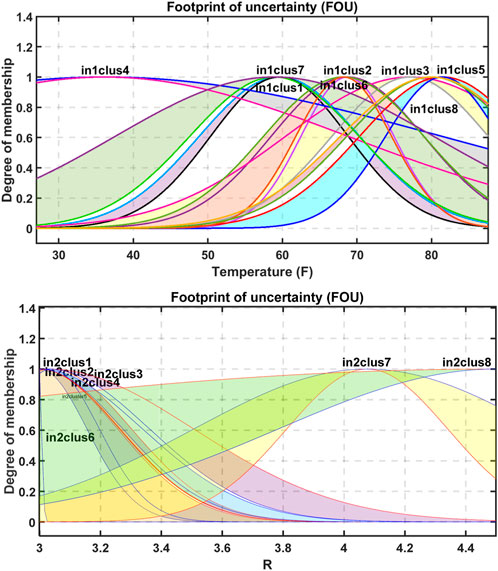
FIGURE 14. Input membership functions for modified2-ANFIS2 system that are tuned with COVID-19 data.
The performance of modified2-ANFIS2 along with modified1-ANFIS2 and LSTM systems, for the same data prediction, as shown in Figure 11 and Figure 12, is shown in Figure 15. For the purpose of performance comparison, the predicted data by modified1-ANFIS2 are also shown in Figure 15. Figure 15 shows that modified2-ANFIS2 performs better than the modified1-ANFIS2 and LSTM systems for predicting the same data. Therefore, the error is further reduced, which is evident from Table 9. The absolute mean error, RMSE, and MAPE are reduced by 32.77%, 2.15%, and 45.42%, respectively. So the modified2-ANFIS2 system performs the best in predicting energy consumption during the COVID-19 situation.
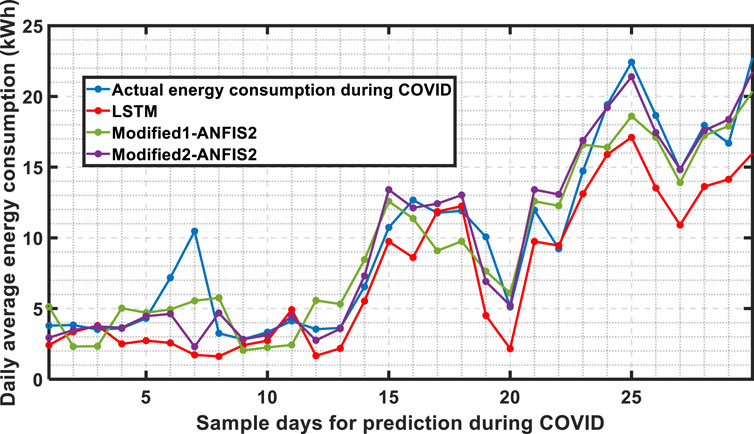
FIGURE 15. Comparison of performances of LSTM, modified1-ANFIS2, and modified2-ANFIS2 systems for prediction during COVID-19.
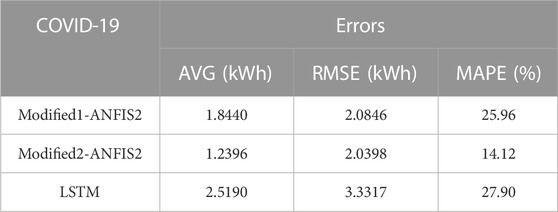
TABLE 9. Prediction error comparison among modified ANFIS2 and LSTM methods.
5 Conclusion
In this work, a new ANFIS2 method is implemented for the prediction of residential energy consumption for both normal days and COVID-19 conditions. To validate the efficacy of the proposed ANFIS2, its performance has been compared with the proposed ANFIS reported in Alam and Ali (2020a), LSTM, and RF systems. For training purpose of the systems, 598 days’ data are utilized, and data of 30 days are considered for the prediction of energy consumption. Moreover, the performances of all the systems are evaluated for COVID-19 situations as the change in energy consumption is reported in the literature. Two modifications in terms of the input and parameters of ANFIS2 are made to cope with the change in the consumption pattern and to reduce the prediction errors during COVID-19. Based on the obtained results, the following conclusions can be made:
a) The proposed ANFIS2-based prediction system is effective in forecasting residential loads during both normal and COVID-19 periods.
b) The performance of the proposed ANFIS2 method is better than that of the existing ANFIS, LSTM, and RF approaches during both normal and COVID-19 situations.
c) The proposed ANFIS2 can be easily implemented in real practice for both normal and COVID-19 conditions.
In the near future, other new methods for load forecasting will be explored. In addition, the performance of those methods will be compared with that of the proposed ANFIS2. The limitation of the proposed modified2-ANFIS2 is that data are manually separated, which is done by the consumer. In the future, a more robust system that can automatically separate the pre-COVID-19 and COVID-19 data by analyzing the pattern will be explored.
Data availability statement
The original contributions presented in the study are included in the article/Supplementary Material; further inquiries can be directed to the corresponding author.
Author contributions
SMMA: conceptualization, data curation, formal analysis, investigation, methodology, validation, and writing–original draft. MHA: conceptualization, investigation, project administration, resources, supervision, and writing–review and editing.
Funding
The author(s) declare that no financial support was received for the research, authorship, and/or publication of this article.
Conflict of interest
The authors declare that the research was conducted in the absence of any commercial or financial relationships that could be construed as a potential conflict of interest.
The author(s) declared that they were an editorial board member of Frontiers at the time of submission. This had no impact on the peer review process and the final decision.
Publisher’s note
All claims expressed in this article are solely those of the authors and do not necessarily represent those of their affiliated organizations, or those of the publisher, the editors, and the reviewers. Any product that may be evaluated in this article, or claim that may be made by its manufacturer, is not guaranteed or endorsed by the publisher.
References
Ageng, D., Huang, C.-Y., and Cheng, R.-G. (2021). “A short-term household load forecasting framework using LSTM and data preparation,” in IEEE access, 9, 167911–167919.
Alam, S. M. M., and Ali, M. H. (2020a). “A new subtractive clustering based ANFIS system for residential load forecasting,” in IEEE PES innovative smart grid technologies (ISGT) conference (Washington D.C., USA, 1–5.
Alam, S. M. M., and Ali, M. H. (2020b). Equation based new methods for residential load forecasting. Energies 13, 6378. doi:10.3390/en13236378
Alam, S. M. M., and Ali, M. H. (2020c). “A new fuzzy logic based method for residential loads forecasting,” in 2020 IEEE/PES transmission and distribution conference and exposition (T&D) (IEEE), 1–6.
Alam, S. M. M., and Ali, M. H. (2021). Analysis of COVID-19 effect on residential loads and distribution transformers. Int. J. Electr. Power and Energy Syst. 129, 106832. doi:10.1016/j.ijepes.2021.106832
Almalaq, A., and Edwards, G. (2019). “Comparison of recursive and non-recursive ANNs in energy consumption forecasting in buildings,” in 2019 IEEE green technologies conference (GreenTech), 1–5.
Alonso, R., and Chávez, A. (2017). “Short term load forecast method using artificial neural network with artificial immune systems,” in 2017 ieee urucon, 1–4.
Alrizq, M., and de Doncker, E. (2018). “A novel fuzzy based human behavior model for residential electricity consumption forecasting,” in 2018 IEEE power and energy conference at Illinois (PECI), 1–7.
Anoop, K. J., and Kanchana, K. (2017). “Short term load forecasting using fuzzy logic control,” in 2017 IEEE international conference on power, control, signals and instrumentation engineering (ICPCSI), 2983–2986.
Aviad, N., Machlev, R., Carmon, D., Onile, A. E., Belikov, J., and Levron, Y. (2021). Effects of the COVID-19 pandemic on energy systems and electric power grids—a review of the challenges ahead. Energies 14 (4), 1056. doi:10.3390/en14041056
Banitalebi, B., Appadoo, S. S., Thavaneswaran, A., and Hoque, M. E. (2020). “Modeling of short-term electricity demand and comparison of machine learning approaches for load forecasting,” in 2020 IEEE 44th annual computers, software, and applications conference (COMPSAC), 1302–1307.
Bompard, E., Mosca, C., Colella, P., Antonopoulos, G., Fulli, G., Masera, M., et al. (2020). The immediate impacts of COVID-19 on European electricity systems: AFirst assessment and lessons learned. Energies 14 (1), 96. doi:10.3390/en14010096
Chandran, L. R., Jayagopal, N., Lal, L. S., and Narayanan, C. (2021). “Residential load time series forecasting using ANN and classical methods,” in 2021 6th international conference on communication and electronics systems (ICCES), 1508–1515.
Chowdhury, D., Sarkar, M., Haider, M. Z., and Alam, T. (2018). “Zone wise hourly load prediction using regression decision tree model,” in 2018 international conference on innovation in engineering and technology (ICIET), 1–6.
Islam, M. R., Al Mamun, A., Sohel, M., Hossain, M. L., and Uddin, M. M. (2020). “LSTM-based electrical load forecasting for chattogram city of Bangladesh,” in 2020 international conference on emerging smart computing and informatics (ESCI), 188–192.
Kapoor, A., and Sharma, A. (2018). “A comparison of short-term load forecasting techniques,” in 2018 IEEE innovative smart grid technologies - asia (ISGT Asia), 1189–1194.
Khan, A. R., Razzaq, S., Alquthami, T., Moghal, M. R., Amin, A., and Mahmood, A. (2018). “Day ahead load forecasting for IESCO using artificial neural network and bagged regression tree,” in 2018, 1st international conference on power (Energy and Smart Grid ICPESG), 1–6.
Kim, W., Han, Y., Kim, K. J., and Song, K. (2020). Electricity load forecasting using advanced feature selection and optimal deep learning model for the variable refrigerant flow systems. Energy Rep. 6, 2604–2618. doi:10.1016/j.egyr.2020.09.019
Kim, Y., Son, H., and Kim, S. (2019). Short term electricity load forecasting for institutional buildings. Energy Rep. 5, 1270–1280. doi:10.1016/j.egyr.2019.08.086
Kong, W., Dong, Z. Y., Jia, Y., Hill, D. J., Xu, Y., and Zhang, Y. (2019). Short-term residential load forecasting based on LSTM recurrent neural network. IEEE Trans. Smart Grid 10 (1), 841–851. doi:10.1109/TSG.2017.2753802
Liu, J., Wang, X., Zhao, Y., Dong, B., Lu, K., and Wang, R. (2020). “Heating load forecasting for combined heat and power plants via strand-based LSTM,” in IEEE access, 8, 33360–33369.
MathWorks (2021a). Type-2 fuzzy inference systems. Available at: https://www.mathworks.com/help/fuzzy/type-2-fuzzy-inference-systems.html (Accessed December 9, 2021).
MathWorks (2021b). Type-2 fuzzy inference systems. Available at: https://www.mathworks.com/help/fuzzy/mamfistype2.converttotype2.html (Accessed December 9, 2021).
Mendel, J. M., Hagras, H., Tan, W.-W., Melek, W. W., and Ying, H. (2014). Introduction to type-2 fuzzy logic control. Hoboken, NJ.: Wiley and IEEE Press.
Moon, J., Kim, Y., Son, M., and Hwang, E. (2018). Hybrid short-term load forecasting scheme using random forest and multilayer perceptron. Energies 11 (12), 3283. doi:10.3390/en11123283
Moradzadeh, A., Mohammadi-Ivatloo, B., Abapour, M., Anvari-Moghaddam, A., and Roy, S. S. (2022). Heating and cooling loads forecasting for residential buildings based on hybrid machine learning applications: a comprehensive review and comparative analysis. IEEE Access 10, 2196–2215. doi:10.1109/access.2021.3136091
Nair, A. S., Hossen, T., Campion, M., and Ranganathan, P. (2018). “Optimal operation of residential EVs using DNN and clustering based energy forecast,” in 2018 north American power symposium (NAPS) (Fargo, ND, 1–6.
Oprea, S., and Bâra, A. (2019). Machine learning algorithms for short-term load forecast in residential buildings using smart meters, sensors and big data solutions. IEEE Access 7, 177874–177889. doi:10.1109/access.2019.2958383
Phyo, P. P., and Jeenanunta, C. (2021). Daily load forecasting based on a combination of classification and regression tree and deep belief network. IEEE Access 9, 152226–152242. doi:10.1109/access.2021.3127211
Qi, Y., Luo, B., Wang, X., and Wu, L. (2017). “Load pattern recognition method based on fuzzy clustering and decision tree,” in 2017 IEEE conference on energy internet and energy system integration (EI2), 1–5.
Rafi, S. H., Nahid, A. M., Deeba, S. R., and Hossain, E. (2021). “A short-term load forecasting method using integrated CNN and LSTM network,” in IEEE access, 9, 32436–32448.
Rana, M., Sethuvenkatraman, S., and Goldsworthy, M. (2022). A data-driven approach based on quantile regression forest to forecast cooling load for commercial buildings. Sustain. Cities Soc. 76, 103511. doi:10.1016/j.scs.2021.103511
Shabbir, N., Ahmadiahangar, R., Kütt, L., and Rosin, A. (2019). “Comparison of machine learning based methods for residential load forecasting,” in 2019 electric power quality and supply reliability conference (PQ) and 2019 symposium on electrical engineering and mechatronics (SEEM), 1–4.
Shao, H., Sun, X., Zhao, L., and Wang, J. (2018). “Interval day-ahead load forecast of micro grid with fuzzy similar data selection and Gaussian process,” in 2018 IEEE 8th annual international conference on CYBER technology in automation, control, and intelligent systems (CYBER), 1578–1583.
Sharma, S., Majumdar, A., Elvira, V., and Chouzenoux, E. (2020). Blind Kalman filtering for short-term load forecasting. IEEE Trans. Power Syst. 35 (6), 4916–4919. doi:10.1109/tpwrs.2020.3018623
Sławomir, B., Skoczkowski, T., Sobczak, L., Buchoski, J., Maciąg, Ł., and Dukat, P. (2020). Impact of the lockdown during the COVID-19 pandemic on electricity use by residential users. Energies 14 (4), 980. doi:10.3390/en14040980
Sulaiman, S. M., Aruna Jeyanthy, P., Devaraj, D., Mohammed, S. S., and Shihabudheen, K. V. (2019). “Smart meter data analytics for load prediction using extreme learning machines and artificial neural networks,” in 2019 IEEE international conference on clean energy and energy efficient electronics circuit for sustainable development (INCCES), 1–4.
Sun, H., and Bi, Z. (2021). “Hybrid forecasting model of electric heating load based on CART decision tree regression,” in 2021 IEEE international conference on artificial intelligence and computer applications (ICAICA), 204–208.
U Yeom, C.-, and Kwak, K.-C. (2018). Performance comparison of ANFIS models by input space partitioning methods. Symmetry 10, 700. doi:10.3390/sym10120700
Wang, Y., Zhang, N., and Chen, X. (2021). A short-term residential load forecasting model based on LSTM recurrent neural network considering weather features. Energies 14 (10), 2737. doi:10.3390/en14102737
Wang, Y., Zhu, S., and Li, C. (2019). “Research on multistep time series prediction based on LSTM,” in 2019 3rd international conference on electronic information technology and computer engineering (EITCE), 1155–1159.
Wang, Z., and Srinivasan, R. S. (2017). A review of artificial intelligence-based building energy use prediction: contrasting the capabilities of single and ensemble prediction models. Renew. Sustain. Energy Rev. 75, 796–808. doi:10.1016/j.rser.2016.10.079
Wang, Z., Wang, Y., Zeng, R., Srinivasan, R. S., and Ahrentzen, S. (2018). Random Forest based hourly building energy prediction. Energy Build. 171, 11–25. doi:10.1016/j.enbuild.2018.04.008
Wu, D., and Nie, M. (2011). “Comparison and practical implementation of type-reduction algorithms for type-2 fuzzy sets and systems,” in 2011 IEEE international conference on fuzzy systems (FUZZ-IEEE 2011) (Taipei, 2131–2138.
Yiling, H., and Shaofeng, H. (2020). “A short-term load forecasting model based on improved random forest algorithm,” in 2020 7th international forum on electrical engineering and automation (IFEEA), 928–931.
Yin, L., Sun, Z., Gao, F., and Liu, H. (2020). Deep forest regression for short-term load forecasting of power systems. IEEE Access 8, 49090–49099. doi:10.1109/access.2020.2979686
Zang, H., Xu, R., Cheng, L., Ding, T., Liu, L., Wei, Z., et al. (2021). Residential load forecasting based on LSTM fusing self-attention mechanism with pooling. Energy 229, 120682. doi:10.1016/j.energy.2021.120682
Zhang, Z., Cheshmehzangi, A., and Ardakani, S. P. (2021). A data-driven clustering analysis for the impact of COVID-19 on the electricity consumption pattern of Zhejiang province, China. Energies 14 (23), 8187. doi:10.3390/en14238187
Keywords: Adaptive neuro-fuzzy 2 inference system, COVID-19, load forecasting, residential load, particle swarm optimization
Citation: Alam SMM and Ali MH (2024) Residential load forecasting by a PSO-tuned ANFIS2 method considering the COVID-19 influence. Front. Energy Res. 11:1292183. doi: 10.3389/fenrg.2023.1292183
Received: 11 September 2023; Accepted: 30 November 2023;
Published: 08 January 2024.
Edited by:
ZhaoYang Dong, Nanyang Technological University, SingaporeReviewed by:
Linfei Yin, Guangxi University, ChinaAnna Diva Lotufo, UNESP campus of Ilha Solteira, Brazil
Copyright © 2024 Alam and Ali. This is an open-access article distributed under the terms of the Creative Commons Attribution License (CC BY). The use, distribution or reproduction in other forums is permitted, provided the original author(s) and the copyright owner(s) are credited and that the original publication in this journal is cited, in accordance with accepted academic practice. No use, distribution or reproduction is permitted which does not comply with these terms.
*Correspondence: Mohd. Hasan Ali, bWhhbGlAbWVtcGhpcy5lZHU=