 Chaoliang Qi1Zhigang Chen1Xin Chen1Yuzhe Bao1Tianji He1Sijia Hu2
 Jinheng Li2*Yanshen Liang2Fenglan Tian1Mufeng Li1
- 1State Grid Zhengzhou Power Supply Company of Henan Electric Power Company, Zhengzhou, China
- 2Key Laboratory of Power System Optimization and Energy Technology, Guangxi University, Nanning, China
Infrared technology holds significant importance in the detection of electrical equipment, as it has the capability to swiftly and securely identify electrical apparatus. To simplify the implementation of proficient detection frameworks for electrical equipment within constrained settings (like embedded apparatus), this study presents an enhanced, lightweight model of the single-shot multibox detector (SSD). This model specifically addresses the detection of multiple equipment objects within infrared imagery. The model realized the lightweight of the model by using the network structure characteristics of squeezenet to modify the backbone network of SSD, and compensated for the impact of the lightweight model on the detection accuracy by adding multiple convolutional layers and connecting branches to enhance the propagation ability and extraction ability of features. To ensure a comprehensive evaluation of the model’s detection capabilities, all the models discussed in this study employed the technique of random weight initialization. This approach was utilized to validate the optimal structure of the model and its performance. The experimentation was conducted on both the PASCAL VOC 2007 benchmark dataset and an infrared image dataset encompassing five distinct categories of electrical equipment found within substations. The experimental outcomes indicate that this model offers an efficient approach for achieving lightweight, real-time detection of electrical apparatus.
1 Introduction
To address the growing need for sustainable energy, there is an accompanying requirement for the expansion and complexity of power systems. The power system needs continuous inspection and preventive maintenance to ensure its normal trouble-free operation (Lu et al., 2017; Song et al., 2018). Among them, detection of substation is very important, because the electrical problems in the substation will not only cause power system outage, local economic losses, and may even lead to casualties. Therefore, real-time and effective detection of substation is extremely crucial to ensure its safety and long-term operation (Menendez et al., 2017; Usamentiaga et al., 2018; Li et al., 2019).
Infrared thermal imaging technology has many advantages over other types of sensors, so it has become a widely accepted condition monitoring technology (Osornio-Rios et al., 2019; He et al., 2017). Infrared thermal image detection is a technology to diagnose whether the equipment is in good running state or not based on the thermal distribution of the equipment. This technology can be non-contact far away from the equipment to be detected, and the temperature measuring range is wide, so technicians can quickly scan and detect electrical equipment (Zou and Huang, 2015; Zhao et al., 2017; Ma et al., 2021).
Due to the substantial image data produced during substation detection, the conventional security inspection process necessitates significant time and extensive human and material resources for performing state assessment on electrical equipment. The extended periods of engagement for technicians in this task can result in fatigue and potential misdiagnosis (Jadin et al., 2015; Zhao et al., 2016; Wang et al., 2020). To circumvent the limitations inherent to manual analysis of infrared images, numerous intelligent methods for detecting electrical equipment have been proposed. Compared with the manual method, intelligent detection methods are more flexible, saves time and resources, and can greatly improve detection efficiency.
A summary of some methods is shown in Table 1. Wu and An (2014) proposed a new region-based ACM algorithm for feature extraction of non-uniform insulators. While this approach effectively addresses the challenge of segmenting images with significantly uneven textures, there is a need for further enhancement in the adaptability of weight parameter selection. In the work cited as Reddy and Mohanta (2013), an approach was introduced to assess the condition of insulators. This method employs a combination of support vector machines and an adaptive neuro-fuzzy inference system. Additionally, it utilizes features extracted from a discrete orthogonal transformation to enhance its performance. However, the method based on color feature was sensitive to complex background and needed to adjust appropriate threshold parameters. A novel texture segmentation algorithm was proposed in Wu et al. (2012), which could divide complex aviation insulator image into subregions with smooth contours. Nonetheless, there is room for enhancement in refining the adaptive selection process for the weight parameters within this algorithm.
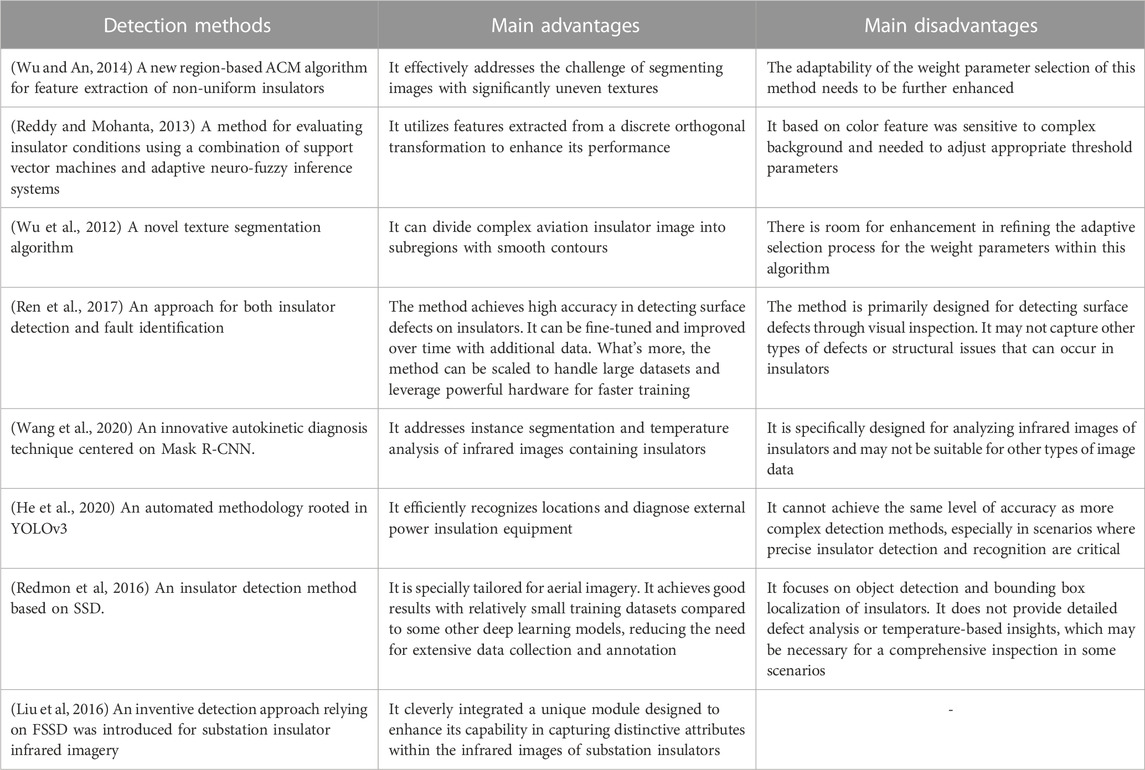
TABLE 1. The summary of research methods.
Over the past few years, the surge in computational power has prompted a heightened focus on deep learning (Lecun et al., 2015). Deep learning techniques are progressively finding broader applications in tasks such as image classification, fault detection, and object localization (Lan et al., 2019; Peng et al., 2019; Mei et al., 2020; Xi et al., 2020). The convolutional neural network (CNN) is a special type of deep learning model that has achieved excellent performance in competitions related to computer vision and image processing (Khan et al., 2020). This deep architecture helps learn more complex features from images. AlexNet (Krizhevsky et al., 2012) was one of the pioneering CNN architectures that achieved a breakthrough in image classification tasks. It introduced the concept of using multiple GPU units for training and utilized techniques like ReLU activation functions and dropout to enhance model performance. The structure of CNN includes convolutional layer, pooling layer, and fully connected layer. Instead of using several convolutional layers, Visual Geometry Group (VGG) (Simonyan and Zisserman, 2014a) repeatedly uses a series of smaller 3 × 3 convolutional filters compared to traditional CNN, creating a network with greater depth. There are numerous other advanced CNN architectures beyond VGG and AlexNet, each with its own unique features and design principles. For example, GoogLeNet (Szegedy et al, 2017) introduced the idea of Inception modules, which use multiple filter sizes in parallel to capture features at various scales. Residual Network (ResNet) (He et al, 2016a) employed residual connections to address the vanishing gradient problem, allowing the training of very deep networks. The traditional CNN approach serves as the foundation upon which these advanced architectures are built. They all share the core components of convolutional layers for feature extraction, pooling layers for spatial reduction, and fully connected layers for classification or regression. What distinguishes them are innovations in network depth, architectural design, and regularization techniques, which improve their ability to learn and represent complex patterns in images.
Within this domain, spatial pyramid pooling networks (He et al., 2015), Faster R-CNN (Ren et al., 2017), and Mask R-CNN (He et al., 2020) represent prevalent instances of two-stage object detection architectures. On the other hand, YOLO (Redmon et al, 2016), the single-shot multibox detector (Liu et al.), and CornerNet (Law and Deng, 2018) exemplify widely employed single-stage object detection frameworks. Drawing from the foundations of Faster R-CNN, Kang et al. (2019) introduced an approach for both insulator detection and fault identification. Meanwhile, Wang et al. (2020) put forward an innovative autokinetic diagnosis technique centered on Mask R-CNN. This technique addresses instance segmentation and temperature analysis of infrared images containing insulators. Additionally, Liu et al. (2020) outlined an automated methodology rooted in YOLOv3 to efficiently recognize locations and diagnose external power insulation equipment. The utilization of a deep learning algorithm facilitated the extraction of isolators, thereby allowing the examination of image attributes in the visible light spectrum. Miao et al. (2019) proposed an insulator detection method based on SSD, specially tailored for aerial imagery. In the study outlined by Zheng et al. (2020), an inventive detection approach relying on FSSD was introduced for substation insulator infrared imagery. This model cleverly integrated a unique module designed to enhance its capability in capturing distinctive attributes within the infrared images of substation insulators.
Although these methods have achieved great results in terms of detection accuracy, they have not carried out a good tradeoff study on model size, detection speed and detection accuracy. Given the substantial image data captured amidst complex backgrounds during substation inspections, the pursuit of a real-time detection model exhibiting enhanced precision within confined environments becomes imperative. This research amalgamates the distinctive network structure attributes of squeezenet (andola et al., 2016) to introduce a lightweight SSD detection model. This model is tailored for effecting object detection within infrared images portraying a diverse range of electrical equipment categories. The attainment of a lightweight design for this model is achieved through the modification of the SSD’s backbone network. However, it’s essential to note that reducing the model’s weight by lowering its network depth could potentially result in a diminishment of the model’s nonlinear expression capabilities. This, in turn, may lead to a decline in the model’s efficacy in feature fitting. Hence, to counterbalance the potential effect of the lightweight model on detection accuracy, this approach introduces multiple interconnected branches into the backbone network. This augmentation serves to bolster the feature’s propagation capacity. Additionally, following the backbone network, several convolutional layers are incorporated to elevate the model’s feature extraction proficiency.
This study presents a novel endeavor that conducts comprehensive experiments and discussions involving the utilization of squeezenet’s distinctive structure to achieve the lightweight nature of SSD. To ensure thorough validation of this paper’s model performance, all models adopt a randomized weight initialization strategy, excluding transfer learning. Through meticulous control of iteration count and training set proportions, the optimal model is deduced based on analytical assessment of experimental outcomes. Experiments are performed on both the Pascal VOC 2007 benchmark dataset and separate datasets encompassing five categories of electrical equipment. The outcomes reveal that, compared to SSD and other lightweight models, the model established within this paper not only achieves lightweight status but also successfully adheres to the prerequisites of real-time detection, yielding commendable detection efficacy.
2 The lightweight detector model
Given the acquisition of numerous infrared images of electrical equipment against intricate backgrounds during substation safety inspections, the enhancement of SSD’s lightweight attributes is pursued in this study. This endeavor is aimed at enabling efficient detection of electrical equipment within constrained environments, while concurrently fulfilling the demands of real-time detection. The model’s configuration is illustrated in Figures 1, 2.
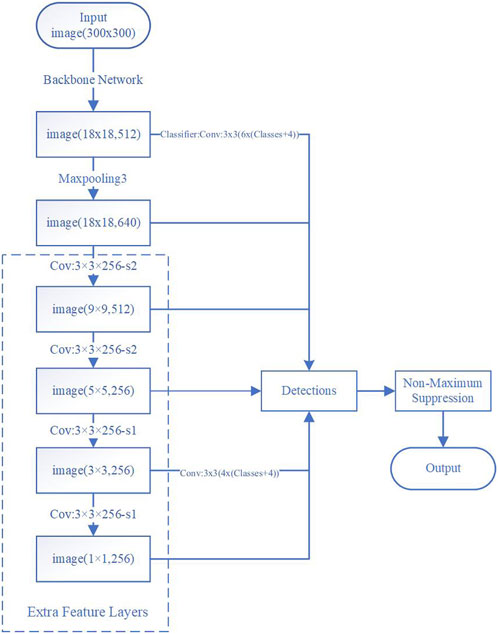
FIGURE 1. Flowchart of the proposed method.
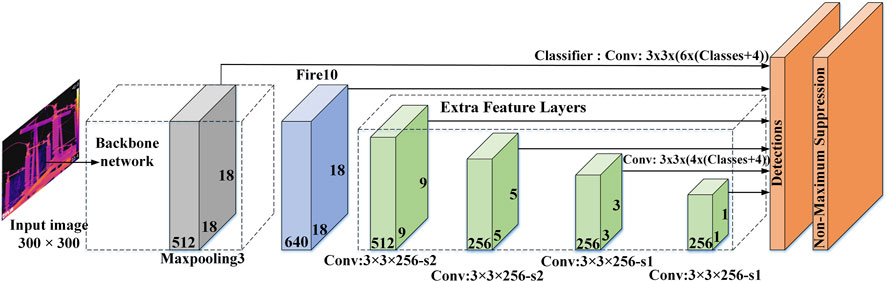
FIGURE 2. Structure of the proposed model.
2.1 Improved SSD model
The detection model introduced in this study employs the inherent squeezenet network characteristics to achieve lightweight functionality. It additionally integrates SSD’s multi-scale detection approach to facilitate object detection. The model workflow is shown in Figure 2.
Firstly, conv10 and global maximum pooling layer are deleted on the basis of squeezenet network, and fire10 is added. Then the modified structure replaces the VGG 16 (Simonyan and Zisserman, 2014b) structure as the backbone network of SSD. In the meantime, in order to make up for the impact of lightweight on detection accuracy, a number of convolutional layers with gradually decreasing scale are added after the backbone network, and then add multiple bypass connections in the backbone network. Feature maps produced through a deeper convnet network have the capacity to embody heightened semantic information coupled with translation invariance. While this confers benefits to object recognition, it may prove less suitable for precise object localization. Due to its enhanced capacity for detailed information, the shallow feature layer proves advantageous for object detection (Li and Zhou, 2017). To optimize the utilization of insights from the model’s shallow layers, this study integrates two feature maps within the backbone network to enhance detection capabilities.
2.2 The lightweight detector model
2.2.1 Enhanced object detection framework
The cornerstone of this paper’s framework encompasses the fusion of the single-stage object detection algorithm SSD and the compacting squeezenet compression network. The SSD object detection algorithm showcases commendable performance in terms of both speed and accuracy, while additionally exhibiting robust adaptability to shifts in object scale. The SSD model consists of two distinct segments. The primary facet entails the central VGG16 architecture network, while the ensuing aspect entails an integrated convolutional layer structure aimed at augmenting detection precision and orchestrating a gradual diminution in the feature map’s dimensions to fashion a feature pyramid structure. Propelled by a feedforward convolutional neural network, the SSD network enhances the algorithm’s detection prowess by embracing multi-scale detection. In tandem, the incorporation of 4–6 default boxes, each with distinct proportions, into the feature layers of varying scales substantially bolsters the detection efficacy across objects spanning diverse scales.
In contrast to the AlexNet architecture, the accuracy of squeezenet experiences a minor reduction, albeit accompanied by a substantially diminished parameter count in comparison to that of AlexNet. To curtail the parameter load within squeezenet, three distinct strategies are implemented:
(1) Substituting the 1 × 1 convolution kernel for the 3 × 3 convolution kernel. While the 3 × 3 convolution kernel yields enhanced feature extraction outcomes from the network, squeezenet employs a 1 × 1 convolution kernel as a replacement. This strategic shift is aimed at reducing the model’s parameter count while maintaining the integrity of feature extraction.
(2) Minimizing Input Channel Count. To maintain parameter efficiency, the squeezenet architecture takes measures to decrease the number of 3 × 3 convolution kernels, as well as diminishes the input channel count associated with these 3 × 3 convolution kernels.
(3) Delaying the Pooling Process. The pooling operation plays a crucial role in shaping the ultimate performance of the network. By deferring and minimizing the pooling operation, it becomes possible to cultivate a more expansive feature map within the initial convolution layer of the network. Under equivalent circumstances, a larger feature map is poised to yield enhanced detection outcomes.
2.2.2 Fire module and bypass connection
The pivotal component within squeezenet architecture is undoubtedly the fire module. This structural element predominantly consists of two distinct convolutional layers: the squeeze layer and the expand layer, as visually depicted in Figure 3. The Squeeze layer essentially operates as a convolutional layer comprising multiple 1 × 1 convolution kernels. Conversely, the expand layer serves as a convolutional layer that amalgamates an equivalent quantity of 1 × 1 and 3 × 3 convolution kernels. The fire module encapsulates the initial pair of design strategies inherent to squeezenet. Integration of this module significantly contributes to the substantial reduction of model parameters.
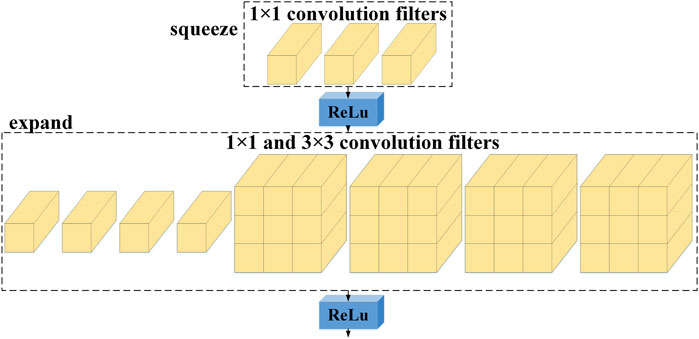
FIGURE 3. Fire module structure.
In Andola et al. (2016), for the purpose of enhancing the model’s precision, additional structures with different bypasses are explored by referring to the residual network (He et al, 2016b):
(1) Some fire modules have simple bypass connections.
(2) In the first case, complex bypass connections are connected to other fire modules.
In Andola et al. (2016), only squeezenet1_0 is discussed, but not squeezenet1_1. Three variants of squeezenet1_0 are shown in Figure 4.

FIGURE 4. Three kinds of squeezenet1_0 network structure diagram. On the left: squeezenet; In the center: squeezenet featuring a straightforward bypass; On the right: squeezenet incorporating an intricate bypass configuration.
Squeezenet1_1 is further compressed on the basis of 1_0 to achieve further reduction of parameters by advancing the maximum pooling layer. Within this manuscript, with the focus directed toward detecting a range of electrical apparatus, a comprehensive experimentation was conducted for the inaugural instance, delving into the assessment of diverse configurations of the squeezenet network on the efficacy of detection. This endeavor sought to ascertain the most suitable lithe, real-time detection model. As revealed by the empirical findings presented herein, the foundational framework of the model put forth within this composition was formulated by drawing inspiration from the structural attributes of squeezenet1_0, featuring intricate by-pass pathways.
2.2.3 Object detection configuration and optimization
To facilitate the detection of objects displaying varying proportions, the method of feature pyramid multi-scale detection is embraced. The corresponding anchor sizes are established based on the receptive field dimensions of each layer. Varied quantities of default boxes are generated on the feature layers of distinct scales. Within these layers, the prior boxes affiliated with each feature unit, present within each feature diagram, necessitate computation of scores for C categories along with 4 positional offsets relative to the original default box. Within every feature unit on the feature map, a total of (C + 4) × k prior boxes are formulated. When considering feature maps of dimensions m × n, the outcome yields m × n × (C + 4) × k a priori boxes. This process yields an extensive assemblage of prior boxes, which, due to their redundancy, augments computational overhead and diminishes computational efficiency. Consequently, the employment of non-maximum suppression is adopted to address the processing of detection outcomes.
Within the framework of this study, the formula for calculating the default box pertaining to each feature map is depicted as follows:
Herein, sk denotes the ratio assigned to the default box within the kth-level feature map; smin corresponds to the proportion attributed to the default box within the lowest-level feature map, while smax pertains to the proportion assigned to the default box within the highest-level feature map. These values are preconfigured as 0.2 and 0.9, respectively. The parameter m signifies the quantity of feature maps encompassed in this manuscript. Furthermore, the default aspect ratio of the default box for each feature map layer is represented as aγ and takes on values within the interval (⅓, ½, 1, 2, 3).
During the detection process, each factual box present within the feature map undergoes alignment with a corresponding default box, thereby eliminating excessive redundancy associated with default boxes. In scenarios where a default box aligns with any factual box, the default box boasting the most substantial intersection ratio is classified as a positive instance. Furthermore, if a default box aligns with any factual box and the intersection ratio surpasses 0.5, it also gains classification as a positive example. Given that a considerable majority of the generated default boxes are categorized as negative samples, with their quantity notably exceeding that of the selected positive samples, a course of action is warranted. To achieve this, the default boxes linked with negative samples are arranged in descending order based on their confidence scores. Subsequently, the default box possessing the highest confidence score is elected as the negative sample. This approach is instrumental in maintaining a balanced ratio between positive and negative samples, specifically at a 1:3 proportion.
Amidst the training phase, varying-scale prior boxes are acquired across distinct layers of feature maps. Subsequently, computations are conducted to derive the localization loss and the confidence loss. The overarching objective loss function aggregates these losses, being a weighted amalgamation of the localization and confidence losses. The expression for the calculation is depicted as follows:
among them m value 0 or 1 indicates the prior box whether matches the ground truth box; n is confidence of the categories; the actual information of the prediction box is represented by o; the actual information of the ground truth box is represented by p; Q is represented amount of the matched default boxes; Lossconf is represented the confidence loss, Lossloc is represented the localization loss, x is represented the weight of them, we set x as 1 in the experimental process. The localization loss encompasses a Smooth L1 loss (36) applied to the estimated box (o) and the actual ground truth box (p) parameters. As for the confidence loss, it entails the softmax loss associated with the confidence values across a spectrum of classes.
3 Experiment and analysis
To verify the effectiveness of the method in this paper, the PASCAL VOC 2007 benchmark dataset and an infrared image dataset centered on substation electrical equipment are used to evaluate the model, analyze and compare the experimental results.
3.1 Experimental description
For the purpose of assessing the proposed model’s performance, all experiments were conducted using a PC running Ubuntu 16.04LTS, equipped with 64 GB of memory, CPU (Intel Xeon W-2145 3.70 GHz × 8) and two GPUs (NVIDIA Geforce RTX 2080ti with 11 GB memory size). Within this study, the dimensions of the input image utilized for experimentation encompass 300 × 300 pixels. Each batch is comprised of 16 images. An initial learning rate of 0.001 is designated, complemented by a momentum value of 0.9. Additionally, a weight decay factor of 0.0005 is applied. The optimization scheme employed for refining the model involves the utilization of the stochastic gradient descent algorithm.
The experimental datasets featured in this study encompass the PASCAL VOC 2007 benchmark dataset and an infrared image dataset centered on substation electrical equipment. All images employed in these experiments adhere to the RGB format. Notably, the infrared image dataset concerning electrical equipment originates from the State Grid Corporation of China. Specifically, the Pascal VOC 2007 benchmark dataset encompasses a spectrum of 20 distinct categories. Within this dataset, the training subset includes 5,011 images, while the testing subset comprises 4,952 images. The infrared image dataset of electrical equipment contains 5 categories of electrical equipment, which is surge arrester, circuit breaker, isolating switch, instrument trans-former and insulator. The number of infrared images of these electrical equipment is 412, 456, 1,421, 1,355, and 2,100 respectively, and some infrared images with multiple objects. The acquired dataset of infrared images for electrical equipment is partitioned into two distinct categories. Within this division, a specific proportion is designated for utilization as training samples to facilitate model construction, while the remaining subset is allocated for employment as testing samples. It is a well-known fact that the ratio assigned to training sets significantly impacts the learning process and consequently influences the outcomes of the model. Hence, the present study delves into an examination of how distinct ratios of training samples influence the experimental outcomes within the experimental process. The overarching goal is to discern the most suitable allocation proportion. For visual context, refer to Figure 5, which portrays a collection of infrared images comprising various forms of electrical equipment.
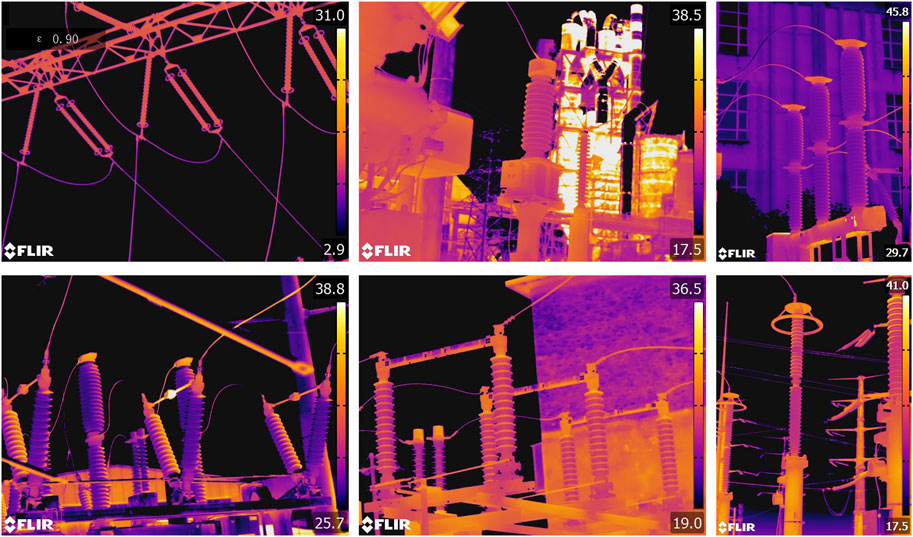
FIGURE 5. Some images of the dataset.
Addressing the challenge of training instability stemming from fluctuations in loss during the training phase, this study adopts a strategy akin to the “warm-up” approach described in Andola et al. (2016). This technique entails commencing with a modest, incremental learning rate during the initial 5 stages. Subsequently, following the “warm-up” stage, the learning rate reverts to a conventional learning strategy. Additionally, the experiment in this paper employs the strategy of random weight initialization for the model. This decision is made to comprehensively assess the model’s performance.
3.2 Evaluation metrics
Within this paper, the evaluation indices employed to assess the model encompass the time taken for detecting a singular image, the mean average precision (mAP), and the dimensions of the model itself. These metrics serve as benchmarks for dissecting the experimental findings and facilitating a comprehensive model comparison. During the computation of average precision (AP) and mean average precision (mAP), the predefined intersection over union (IOU) threshold defaults to 0.5. Here, mAP represents the arithmetic mean of the AP values amassed across all categories. The AP value is calculated by determining the area enclosed by the precision-recall (P-R) curve. The subsequent methodology for computing AP, precision rate, and recall rate is illustrated as follows:
the precision rate p signifies the ratio of accurately identified cases, whereas the recall rate r indicates the proportion of correctly detected actual instances. Within the set of variables, TP represents the number of cases accurately identified, FP corresponds to instances incorrectly categorized as positive, and FN denotes the count of true instances wrongly labeled as false negatives, reflecting the quantity of misclassified objects.
3.3 Outcomes from the PASCAL VOC 2007 experimentation
Due to the potential impact of the quantity of training iterations on the outcomes of the model’s detection capabilities, this study investigates the effect of varying training iterations on the training results of the model through empirical investigations. This exploration aims to determine an optimal number of training iterations for conducting experiments involving infrared imagery of electrical apparatus. In this study, to validate the most efficient lightweight model, the lightweight models with different structures proposed in this paper will be compared with SSD, Mobile-ssd, Squeeze-ssd and Tiny-yolov3. Figure 6 displays the outcomes obtained from distinct models across varying training iterations. Among them, Sq1_0 and Sq1_1 represent improved models based on squeezenet1_0 and squeezenet1_1 as the backbone of the network, respectively, and a, b and c respectively represent the improved models with no bypass, simple by pass and complex bypass.
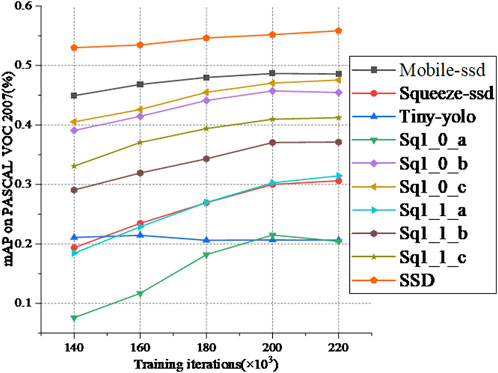
FIGURE 6. Contrasting the results derived from distinct training iterations across various models on the PASCAL VOC 2007 benchmark dataset.
Observing the data presented in Figure 6, it becomes evident that the detection accuracy of distinct models demonstrates a general inclination towards improvement as the number of iterations increases. Notably, among these, Mobile-SSD, SSD, and Sq1_0_c models stand out for their superior detection outcomes. However, it’s worth noting that an escalation in the number of iterations corresponds to a substantial rise in the duration of the training process. As a result of a comprehensive deliberation, a pragmatic decision is made, leading to the selection of 20,000 iterations as the optimal count for experimental training iterations dedicated to infrared images of electrical equipment.
Table 2 presents a comparative analysis of detection time and model dimensions among various models, performed on the PASCAL VOC 2007 benchmark dataset. Additionally, Table 3 provides an intricate breakdown of the comprehensive experimental outcomes yielded by diverse models when subjected to 200 k iterations on the PASCAL VOC 2007 benchmark dataset. The findings from Figure 6 and Tables 2, 3 collectively demonstrate that while the detection precision of Sq1_0_c is lesser com-pared to SSD, its model dimensions are nearly a quarter of SSD’s, and its detection velocity is enhanced by a factor of 4.4 in comparison to SSD. The detection accuracy of Sq1_0_c is slightly less than that of Mobile-ssd, but the model size of Sq1_0_c is 1.5 times smaller than that of Mobile-ssd, and the speed is faster than that of Mobile-ssd. Even though the detection duration for Sq1_0_c is marginally extended compared to Tiny-yolo, its model proportions are diminished in contrast to Tiny-yolo. Moreover, the detection precision significantly surpasses that of Tiny-yolo. Compared with the other models, Sq1_0_c has higher detection accuracy than the others, although the model size and detection time is slightly increased. Among them, method ①∼⑩ respectively represent the top-down models in Figure 6.
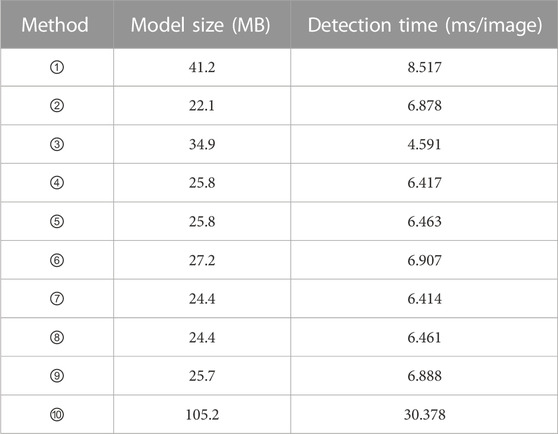
TABLE 2. Detection time and model size of various models on the PASCAL VOC 2007 benchmark dataset.
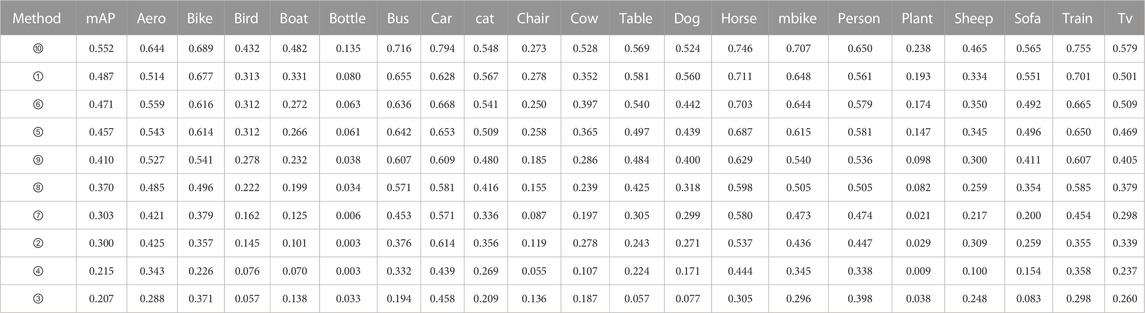
TABLE 3. The results of PASCAL VOC 2007 benchmark dataset (IOU = 0.5, training iterations = 200 k).
3.4 Results on infrared images of electrical equipment
In this portion, an investigation is undertaken using a dataset comprising infrared images of electrical equipment within substations. The focus of this phase involves a comparative analysis between the enhanced lightweight models and alternative model counterparts. Insights drawn from Tables 2, 3 reveal a parity in model sizes between models 4 and 5, yet it’s evident that the detection accuracy of model 4 markedly lags behind that of model 5. To optimize resource allocation, both in terms of experimental time and costs, the evaluation of Model 4 is omitted concerning the infrared dataset for electrical equipment. In a similar vein, the assessment of Model 7 is likewise omitted.
As the volume of data increases, the model’s performance is expected to improve, with the proportion of training samples playing a pivotal role in the model’s learning process. Notably, the dataset employed in this study is sourced from the State Grid Corporation of China and differs from the division structure of the Pascal VOC 2007 benchmark dataset. To forestall any inadvertent influence of training set composition on experimental outcomes and consequent interpretation of model efficacy, a strategy is employed wherein various proportions (ranging from 0.3 to 0.9 in intervals of 0.1) of training samples are selected. Employing uniform experimental protocols, this approach is used to assess the impact of varying sample quantities on the results. In order to mitigate the potential instability of both training and testing sets, the dataset for this experiment is subject to randomized selection. For instance, a ratio of 0.8 is utilized for the training set.
Initially, a random selection process is employed, where 80% of the available infrared images for a specific category of electrical equipment are chosen as the training set for that equipment type. The residual 20% of images are designated as the corresponding testing set. Subsequently, this process is replicated across various equipment categories, culminating in the establishment of a comprehensive 0.8 scale training set through amalgamating the diverse training and testing sets. This overarching dataset encompasses multiple infrared images encompassing various types of electrical equipment objects.
Depicted in Figure 7 is a comparative analysis of detection outcomes among diverse models across varying training set proportions. As observed in Figure 7, a discernible trend emerges wherein model detection efficacy escalates in tandem with the expansion of the training set. Notably, beyond a training set proportion of 0.3, Mobile-SSD, SSD, and Sq1_0_c consistently exhibit superior detection outcomes. Table 4 shows the detection time and model size of different models on the infrared image dataset of electrical equipment. Presented in Table 5 are the comprehensive outcomes derived from experiments involving various models on the infrared image dataset related to electrical equipment, with a training set ratio of 0.8. The observations drawn from Figure 7 and Tables 4, 5 collectively underscore that the model dimensions of Sq1_0_c are approximately one-fifth the size of SSD’s, accompanied by a detection speed that is expedited by a factor of 3.8 in comparison to SSD. Despite exhibiting a lower accuracy than SSD, it still attains a commendable detection precision of 87.82% through the implementation of the model weight random initialization strategy. Sq1_0_c features a model size approximately 1.6 times leaner than Mobile-SSD, accompanied by an enhanced detection speed. Moreover, Sq1_0_c boasts a detection accuracy surpassing that of Mobile-SSD. In contrast to alternative models, Sq1_0_c attains experimental outcomes akin to those witnessed in the context of the PASCAL VOC 2007 benchmark dataset. Therefore, a comprehensive evaluation positions Sq1_0_c as the most optimal performer.
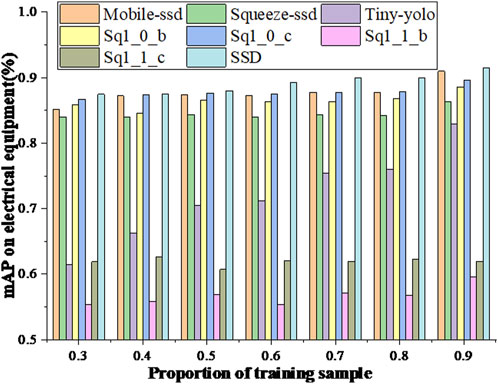
FIGURE 7. Comparison of the detection results on the training set of different proportions of the infrared images of electrical equipment.
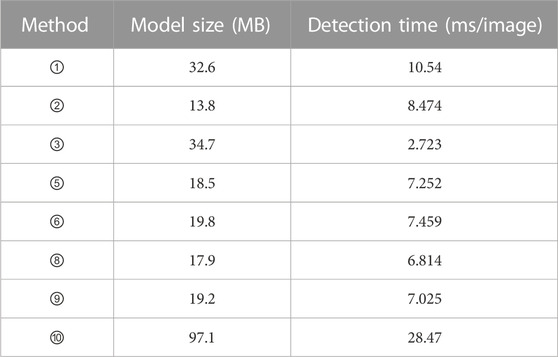
TABLE 4. Detection time and model size of different models.
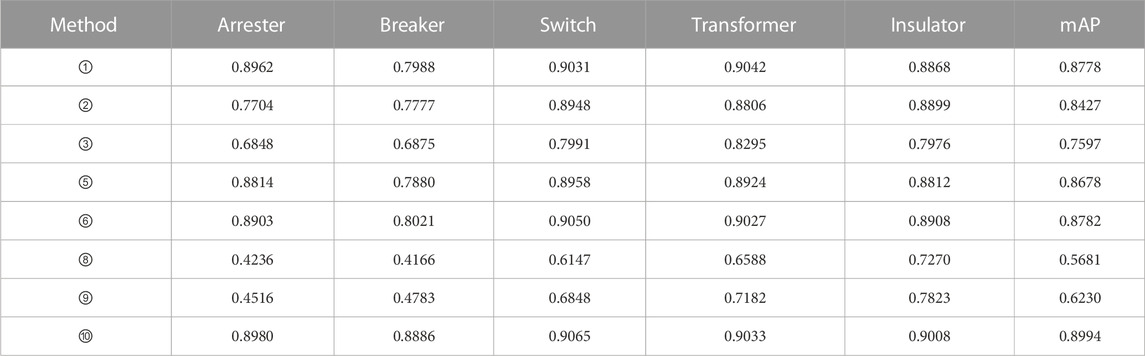
TABLE 5. Comparison of different models.
Given the need to impartially assess the model’s performance through the testing set, it becomes imperative to deliberate on the adequacy of the testing set’s proportion. Ensuring comprehensive generalization and representative evaluation is challenging when the testing set is inadequately sized. To this end, a judicious decision is made to adopt a final ratio of 0.8, ensuring a balanced compromise.
To demonstrate the advantages of the proposed method, comparisons with the latest SSD variants are also conducted, as shown in Table 6. These results are obtained under the optimal dataset allocation ratios. It can be observed that the proposed method achieves the fastest detection speed and the smallest memory footprint, with detection accuracy only slightly lower than that of the FSSD model.
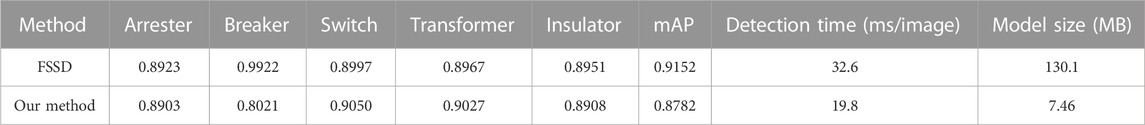
TABLE 6. Comparison with other methods.
Figure 8 shows the detection effect of Sq1_0_c on some infrared images of electrical equipment. The anticipatory results associated with surge arresters, circuit breakers, isolating switches, instrument transformers, and insulators respectively correspond to the white, cyan, yellow, green, and red bounding boxes delineated within the illustration. The bounding box denotes the location of the object which the model located, and the value that is above this bounding box is the confidence of the model’s prediction category. By conducting an in-depth analysis of the experiment, this study identifies the optimal lightweight model. This model not only showcases enhanced performance but also demonstrates precision in accurately pinpointing the location of equipment objects within infrared images.
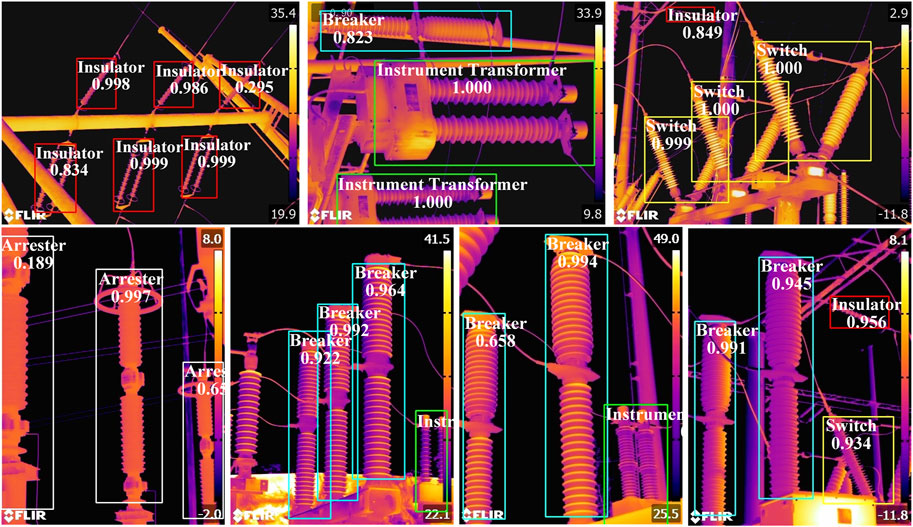
FIGURE 8. Detection results of some infrared images of electrical equipment based on Sq1_0_c.
4 Discussion
We have successfully developed a lightweight model that exhibits substantial improvements in model size and detection speed compared to traditional SSD and other lightweight models like Mobile-SSD and Tiny-yolov3. This achievement underscores the efficiency of the proposed approach, which can be advantageous in resource-constrained environments. This study demonstrates a careful balance between model accuracy and detection speed. While the optimal lightweight model may not match the accuracy of SSD, it still maintains a high level of detection accuracy, making it suitable for applications where real-time processing is critical. Due to its compact model size, the proposed lightweight model can operate efficiently on hardware with limited computational resources. This makes it suitable for deployment on edge devices, drones, and other platforms where computational power is restricted. The slightly increased cost of the optimal model compared to other improved models is offset by its superior detection accuracy and smaller model size compared to SSD. This cost-efficiency is important for practical applications where budget constraints may be a concern. The lightweight and efficient model developed in this study has direct applications in scenarios where computational resources are limited, such as autonomous drones, IoT devices, and embedded systems. Real-time object detection is crucial in security and surveillance applications. The improved lightweight model can be deployed in security cameras and surveillance systems for enhanced object recognition and tracking. In industrial settings, where real-time detection of objects or anomalies is essential, the lightweight model can be used in robots, automated quality control systems, and equipment monitoring within substations, as demonstrated in this study. Lightweight models with high-speed detection capabilities can be deployed in intelligent transportation systems for traffic monitoring, pedestrian detection, and vehicle counting. The lightweight model’s ability to process images efficiently can be leveraged for environmental monitoring applications, such as wildlife conservation, where quick and accurate detection is crucial.
Considering the promising results obtained in the physical detection of electrical components within substations, we propose a future research direction that extends the application of the approach of this study to off-grid and autonomous load scenarios, particularly in the field of power quality analysis. This direction aims to harness the capabilities of our lightweight and efficient model for the identification and monitoring of critical power parameters in off-grid and autonomous power generation systems (Krishna et al., 2023; Krishna et al., 2022).
5 Conclusion
In this paper, detailed experiment and discussions on the effects of various squeezenet structures on the detection efficacy of SSD model were carried for the first time, and an improved lightweight model was proposed. The model improved the feature extraction ability and model fitting ability by adding multiple different connection branches and convolutional layers, so as to make up for the impact of light-weight model on the detection accuracy. According to the experimental results: 1) Concerning the PASCAL VOC 2007 benchmark dataset, despite the optimal light-weight model exhibiting a detection accuracy lower than that of SSD, it boasts a model size approximately one-fourth that of SSD and a detection speed accelerated by a factor of 4.4 compared to SSD. The precision of the optimal model was marginally lower than that of Mobile-ssd, however, its model dimensions were nearly 1.5 times more compact than those of Mobile-ssd, and its detection speed surpassed that of Mobile-ssd. The model size of the optimal model was smaller than that of Tiny-yolov3, although the detection time of the optimal model was slightly longer than that of Tiny-yolov3, the detection accuracy was much greater than Tiny-yolov3; 2) The identical experimental procedure was conducted on the infrared image dataset related to electrical equipment within a substation. The outcomes of these experiments revealed that the model size of the optimal lightweight model was nearly 5 times less than that of SSD, and the detection speed demonstrated a 3.8-fold improvement over SSD. Although the accuracy was lower than SSD, it still achieves a high detection accuracy of 87.82%. The model size of the optimal model was nearly 1.6 times smaller than that of Mobile-SSD, the detection speed was also improved, and the detection accuracy was higher than that of Mobile-SSD. Compared with other models, the conclusion was consistent with the experimental results on PASCAL VOC 2007 benchmark dataset. Although the model size and detection time of the optimal model were slightly increased compared with other improved models, the detection accuracy was the highest, and the model size was very small compared with SSD, so the slightly increased cost of the optimal model compared with the other improved models could be ignored.
Although this study has a good detection effect while meeting the requirements of lightweight and real-time detection, there are still some limitations. As an illustration, during the pursuit of achieving a lightweight design, it is possible to enhance the model’s detection accuracy while still upholding its lightweight attributes. As a result, our focus in future research must address subsequent tasks aimed at further optimizing the model.
Data availability statement
The raw data supporting the conclusion of this article will be made available by the authors, without undue reservation.
Author contributions
CQ: Writing–original draft. ZC: Writing–original draft. XC: Writing–original draft. YB: Writing–original draft. TH: Writing–original draft. SH: Writing–review and editing. JL: Writing–review and editing. YL: Writing–review and editing. FT: Writing–review and editing. ML: Writing–review and editing.
Funding
The author(s) declare financial support was received for the research, authorship, and/or publication of this article. This endeavor received partial support from the National Natural Science Foundation of China, with Grants 52277139 and 51907034, as well as backing from the Specific Research Project of Guangxi for Research Bases and Talents, with Grant 2020AC19010.
Conflict of interest
Authors CQ, ZC, XC, YB, TH, FT, and ML were employed by State Grid Zhengzhou Power Supply Company of Henan Electric Power Company.
The remaining authors declare that the research was conducted in the absence of any commercial or financial relationships that could be construed as a potential conflict of interest.
Publisher’s note
All claims expressed in this article are solely those of the authors and do not necessarily represent those of their affiliated organizations, or those of the publisher, the editors and the reviewers. Any product that may be evaluated in this article, or claim that may be made by its manufacturer, is not guaranteed or endorsed by the publisher.
References
Andola, F. N., Han, S., Moskewicz, M. W., Ashraf, K., Dally, W. J., and Keutzer, K. (2016). SqueezeNet: alexnet-level accuracy with 50x fewer parameters and< 0.5 MB model size. https://arxiv.org/abs/1602.07360.
Girshick, R. ,2015 “Fast r-cnn,” in Proceedings of the IEEE international conference on computer vision, Santiago, Chile, December 2015, 1440–1448. doi:10.1109/ICCV.2015.169
He, H. Y., Lee, W., Luo, D. S., and Cao, Y. J. (2017). Insulator infrared image denoising method based on wavelet generic gaussian distribution and map estimation. IEEE Trans. Ind. Appl. 53, 3279–3284. doi:10.1109/TIA.2017.2691309
He, K. M., Gkioxari, G., Dollar, P., and Girshick, R. (2020). Mask r-cnn. IEEE Trans. Pattern Anal. Mach. Intell. 42, 386–397. doi:10.1109/TPAMI.2018.2844175
He, K. M., Zhang, X. Y., Ren, S. Q., and Sun, J. ,2016a “Deep residual learning for image recognition,” in Proceedings of the IEEE conference on computer vision and pattern recognition, Las Vegas, NV, USA, June 2016, 770–778. doi:10.1109/CVPR.2016.90
He, K. M., Zhang, X. Y., Ren, S. Q., and Sun, J. (2015). Spatial pyramid pooling in deep convolutional networks for visual recognition. IEEE Trans. Pattern Anal. Mach. Intell. 37, 1904–1916. doi:10.1109/TPAMI.2015.2389824
He, K., Zhang, X., Ren, S., and Sun, J. ,2016b “Deep residual learning for image recognition,” in Proceedings of the IEEE conference on computer vision and pattern recognition, Las Vegas, NV, USA, June 2016, 770–778.
Jadin, M. S., Taib, S., and Ghazali, K. H. (2015). Finding region of interest in the infrared image of electrical installation. Infrared Phys. Technol. 71, 329–338. doi:10.1016/j.infrared.2015.05.010
Kang, G. Q., Gao, S. B., Yu, L., and Zhang, D. K. (2019). Deep architecture for high-speed railway insulator surface defect detection: denoising autoencoder with multitask learning. IEEE Trans. Instrum. Meas. 68, 2679–2690. doi:10.1109/TIM.2018.2868490
Khan, A., Sohail, A., Zahoora, U., and Qureshi, A. S. (2020). A survey of the recent architectures of deep convolutional neural networks. Artif. Intell. Rev. 53 (8), 5455–5516. doi:10.1007/s10462-020-09825-6
Krishna, V. B. M., Sandeep, V., Narendra, B. K., and Prasad, K. R. K. V. (2023). Experimental study on self-excited induction generator for small-scale isolated rural electricity applications. Results Eng. 18, 101182. doi:10.1016/j.rineng.2023.101182
Krishna, V. B. M., Sandeep, V., Murthy, S. S., and Yadlapati, K. (2022). Experimental investigation on performance comparison of self-excited induction generator and permanent magnet synchronous generator for small-scale renewable energy applications. Renew. Energy 195, 431–441. doi:10.1016/j.renene.2022.06.051
Krizhevsky, A., Sutskever, I., and Hinton, G. E. (2012). Imagenet classification with deep convolutional neural networks. Adv. neural Inf. Process. Syst. 25. doi:10.1145/3065386
Lan, S., Chen, M., and Chen, D. (2019). A novel HVDC double-terminal non-synchronous fault location method based on convolutional neural network. IEEE Trans. Power Deliv. 34, 848–857. doi:10.1109/TPWRD.2019.2901594
Law, H., and Deng, J. ,2018 “CornerNet: detecting objects as paired keypoints,” in Proceedings of the European Conference on Computer Vision, Munich, Germany, September 2018, 642–656. doi:10.1007/s11263-019-01204-1
Lecun, Y., Bengio, Y., and Hinton, G. E. (2015). Deep learning. Nature 521, 436–444. doi:10.1038/nature14539
Li, X., Wang, H. H., Yang, A. J., and Rong, M. Z. (2019). Partial discharge source localization in gis based on image edge detection and support vector machine. IEEE Trans. Power Deliv. 34, 1795–1802. doi:10.1109/TPWRD.2019.2925034
Li, Z. X., and Zhou, F. Q. (2017). FSSD: feature fusion single shot multibox detector. https://arxiv.org/abs/1712.00960.
Liu, W., Anguelov, D., Erhan, D., Szegedy, C., Reed, S., Fu, C. Y., et al. ,2016 “SSD: single shot multibox detector,” in Proceedings of the European Conference on Computer Vision, Amsterdam, The Netherlands, October 2016, 21–37. doi:10.1007/978-3-319-46448-0_2
Liu, Y. P., Ji, X. X., Pei, S. T., Ma, Z., Zhang, G. H., Lin, Y., et al. (2020). Research on automatic location and recognition of insula-tors in substation based on yolov3. High. Volt. 5, 62–68. doi:10.1049/hve.2019.0091
Lu, S. Y., Zhang, Y., and Su, J. J. (2017). Mobile robot for power substation inspection: a survey. IEEE/CAA J. Automatica Sinica 4, 830–847. doi:10.1109/JAS.2017.7510364
Ma, J. C., Zheng, H. B., Sun, Y. H., Zhang, Z., Wang, X. H., Ding, G. J., et al. (2021). Temperature compensation method for infrared detection of live equipment under the interferences of wind speed and ambient temperature. IEEE Trans. Instrum. Meas. 70, 1–9. doi:10.1109/TIM.2021.3052003
Mei, H. W., Jiang, H. Y., Yin, F. H., Li, L. X., and Wang, L. M. (2020). Detection of small defects in composite insulators using terahertz technique and deconvolution method. IEEE Trans. Instrum. Meas. 69, 8146–8155. doi:10.1109/TIM.2020.2987407
Menendez, O., Cheein, F. A. A., Perez, M., and Kouro, S. (2017). Robotics in power systems: enabling a more reliable and safe grid. IEEE Ind. Electron. Mag. 11, 22–34. doi:10.1109/MIE.2017.2686458
Miao, X. R., Liu, X. Y., Chen, J., Zhuang, S. B., Fan, J. W., and Jiang, H. (2019). Insulator detection in aerial images for transmission line inspection using single shot multibox detector. IEEE Access 7, 9945–9956. doi:10.1109/ACCESS.2019.2891123
Osornio-Rios, R. A., Antonino-Daviu, J. A., and Romero-Troncoso, R. D. J. (2019). Recent industrial applications of infrared thermography: a review. IEEE Trans. Ind. Inf. 15, 615–625. doi:10.1109/TII.2018.2884738
Peng, X. S., Yang, F., Wang, G. J., Wu, Y. J., Li, L., Li, Z. H., et al. (2019). A convolutional neural network-based deep learning methodology for recognition of partial discharge patterns from high-voltage cables. IEEE Trans. Power Deliv. 34, 1460–1469. doi:10.1109/TPWRD.2019.2906086
Reddy, M. J. B., and Mohanta, D. K. (2013). Condition monitoring of 11 kV distribution system insulators incorporating complex imagery using combined DOST-SVM approach. IEEE Trans. Dielectr. Electr. Insul. 20, 664–674. doi:10.1109/TDEI.2013.6508770
Redmon, J., Divvala, S. K., Girshick, R., and Farhadi, A. ,2016 “You only look once: unified, real-time object detection,” in Proceedings of the IEEE Conference on Computer Vision and Pattern Recognition, Las Vegas, NV, USA, June 2016, 779–788. doi:10.1109/CVPR.2016.91
Ren, S. Q., He, K. M., Girshick, R., and Sun, J. (2017). Faster r-cnn: towards real-time object detection with region proposal networks. IEEE Trans. Pattern Anal. Mach. Intell. 39, 1137–1149. doi:10.1109/TPAMI.2016.2577031
Simonyan, K., and Zisserman, A. (2014a). Very deep convolutional networks for large-scale image recognition. https://arxiv.org/abs/1409.1556.
Simonyan, K., and Zisserman, A. (2014b). Very deep convolutional networks for large-scale image recognition. https://arxiv.org/abs/1409.1556.
Song, Y. F., Wang, H. G., and Zhang, J. W. (2018). A vision-based broken strand detection method for a power-line maintenance robot. IEEE Trans. Power Deliv. 14, 2154–2161. doi:10.1109/TPWRD.2014.2328572
Szegedy, C., Ioffe, S., Vanhoucke, V., and Alemi, A. ,2017 “Inception-v4, inception-resnet and the impact of residual connections on learning,” in Proceedings of the AAAI conference on artificial intelligence, San Francisco, California, USA, February 2017. doi:10.1609/aaai.v31i1.11231
Szegedy, C., Liu, W., Jia, Y., Sermanet, P., Reed, S., Anguelov, D., et al. ,2015 “Going deeper with convolutions,” in Proceedings of the IEEE conference on computer vision and pattern recognition, Boston, MA, USA, June 2015, 1–9.
Usamentiaga, R., Fernandez, M. A., Villan, A. F., and Carus, J. L. (2018). Temperature monitoring for electrical substations using infrared thermography: architecture for industrial internet of things. IEEE Trans. Ind. Inf. 14, 5667–5677. doi:10.1109/TII.2018.2868452
Wang, B., Dong, M., Ren, M., Wu, Z. Y., Guo, C. X., Zhuang, T. X., et al. (2020). Automatic fault diagnosis of infrared insulator images based on image instance segmentation and temperature analysis. IEEE Trans. Instrum. Meas. 69, 5345–5355. doi:10.1109/TIM.2020.2965635
Wu, Q. C., and An, J. B. (2014). An active contour model based on texture distribution for extracting inhomogeneous insulators from aerial images. IEEE Trans. Geosci. Remote Sens. 52, 3613–3626. doi:10.1109/TGRS.2013.2274101
Wu, Q. G., An, J. B., and Lin, B. (2012). A texture segmentation algorithm based on pca and global minimization active contour model for aerial insulator images. IEEE J. Sel. Top. Appl. Earth Obs. Remote Sens. 5, 1509–1518. doi:10.1109/JSTARS.2012.2197672
Xi, L., Yu, L., Xu, Y., Wang, S., and Chen, X. (2020). A novel multi-agent DDQN-AD method-based distributed strategy for automatic generation control of integrated energy systems. IEEE Trans. Sustain. Energy 11, 2417–2426. doi:10.1109/TSTE.2019.2958361
Zhao, Z. B., Fan, X. Q., Xu, G. Z., Zhang, L., Qi, Y. C., and Zhang, K. (2017). Aggregating deep convolutional feature maps for insulator detection in infrared images. IEEE Access 5, 21831–21839. doi:10.1109/ACCESS.2017.2757030
Zhao, Z. B., Xu, G. Z., and Qi, Y. C. (2016). Representation of binary feature pooling for detection of insulator strings in infrared images. IEEE Trans. Dielectr. Electr. Insul. 23, 2858–2866. doi:10.1109/tdei.2016.7736846
Zheng, H. B., Sun, Y. H., Liu, X. H., Djike, C. L. T., Li, J. H., Liu, Y., et al. (2020). Infrared image detection of sub-station insulators using an improved fusion single shot multibox detector. IEEE Trans. Power Deliv. 36, 3351–3359. doi:10.1109/TPWRD.2020.3038880
Keywords: infrared image, single shot multibox detector (SSD), lightweight model, electrical equipment, real-time detection, object detection
Citation: Qi C, Chen Z, Chen X, Bao Y, He T, Hu S, Li J, Liang Y, Tian F and Li M (2023) Efficient real-time detection of electrical equipment images using a lightweight detector model. Front. Energy Res. 11:1291382. doi: 10.3389/fenrg.2023.1291382
Received: 09 September 2023; Accepted: 28 September 2023;
Published: 10 October 2023.
Edited by:
Praveen Kumar Donta, Vienna University of Technology, AustriaReviewed by:
V. B. Murali Krishna, National Institute of Technology, Andhra Pradesh, IndiaKenneth E. Okedu, Melbourne Institute of Technology, Australia
Copyright © 2023 Qi, Chen, Chen, Bao, He, Hu, Li, Liang, Tian and Li. This is an open-access article distributed under the terms of the Creative Commons Attribution License (CC BY). The use, distribution or reproduction in other forums is permitted, provided the original author(s) and the copyright owner(s) are credited and that the original publication in this journal is cited, in accordance with accepted academic practice. No use, distribution or reproduction is permitted which does not comply with these terms.
*Correspondence: Jinheng Li, amgubGlAc3QuZ3h1LmVkdS5jbg==