- Department of Computer Engineering, College of Computer and Information Sciences, King Saud University, Riyadh, Saudi Arabia
Analyzing and understanding the electricity consumption of end users, especially the anomalies (outliers), are vital for the planning, operation, and management of the power grid. It will help separate the group of users with unpredictable consumption behavior and then develop and train specialized deep learning models for power load forecasting or regular and non-regular users. The aim of the current work is to divide electricity customers into numerous groups based on anomalies in consumption behavior and major clusters. Successful separation of such groups of customers will provide us with two advantages. One is the increase in the accuracy of load forecasting of other users or groups of users due to their predictable consumption behavior. The second is the opportunity to develop and train specialized deep learning models for customers with highly unpredictable behaviors. The novelty of the work is the segregation of anomalous electricity users from normal/regular users based on outliers in their past power consumption behavior over a period of 92 days. Results indicate that almost 85 percent of the users in the selected residential community attribute one major cluster in their consumption behavior over a period of 3 months of data (92 days). It is also evident from the results that only a small proportion of customers, i.e., 10 out of 69 customers (15 percent), have either more than one cluster or attribute no cluster (zero clusters), which is highly important and indicates that these are the possible users who cause higher variations in power consumption of the residential community.
1 Introduction
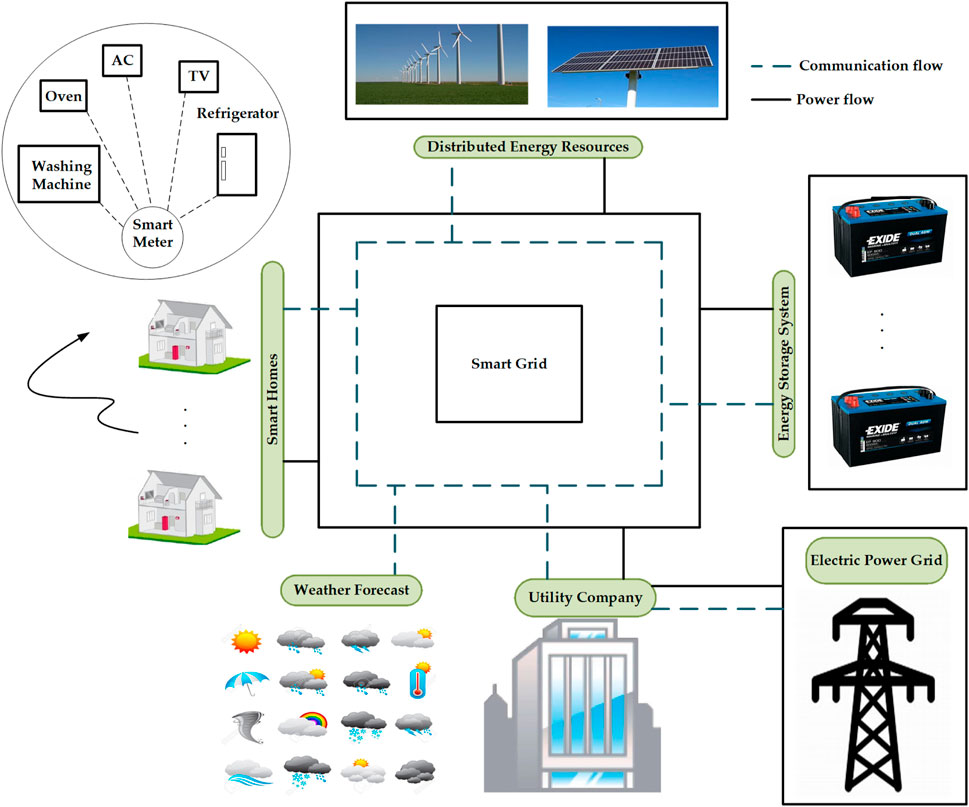
With rapid development in various research fields, including data analytics, machine/deep learning, renewable energy resources, and smart meters, traditional power grids are transforming into smart, intelligent, reliable, sustainable, and stable grids called smart grids (SGs) (Zheng et al., 2017). The framework of SG is shown in Figure 1, which includes forecasting (generation and load), distributed energy resources, smart meters, and energy storage devices.
Individual user load forecasting is more challenging than aggregate load forecasting. The various reasons for this include the high uncertainty and unpredictability in the electricity usage pattern of end individual customers, which, in turn, are dependent on varying social needs, varying weather constraints, and the lifestyle and affordability of the users (Kong et al., 2019).
The prediction of electricity consumption forecasting is vital and essential for the management, maintenance, administration, operation, and stability of SGs. Energy generation and storage have unavoidable limitations, which make it difficult to progress further. The fact that the storage capability of different energy generation sources has some limitations requires us to adapt and implement effective strategies for ensuring a fair balance between the generation and consumption of energy (Mohsenian-Rad et al., 2010; Aslam et al., 2017).
Researchers aim to design and develop improved deep/machine learning models for power generation and power load forecasting. Furthermore, the development of different enhanced approaches for monitoring power consumption through forecasting models is highly important for the management, planning, and operation of SGs. The performance monitoring metrics, including MAPE and RMSE, also have an impact on the safety and reliability of SGs (Mohsenian-Rad et al., 2010; Aslam et al., 2017; Zheng et al., 2017; Kong et al., 2019).
For better planning and management of the operations of SGs, the utility company requires efficient state-of-the-art deep learning-based forecasting models. The monitoring of electricity consumption can be improved by installing a two-way communication facility using smart meters and ICT technology between utility companies and end electricity users, as well as having state-of-the-art deep learning-based forecasting models (Lidula and Rajapakse, 2011; Niyato et al., 2011; Khalid et al., 2018; Malik and Kim, 2018).
The higher accuracy of forecasting models benefits both the electricity users and the utility company. It enables the end electricity customers to monitor and gauge their daily electricity consumption by shifting the operation of flexible appliances to off-peak time. The enhanced deep/machine learning models enable customers to monitor and adjust electricity usage, which, in turn, helps them reduce their electricity costs. The overall impact is the creation of an ideal environment for electricity users, where they can keep track of electricity consumption and adjust it when needed, which results in the reduction of electricity costs. In some cases, monitoring and adjustment can even benefit the end user by trading the excess energy generated from renewable energy resources (Khalid et al., 2018).
Customers play the main role and responsibility in actively responding to the needs of the utility company, which is always required to ensure a reliable and stable SG. Electricity customers can be divided into three big sectors, i.e., industrial, residential, and commercial. Residential customers consume a significantly higher proportion of the overall generated electricity. In the residential sector, smart meters play a vital role in the monitoring and projection of the short-term power load of end electricity customers (Massana et al., 2015). The statistical analysis presented by Malik and Kim (2018) indicates that electricity consumed in commercial buildings and residential areas, industries, public areas, and transportation in South Korea is 38 percent, 55 percent, 6 percent, and 1 percent of the total energy consumption, respectively. The result of this analysis is presented in Figure 2.
In the literature review, we discovered an efficient individual-level power load forecasting approach (Kong et al., 2019). However, the main problem with this approach is the requirement of a deep learning model for each and every single user of the residential community, which is practically not feasible. On the other hand, some researchers developed deep learning models for forecasting aggregate power load at a community level, which is not effective due to the higher variation in the consumption level and cannot help in mitigating peak creation. So, there is a need for monitoring the power load of the smart community at an individual level, which will assist in shifting the appliance usage to off-peak time for mitigating the peak creation and reducing the electricity cost of the end user. Ultimately, it will help in enhancing the stability of the power grid.
In a residential society, there are customers with different power consumption requirements. Power consumption is dependent on various factors, including social status, lifestyle, and affordability, in addition to time of the day, day of the week, weather, and seasons. In the current work, the aim is to analyze and understand the electricity consumption behavior of electricity customers. The focus is to identify the group of customers attributing anomalies in their consumption behavior. It will help in separating those electricity users whose power requirement abruptly changes at any time and does not have any predictable pattern. This has a negative impact on the planning, operation, management, and stability of the power grid.
Identifying and separating the predictable and unpredictable electricity customers in a residential society could be carried out by analyzing the historical power consumption record of all the users in the residential community. The DBSCAN-based clustering approach is selected for this purpose, which can effectively group the usage pattern into various major/minor clusters and identify the anomalies in consumption behavior without having the cluster’s information apriori. For the analysis, we have used the historical power load data collected during the Smart Grid Smart City (SGSC) project of the Australian Government.
By applying DBSCAN-based profiling on the historical consumption data on the smart residential community, electricity users will be divided into two groups, i.e., predictable and unpredictable. Then, separate deep learning models will be developed and trained on the historical electricity consumption data on the predictable and unpredictable (attributing higher anomalies) groups of electricity users. The power load of the individual electricity user can then be effectively predicted with higher accuracy using the trained model of their groups. Such an analysis is essential and will assist the utility company in maintaining a reliable and stable grid in addition to helping the users adjust their power load to reduce the electricity cost.
The focus of previous explorations has been on enhancing the accuracy of the developed models for accuracy related to the accumulated consumption of users in a cluster or a residential community. The accumulated energy consumption does not show the trend of energy usage of individual users, which misses the anomalous behavior of a few unpredictable users. The anomalous energy users are a few, but their unpredictable behavior leads to instability and higher variation in the total energy demand of a residential community.
However, I am unaware of any studies for finding energy users with anomalous consumption behavior causing instability to SGs. Once such anomalous energy users are separated from other energy users in a residential community, specialized DNN models can be trained for the respective groups (regular vs. anomalous), which will be highly accurate in forecasting the energy consumption of their respective groups.
The following are the contributions.
1. A real-world power consumption database developed and maintained by the Australian Government, called Smart Grid Smart City (SGSC), is used for the analysis of anomaly detection in the electricity consumption behavior of end users.
2. For comparing the results with previous works, an already used criterion based on the usage of a specific appliance (a hot water system) is applied for separating a pool of electricity users.
3. DBSCAN-based profiling of daily power consumption is used, which is helpful in isolating the anomalies and major/minor clusters in the historical electricity consumption behavior of electricity users.
4. The group of electricity customers with highly unpredictable consumption patterns is identified based on having a higher number of outliers and attributing more than one major cluster (or zero clusters) in their daily consumption.
The organization of the paper is as follows: Section 2 provides the literature review on user-level power load forecasting. Section 3 presents the details of feature vector formation along with the detailed analysis of DBSCAN-based profiling of the historical electricity consumption of the smart community. The details of the proposed method for segregating electricity users into predictable and unpredictable groups are disclosed in Section 4. The achieved results and discussions are unfolded in Section 5. Finally, the concluding remarks are provided in Section 6.
2 Literature review
Power load forecasting is vital for the operation, sustainability, management, and long-term stability of SGs. The forecasting of electricity consumption of end users is challenging in comparison to the aggregate electricity load forecasting of a smart community. A few reasons are the unpredictable and uncertain factors, such as weather and seasons. With rapid machine and deep learning progress, electricity consumption forecasting at the individual user level is possible at a high confidence level.
However, developing and training a model for every electricity user in a smart residential community seems difficult. The power load forecasting of individual users is highly challenging in comparison to the aggregate load forecasting of the smart community. There are various reasons for this difficulty, which include volatility, unpredictability, and uncertainty at individual-level forecasting. Additionally, the uncertainty and unpredictability in power consumption of the end electricity customers are also due to their different priorities, affordability, varying social needs, and different lifestyles. Fortunately, with tremendous development in machine/deep learning, data analytics, availability of fast computing power, and availability of big data, the individual user level of power load forecasting is achievable with a higher accuracy.
Numerous researchers explored various efficient methods for user-level power load forecasting (Kong et al., 2019; Alhussein et al., 2020; Khalid et al., 2020; Aurangzeb et al., 2021). The forecasting of power generation from renewable energy resources is also equally important, which has been studied in numerous studies (Paoli et al., 2009; Martín et al., 2010; Alhussein et al., 2019).
The artificial neural network (ANN)-based deep neural network (DNN) has been explored for power load forecasting (Elgarhy et al., 2017). The disadvantage of these models is their local minima sticking issue, which limits them from achieving better performance. Additionally, the convergence rate of these models (ANN-based DNN) is very slow (Bouktif et al., 2018).
Other machine learning models, including SVM, generic neural network regression, and extreme learning, can also be applied for power load forecasting (Deo et al., 2016; Bendu et al., 2017; Hossain et al., 2017). Various machine learning models can be selected for power load forecasting based on their key attributes. Researchers are advised to study the attributes of the given models and then compare their performance for selecting the best model.
The prediction of power load of end electricity users based on time-series, Kalman filter, SVM, support vector regression, and ARIMA was explored by Ghofrani et al. (2011); Singh et al. (2012); Ziekow et al. (2013); Chaouch (2014); and Ding et al. (2015), respectively. Other researchers explored numerous other machine learning models for the task of user-level load prediction, in which they obtained better performance (Aurangzeb, 2019; Naz et al., 2019).
The aforementioned explorations by various expert researchers for user-level load prediction have numerous limitations. In my opinion, one of the best attempts for user-level load forecasting was made by Kong et al. (2019). We studied this attempt very well and adapted it in our various recent works, where we achieved better performances (Alhussein et al., 2020; Aurangzeb et al., 2021).
The study aims to focus on not just power load forecasting at the individual user level but also on dividing a smart community into groups of similar-consumption-pattern customers, who have similarities in their historical power consumption trend/behavior. The insights gained from this work will enhance the ability of the utility company in understanding the variations in energy demand. Specifically, the target is the group of electricity customers with unpredictable power consumption patterns. The utility will be in a better position for controlling the operations, management, and stability of the power system for the residential society, which is essential in the current era.
3 Feature vector formation for DBSCAN-based profiling
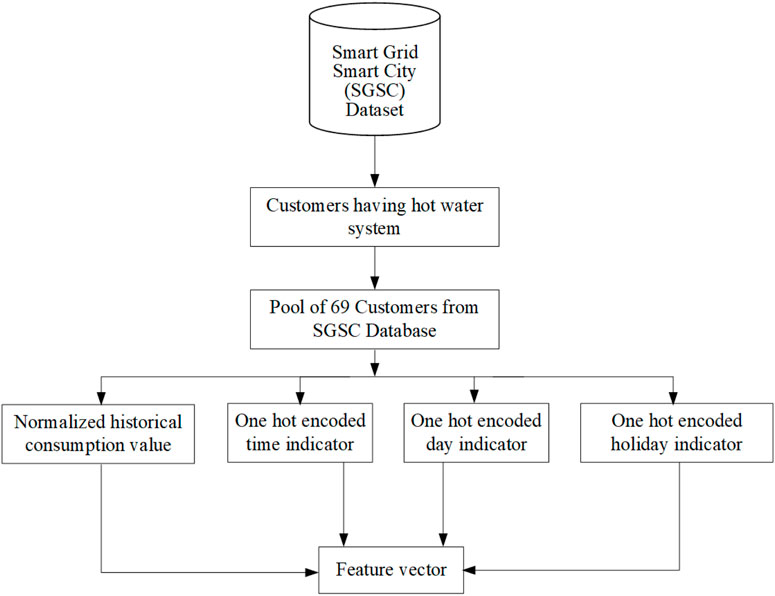
For investigating the anomaly detection in the electricity consumption behavior of electricity users, we have separated the data set collected by the team of the Smart Grid Smart City (SGSC) project (13, 2014). For the experimentation and analysis, we selected customers who have installed a hot water system. Based on this condition, the data on 69 electricity customers are separated from the full database containing the data on 10,000 electricity users. The procedure is graphically explained in Figure 3. Different variables, including weather, usage time, week or weekend day, seasons, user affordability, and lifestyle variations, have different impacts on power consumption variations in a smart society. We have considered these variables in the feature vector shown in Figure 3.
The finalized feature vector shown in Figure 3 is used for DBSCAN-based profiling of historical energy consumption data for analyzing the consumption behavior of the electricity users in the selected smart community. The aim of the analysis has been to identify the anomalies, as well as major and minor clusters in the consumption behavior of the selected pool of 69 customers over a period of 92 days.
Based on this analysis, the electricity users could be grouped into various clusters based on different criteria, such as absolute consumption value, extremities in consumption behaviors (also called anomalies or outliers), and major/minor clusters. The outcome of this study will assist utility companies and researchers in assessing the reliability and stability of smart grids, which is essential for the sustainability and productivity of today’s society.
The selection procedure of the pool of 69 customers from the full database containing the data on 10,000 users is presented in algorithm 1, which is explained in this study.
From the pool of 10,000 electricity users of the SGSC database, a subset of energy users who own a hot water system is separated. This resulted in a subset of 69 customers who possess a similar social status (own hot water systems). The purpose has been to analyze the trend in their electricity consumption behavior and segregate users with regular and anomalous behaviors. This will help us in developing and training separate DNN models for regular and irregular users, which, in turn, will lead to a higher accuracy in the forecasting of energy demand for the residential society.
Algorithm 1.Pseudocode for the selection and feature vector formation of 69 electricity users.
Input: The smart meter data collected by the team of the SGSC database.
Procedure: Selection of electricity users who have installed a hot water system in their homes.
While all the users of the SGSC database are processed do
For each electricity customer in the SGSC database do
If (the user has installed a hot water system) then
Select the user and copy its data to the desired subset;
Else
Do not save the details of the electricity user;
End For
End While
Output: Subset of electricity consumers who own a hot water system. Process the new set for cleaning the data and input the missing measurements;
The power consumption behavior and pattern analysis of the users could be performed in various ways. The aggregate power consumption at the community level is performed for long-term planning of the power system. For daily management and operations of the power system, short-term power consumption at the user level is required.
The short-term power consumption analysis could be performed by developing machine and deep learning models for forecasting the future power requirement at the user level. It is not feasible and practical to develop a deep learning model for every individual user of the residential society. So, grouping of similar-level users is an attractive approach for dividing a residential community into various similar-consumption-pattern groups and then developing deep learning models for each group.
For grouping the users into various similar-profile groups, an analysis of their historical power consumption is usually performed. Based on such analysis, the users can easily be grouped into various similar-profile clusters. For clustering the users into predictable and unpredictable groups, an appropriate method for identifying minor/major clusters and outliers (anomalies) in the historical consumption behavior is needed. Numerous methods exist, such as the isolation forest, numeric, Z-score, and DBSCAN methods, which could be selected and used for such analysis.
4 Proposed method
In this study, we have chosen the DBSCAN-based method, which is a density-based approach for identifying major/minor clusters and outliers in the historical consumption data (Stephen et al., 2017). We applied the DBSCAN method for identifying various major and minor clusters, as well as for finding anomalies in the consumption patterns of the electricity users over a period of 92 days. The main attractive point of the DBSCAN approach is that it does not need clustering information in advance. Furthermore, anomalies in the historical consumption pattern are also determined. The DBSCAN-based clustering method is performed to analyze the power consumption behavior of the end electricity user.
The proposed anomalies and major clustering-based prediction methods are significantly different from traditional centralized and distributed forecasting schemes. The centralized prediction methods have been explored, and DNN models were developed in many recent research papers (Kong et al. (2019); Alhussein et al. (2020); Khalid et al. (2020); Aurangzeb et al. (2021). According to these methods, data are collected at the user’s home and transmitted to a main server where the DNN model is residing. The forecasting is performed at the main server, where the advantage is that no intelligence is required at the end user level, but communication overhead is the main problem. On the other hand, the prediction at the edge (distributed forecasting), i.e., at the customer level, requires every end user to be equipped with intelligence and the ability to execute the forecasting models, which were previously explored in Alhussein et al. (2019); Kong et al. (2019); Aurangzeb et al. (2021). The disadvantage of forecasting at the edge is the requirement of one DNN model and computing platform per electricity user, which is not feasible. So, a third approach is a hybrid method, where consumers with similar profiles are grouped together, and one intelligent node/model is enough to forecast the power load for each node. This is our adopted prediction method, which is also explored in recent studies (Aurangzeb et al., 2021). The main differences between the proposed method from these distributed clustering approaches are anomalies and major clustering-based grouping, which has not been studied previously.
5 Results and discussions
The user-level power consumption measurements were collected by the team of the Australian Government initiative—the Smart Grid Smart City (SCSG) project. We have used this database for the DBSCAN-based profiling of the historical energy consumption for identifying anomalies and major/minor clusters in consumption behavior over a period of 92 days. In addition to the historical power consumption value, the database contained many other features, including the time of the day, the day of the week, and the holiday information, which we have encoded to form our feature vector for DBSCAN-based profiling.
Based on their different features, the data were collected half-hourly. This means that 48 samples were recorded every day, and each sample is composed of 57 different features. We have extracted a subset of the database based on a criterion for separating users attributing a quite closely similar social status. This is needed for analyzing the user-level analysis as the consumption values for customers belonging to significantly different social statuses will characterize potentially different power consumption values.
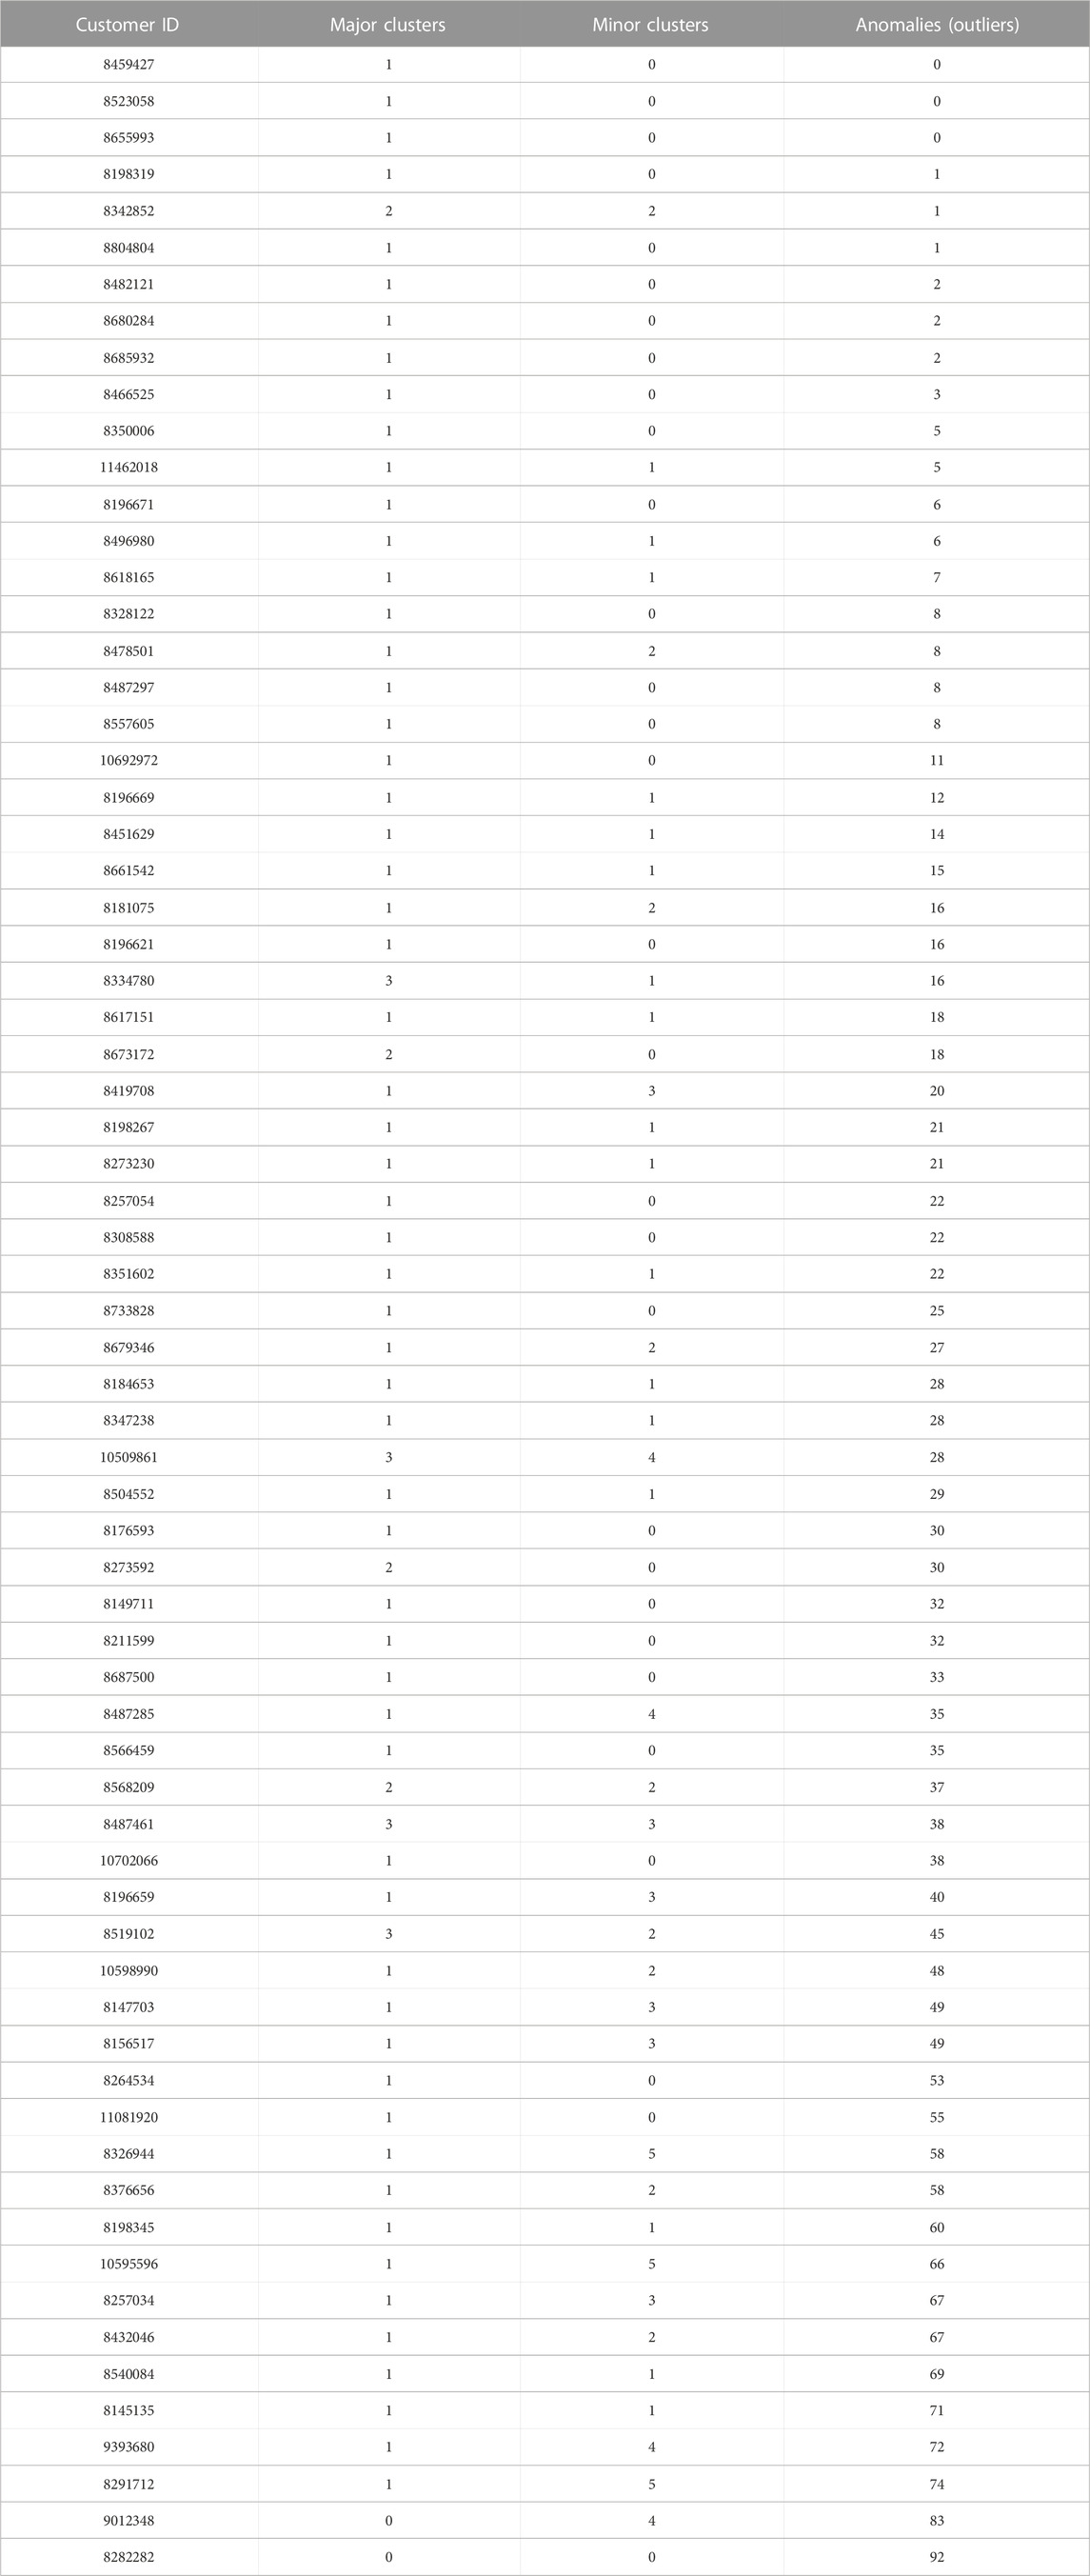
The grouping of the daily consumption behavior based on the historical data on the entire community (69 users) for the entire duration of the analyzed data (92 days) using DBSCAN profiling is performed, and the results are presented in Table 1. Results indicate that most users have at least one major cluster in their consumption behavior. Additionally, most of the users also exhibit minor clusters in their consumption behavior. The most important result to be observed is the higher number of outliers in the consumption behavior of a group of electricity users.
The higher number of outliers in the consumption behavior leads to higher fluctuations, which negatively impacts the stability and reliability of the power system. Furthermore, if not properly analyzed and identified, the user with such behavior will also have a negative impact on the forecasting accuracy of other users. This is the most important observation, and the reason for this is that the model trained on the mixed data on both predictable and unpredictable users will not produce optimal forecasting accuracy.
The higher fluctuations in the consumption behavior of the individual electricity users in the residential community demand to identify groups of customers with similar consumption patterns and then develop an efficient deep learning model for forecasting the power demand of individual users of the respective groups. The developed deep learning model is to be trained on the combined historical data on the respective customers of the groups, which can then be confidently used for forecasting the power demand of the individual users with higher accuracy.
The grouping of electricity customers based on the absolute consumption value will lead to lower forecasting accuracy for individual users. The reason is the presence of electricity users who attribute higher anomalies in their daily power consumption patterns. So, identifying such users and making a separate group is a better alternative for training a specialized deep learning model, which will achieve reliable accuracy for the users. The overall impact will be significantly higher, due to the absence of users with higher anomalies in the other groups of predictable customers.
The separate trained models for the two groups, i.e., predictable and unpredictable users, will be more efficient for accurate prediction of the power load of the respective users of each group. This approach seems much better and feasible/reliable compared to the approaches of training a deep learning model for each user (Kong et al., 2019) or the full community. Additionally, compared to the approach of one model for the full community, the prediction accuracy will be higher, while compared to having a per-user model, the developed approach will be much more practical and feasible.
The proposed scheme for grouping customers based on the number of major clusters and outliers is presented in Figure 4. All the customers are divided into four groups based on a fixed and suitable criterion.
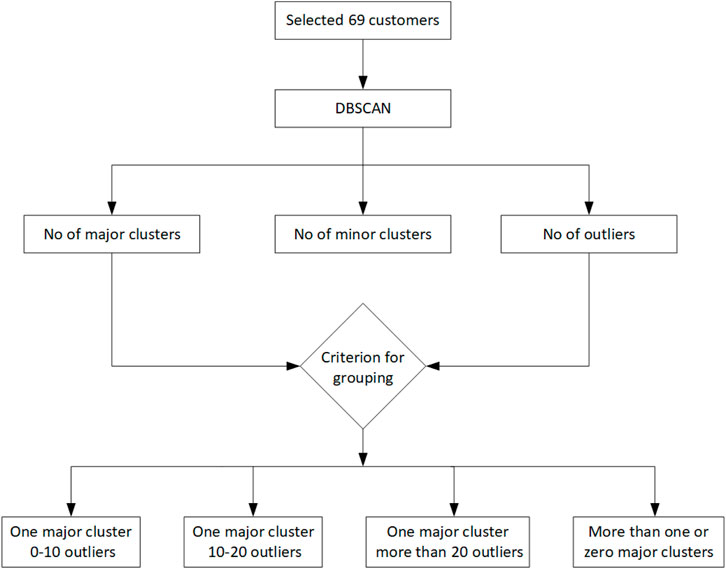
FIGURE 4. Proposed scheme for grouping customers based on the number of major clusters and outliers.
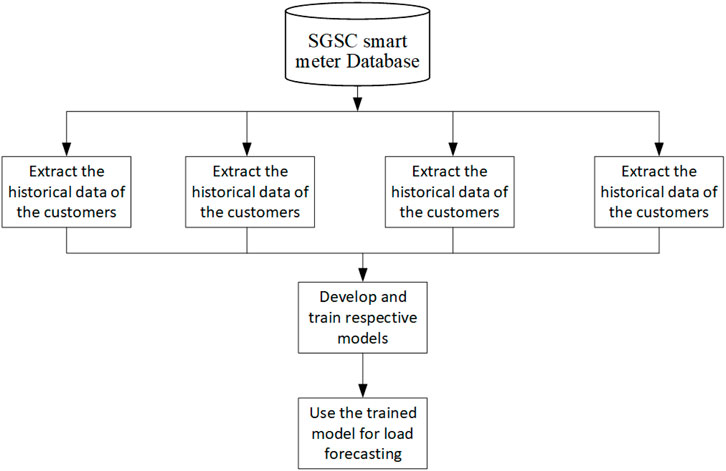
The proposed approach for developing and training the deep learning model for the various groups of customers is shown in Figure 5. The various trained models based on respective historical consumption data on users of each group will be used for forecasting their future power load.
The number of major clusters and the number of outliers are the most important factors to consider for dividing the residential community into various clusters. The major clusters in the consumption behavior of the users effectively represent their electricity usage consistency. This is a little bit tricky, and a higher number of major clusters means quite some irregularity in consumption behavior. One major cluster in consumption behavior along with no or lower minor clusters and outliers is ideal for a stable and reliable power system. We need to analyze the DBSCAN clustering results and identify the group of such customers. The deep learning model trained on the data on this group will produce forecasting results with significantly better accuracy as this is the most predictable group.
More importance and due consideration should be given to the group of customers attributing a higher number of outliers in consumption behavior and the customers having more than one major cluster or no cluster at all (all outliers). All these customers attribute unpredictable consumption behavior and should be identified and handled properly. Table 2 presents the grouping of customers based on the number of outliers in the electricity consumption behavior of 69 users over a period of 92 days. It is evident from this table that most of the customers (41 out of 69, i.e., more than half) have more than twenty outliers in power consumption behavior. More than half is significant, and customer grouping based on such a criterion could prove to be a better strategy for accurate forecasting of a vibrant residential society.
Table 3 presents the grouping of customers based on the number of major clusters in the electricity consumption behavior of 69 users over a period of 92 days. It is evident from this table that eight customers have more than one major cluster and two customers have zero major clusters. Both the cases of “more than one major cluster” and “zero clusters” provide important information about the customers exhibiting significantly unpredictable behavior. This means that all such customers need to be properly identified as they are the ones consuming highly variable power, causing instability in the power system.

TABLE 3. Customer grouping based on the number of major clusters in the electricity consumption behavior of 69 users over a period of 92 days.
Table 2 and Table 3 are the two possible criteria for grouping the customers and then combining the historical consumption data on the users of each group, which can be used for training the developed deep learning model. Both the cases of “more than one major cluster” and “zero major clusters” could be combined into one group as both effectively mean higher unpredictability in consumption behavior. We have selected clustering based on Table 3, i.e., the major cluster-based grouping of electricity users for developing and training a deep learning model.
Two other kinds of grouping of customer data are possible, i.e., data grouping based on seasonality and based on holiday mark, which we have not assessed. Based on these two kinds of grouping the historical data, deep learning models could be trained, which will further enhance their forecasting accuracy. The database used has full data only for 92 days, which limits seasonality-based analysis. However, such an analysis will assist researchers and utilities in efficient management of power resources for a residential society.
The two types of grouping the historical consumption data are shown in Table 4. Our analysis is limited to the “controllable”-type only as the time span of our considered data is only 92 days. However, for any real-life scenario or any other database having full data for a year or more, the other type of grouping could be investigated and will be helpful in further understanding of the situation.
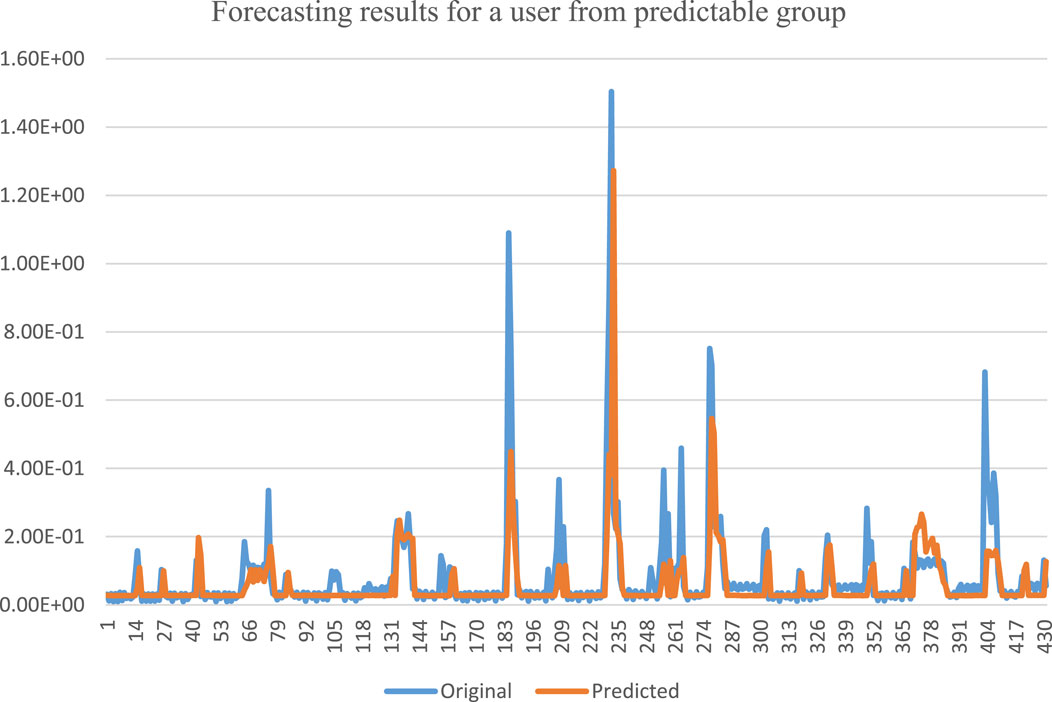
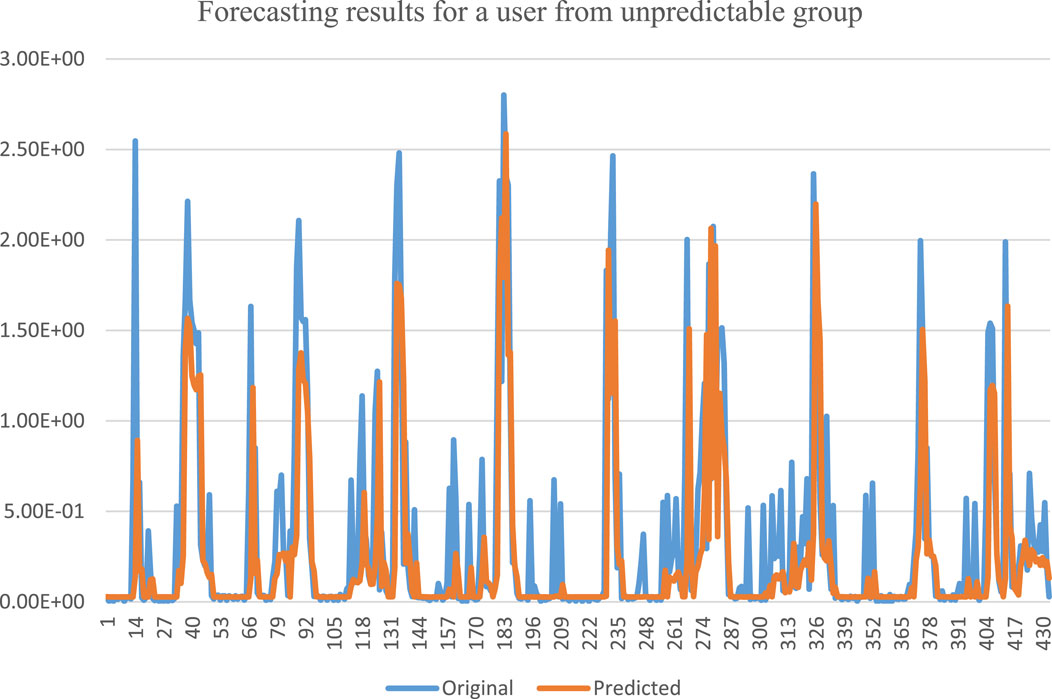
The predictability of a phenomenon or process is how close a forecasted value is with respect to its original value. In the conducted experiments, predictability analysis is performed, and the results are presented for the two groups of electricity users, i.e., “high variations” and “low variations.”
Our previously developed deep learning model (Alhussein et al., 2020) is trained based on the combined historical power consumption data on the users of the two groups, i.e., predictable and unpredictable. For the reader’s convenience, the deep learning model from Alhussein et al. (2020) is shown in Figure 6.
For the validation of the proposed method with the selected data, we have used our previously developed CNN-LSTM-based DNN model for forecasting the power load of end users. The forecasting results for a user from the group of customers having low variations in power consumption usage are shown in Figure 7. It is evident from the figure that the predicted curve quite closely follows the original curve. The gap between the original and predicted curves is lower, which means higher forecasting performance. Similar forecasting performance could be achieved for other users of this group.
The forecasting results for a user from the group of customers having higher variations in power consumption usage are shown in Figure 8. It is evident from the figure that the predicted values roughly follow the original values. The gap between the original and predicted curves is higher compared to the case of the other group, i.e., the predictable group.
Based on our observations in Figure 7 and Figure 8, it can easily be concluded that separating the residential society into two groups of predictable and unpredictable users is a good strategy for achieving significantly better forecasting results. Better forecasting results will lead to better planning and management, which will result in higher stability of the power system of the residential community.
6 Conclusion
The sustainable management of the power services of residential communities is a challenging task. The challenge lies in the unpredictability and volatility of the energy consumption patterns of the customers. Customers’ preference is multidimensional, where they are interested in lower cost and higher comfort. To ensure these constraints, the utility uses different strategies, including demand-side management, by offering attractive pricing schemes in addition to developing enhanced load forecasting models. The aim of the current work is on one aspect, i.e., how to increase the predictability of the power demand of end users in a residential community. Such an analysis is mandatory for analyzing future power loads to ensure smooth and uninterrupted operation and management of smart grids. DBSCAN-based profiling is used for identifying the number of major/minor clusters. Based on this analysis, the anomalous energy users are segregated from regular energy users. The aim has been to show that developing DNN models for regular and irregular power users, respectively, will lead to accurate forecasting results.
Achieved results indicate the following important conclusions: more than half of the electricity customers, i.e., 41 out of 69, exhibit a higher number of outliers in their electricity consumption behavior. It is also observed that few customers do not form any major cluster in their consumption behavior. All the cases of customers with more than one major cluster, no major cluster at all, and more than 20 outliers in the power consumption behavior are a small proportion of the whole society, but their impact is higher.
If these customers are not identified properly before developing and training a deep learning model, then the forecasting accuracy of the DNN model will not be highly accurate. Properly identifying such customers and developing separate models for them will help the utility company in getting much better and more reliable forecasting results. Better and reliable forecasting accuracy will help in sustaining a stable and reliable power system for the residential society, which is highly essential in the modern era.
The limitation to the proposed method is that the DBSCAN-based method is used for separating users having a hot water system. It will affect the applicability of the proposed method for any big residential society. However, it was mandatory to separate a subset of specific users (regular vs. irregular) in order to analyze the anomalous users and devise ways to handle them. Future work should focus on exploring more skillful methods for separating customers into groups with higher similarities in electricity usage behavior and use all these groups for analyses (not selecting one sub-set).
Data availability statement
The original contributions presented in the study are included in the article/Supplementary Material; further inquiries can be directed to the corresponding author.
Author contributions
KA: conceptualization, data curation, formal analysis, funding acquisition, investigation, methodology, project administration, resources, software, supervision, validation, visualization, writing–original draft, and writing–review and editing.
Funding
The author(s) declare financial support was received for the research, authorship, and/or publication of this article. This research is funded by Researchers Supporting Project Number (RSPD 2023R947), King Saud University, Riyadh, Saudi Arabia.
Conflict of interest
The author declares that the research was conducted in the absence of any commercial or financial relationships that could be construed as a potential conflict of interest.
Publisher’s note
All claims expressed in this article are solely those of the authors and do not necessarily represent those of their affiliated organizations, or those of the publisher, the editors and the reviewers. Any product that may be evaluated in this article, or claim that may be made by its manufacturer, is not guaranteed or endorsed by the publisher.
References
Alhussein, M., Haider, S. I., and Aurangzeb, K. (2019). Microgrid-level energy management approach based on short-term forecasting of wind speed and solar irradiance. Energies 12, 1487. doi:10.3390/en12081487
Alhussein, M., Aurangzeb, K., and Haider, S. I. (2020). Hybrid cnn-lstm model for short-term individual household load forecasting. IEEE Access 8, 180544–180557. doi:10.1109/ACCESS.2020.3028281
Aslam, S., Iqbal, Z., Javaid, N., Khan, Z. A., Aurangzeb, K., and Haider, S. I. (2017). Towards efficient energy management of smart buildings exploiting heuristic optimization with real time and critical peak pricing schemes. Energies 10, 2065. doi:10.3390/en10122065
Aurangzeb, K., Alhussein, M., Javaid, K., and Haider, S. I. (2021). A pyramid-cnn based deep learning model for power load forecasting of similar-profile energy customers based on clustering. IEEE Access 9, 14992–15003. doi:10.1109/ACCESS.2021.3053069
Aurangzeb, K. (2019). “Short term power load forecasting using machine learning models for energy management in a smart community,” in Proceeding of the 2019 International Conference on Computer and Information Sciences (ICCIS), Sakaka, Saudi Arabia, April 2019 (IEEE), 1–6. doi:10.1109/ICCISci.2019.8716475
Bendu, H., Deepak, B., and Murugan, S. (2017). Multi-objective optimization of ethanol fuelled hcci engine performance using hybrid grnn–pso. Appl. Energy 187, 601–611. doi:10.1016/j.apenergy.2016.11.072
Bouktif, S., Fiaz, A., Ouni, A., and Serhani, M. A. (2018). Optimal deep learning lstm model for electric load forecasting using feature selection and genetic algorithm: comparison with machine learning approaches. Energies 11, 1636. doi:10.3390/en11071636
Chaouch, M. (2014). Clustering-based improvement of nonparametric functional time series forecasting: application to intra-day household-level load curves. IEEE Trans. Smart Grid 5, 411–419. doi:10.1109/TSG.2013.2277171
Deo, R. C., Wen, X., and Qi, F. (2016). A wavelet-coupled support vector machine model for forecasting global incident solar radiation using limited meteorological dataset. Appl. Energy 168, 568–593. doi:10.1016/j.apenergy.2016.01.130
Ding, Y., Borges, J., Neumann, M. A., and Beigl, M. (2015). “Sequential pattern mining — a study to understand daily activity patterns for load forecasting enhancement,” in Proceeding of the 2015 IEEE First International Smart Cities Conference (ISC2) (IEEE), 1–6. doi:10.1109/ISC2.2015.7366169
Elgarhy, S. M., Othman, M. M., Taha, A., and Hasanien, H. M. (2017). “Short term load forecasting using ann technique,” in Proceeding of the 2017 Nineteenth International Middle East Power Systems Conference (MEPCON), Guadalajara, Mexico, October 2015 (IEEE), 1385–1394. doi:10.1109/MEPCON.2017.8301364
Ghofrani, M., Hassanzadeh, M., Etezadi-Amoli, M., and Fadali, M. S. (2011). “Smart meter based short-term load forecasting for residential customers,” in Proceeding of the 2011 North American Power Symposium, Boston, MA, USA, August 2011 (IEEE), 1–5. doi:10.1109/NAPS.2011.6025124
Hossain, M., Mekhilef, S., Danesh, M., Olatomiwa, L., and Shamshirband, S. (2017). Application of extreme learning machine for short term output power forecasting of three grid-connected pv systems. J. Clean. Prod. 167, 395–405. doi:10.1016/j.jclepro.2017.08.081
Khalid, A., Aslam, S., Aurangzeb, K., Haider, S. I., Ashraf, M., and Javaid, N. (2018). An efficient energy management approach using fog-as-a-service for sharing economy in a smart grid. Energies 11, 3500. doi:10.3390/en11123500
Khalid, R., Javaid, N., Al-zahrani, F. A., Aurangzeb, K., Qazi, E.-u.-H., and Ashfaq, T. (2020). Electricity load and price forecasting using jaya-long short term memory (jlstm) in smart grids. Entropy 22, 10. doi:10.3390/e22010010
Kong, W., Dong, Z. Y., Jia, Y., Hill, D. J., Xu, Y., and Zhang, Y. (2019). Short-term residential load forecasting based on lstm recurrent neural network. IEEE Trans. Smart Grid 10, 841–851. doi:10.1109/TSG.2017.2753802
Lidula, N., and Rajapakse, A. (2011). Microgrids research: a review of experimental microgrids and test systems. Renew. Sustain. Energy Rev. 15, 186–202. doi:10.1016/j.rser.2010.09.041
Malik, S., and Kim, D. (2018). Prediction-learning algorithm for efficient energy consumption in smart buildings based on particle regeneration and velocity boost in particle swarm optimization neural networks. Energies 11, 1289. doi:10.3390/en11051289
Martín, L., Zarzalejo, L. F., Polo, J., Navarro, A., Marchante, R., and Cony, M. (2010). Prediction of global solar irradiance based on time series analysis: application to solar thermal power plants energy production planning. Sol. Energy 84, 1772–1781. doi:10.1016/j.solener.2010.07.002
Massana, J., Pous, C., Burgas, L., Melendez, J., and Colomer, J. (2015). Short-term load forecasting in a non-residential building contrasting models and attributes. Energy Build. 92, 322–330. doi:10.1016/j.enbuild.2015.02.007
Mohsenian-Rad, A., Wong, V. W. S., Jatskevich, J., Schober, R., and Leon-Garcia, A. (2010). Autonomous demand-side management based on game-theoretic energy consumption scheduling for the future smart grid. IEEE Trans. Smart Grid 1, 320–331. doi:10.1109/TSG.2010.2089069
Naz, A., Javaid, N., Rasheed, M. B., Haseeb, A., Alhussein, M., and Aurangzeb, K. (2019). Game theoretical energy management with storage capacity optimization and photo-voltaic cell generated power forecasting in micro grid. Sustainability 11, 2763. doi:10.3390/su11102763
Niyato, D., Xiao, L., and Wang, P. (2011). Machine-to-machine communications for home energy management system in smart grid. IEEE Commun. Mag. 49, 53–59. doi:10.1109/MCOM.2011.5741146
Paoli, C., Voyant, C., Muselli, M., and Nivet, M.-L. (2009). “Solar radiation forecasting using ad-hoc time series preprocessing and neural networks,” in Emerging intelligent computing technology and applications. Editors D.-S. Huang, K.-H. Jo, H.-H. Lee, H.-J. Kang, and V. Bevilacqua (Berlin, Heidelberg: Springer Berlin Heidelberg), 898–907.
Singh, R. P., Gao, P. X., and Lizotte, D. J. (2012). “On hourly home peak load prediction,” in Proceeding of the 2012 IEEE Third International Conference on Smart Grid Communications (SmartGridComm), Tainan, Taiwan, November 2012 (IEEE), 163–168. doi:10.1109/SmartGridComm.2012.6485977
Stephen, B., Tang, X., Harvey, P. R., Galloway, S., and Jennett, K. I. (2017). Incorporating practice theory in sub-profile models for short term aggregated residential load forecasting. IEEE Trans. Smart Grid 8, 1591–1598. doi:10.1109/TSG.2015.2493205
Zheng, J., Xu, C., Zhang, Z., and Li, X. (2017). “Electric load forecasting in smart grids using long-short-term-memory based recurrent neural network,” in Proceeding of the 2017 51st Annual Conference on Information Sciences and Systems (CISS), Baltimore, MD, USA, March 2017 (IEEE), 1–6. doi:10.1109/CISS.2017.7926112
Ziekow, H., Struker, J., Goebel, C., and Jacobsen, H.-A. (2013). “The potential of smart home sensors in forecasting household electricity demand,” in Proceeding of the IEEE International Conference on Smart Grid Communications (SmartGridComm), Vancouver, BC, Canada, October 2013 (IEEE). doi:10.1109/smartgridcomm.2013.6687962
Keywords: residential community, smart grids, end electricity user, clustering, major clusters, minor clusters, anomalies, outliers
Citation: Aurangzeb K (2023) Anomalies and major cluster-based grouping of electricity users for improving the forecasting performance of deep learning models. Front. Energy Res. 11:1284076. doi: 10.3389/fenrg.2023.1284076
Received: 27 August 2023; Accepted: 23 October 2023;
Published: 15 November 2023.
Edited by:
Muhammad Zeeshan Malik, Taizhou University, ChinaReviewed by:
Ikram Syed, National University of Sciences and Technology (NUST), PakistanMuhammad Shahid Anwar, Gachon University, Republic of Korea
Faisal Shehzad, Robert Bosch, Germany
Copyright © 2023 Aurangzeb. This is an open-access article distributed under the terms of the Creative Commons Attribution License (CC BY). The use, distribution or reproduction in other forums is permitted, provided the original author(s) and the copyright owner(s) are credited and that the original publication in this journal is cited, in accordance with accepted academic practice. No use, distribution or reproduction is permitted which does not comply with these terms.
*Correspondence: Khursheed Aurangzeb, a2F1cmFuZ3plYkBrc3UuZWR1LnNh
 Khursheed Aurangzeb