 Rujun Wang
- Zhumadian Preschool Education College, Zhumadian, Henan, China
Introduction: Smart Grid (SG) as an intelligent system has become a key element in the efficient operation of the electrical grid. With the continuous increase in global energy demand and escalating environmental concerns, the importance of energy conservation and sustainable energy sources has become increasingly prominent. Especially in energy-intensive sectors such as large-scale buildings, energy supply and management face challenges. These structures require a significant amount of energy supply at specific times, but may encounter energy wastage issues at other times.
Method: Smart Grid technology establishes a network that can transmit both electricity and data. By making full use of this data, intelligent decision-making is achieved, optimizing grid operations. Therefore, the application of Smart Grid technology to energy conservation has attracted attention and become a research focus. This study utilizes the TCN-BiGRU model, leveraging spatiotemporal sequence data and incorporating an attention mechanism to predict future energy consumption.
Results: The research results indicate that the integration of Smart Grid technology, TCN, BiGRU, and the attention mechanism contributes to accurately and stably predicting energy consumption demands. This approach helps optimize energy scheduling, enhance energy utilization efficiency, and realize more intelligent, efficient, and sustainable energy management and utilization strategies.
Discussion: This study provides an innovative solution for applying Smart Grid technology to energy conservation in large-scale buildings. This approach holds the potential to improve the efficiency of energy supply and management, promote sustainable energy utilization, and address the growing global energy demand and environmental issues.
1 Introduction
Globally, the close link between energy demand and environmental issues has raised concerns about energy utilization. In order to meet this challenge, countries have launched energy conservation and environmental protection policies to support and encourage the implementation of energy conservation measures. However, large energy consumers such as sports venues need not only the support of adaptation policies, but also the requirements of energy consumption regulation (Wen et al., 2021). While providing the required energy for games, events, etc., how to efficiently manage energy has become an urgent task. With the continuous development of smart technology, the Internet of Things and big data and other fields, smart grid technology has gradually matured, providing a new way to solve the energy management problems of sports venues. Smart grid (SG), as an intelligent means to promote the efficient operation of the power grid, has received more and more attention worldwide. Such networks not only allow the flow of power and data, but also use that data to enable intelligent decision-making. Through deep learning of artificial intelligence technology, making full use of data analysis, intelligent control and energy optimization strategies, smart grid technology is expected to achieve accurate prediction and refined management of energy consumption in sports venues, so as to achieve comprehensive goals, including energy saving, environmental protection and economic benefits (Hegazy et al., 2022). Therefore, the application prospect of smart grid technology in the field of energy saving in sports venues has attracted much attention.
There are many advantages to using deep learning models to predict energy consumption in stadiums. First of all, the energy consumption of sports venues is affected by many complex factors, such as weather conditions, types of activities, traffic flow, etc. Deep learning models are able to capture these complex correlations, helping to more accurately predict energy consumption. Then, deep learning models are often able to provide higher prediction accuracy than traditional statistical methods. They can learn patterns from large amounts of data to better predict future energy consumption. Moreover, deep learning models can be adjusted and optimized based on real-time data, and can automatically process large amounts of data without manual intervention, which reduces the workload of manual data processing and improves efficiency. Additionally, once deep learning models are built, they can be easily scaled to multiple stadiums or different venues, making energy management more consistent and controllable across multiple locations. Deep learning models can also help sports venues save energy and operating costs, provide data support for decision-making, and help managers better understand energy consumption patterns to formulate more strategic management plans that are more important to sustainability and environmental protection. Make a positive impact.
The application of smart grid technology (SG) in the energy saving of stadiums involves a variety of models, which can be divided into energy demand forecasting models, load forecasting and optimization models, energy optimization dispatching models, renewable energy integration models, energy storage management models, intelligent Control model, virtual power plant model, user energy management model, data analysis and decision support model (Nazir et al., 2023). This research mainly focuses on the energy demand forecasting model. The energy demand forecasting model is based on the time series model. Commonly used are ARIMA, SARIMA, LSTM, GRU, etc., which are used to predict future energy demand in order to implement appropriate energy scheduling and management strategies (Zhao et al., 2023).
This research combines advanced technologies such as TCN and BiGRU, and introduces a fused attention mechanism to address energy management challenges in the field of smart grids. This research not only helps improve the accuracy and stability of energy consumption forecasts, but also provides new methods and insights for the sustainable development of smart grid systems. By optimizing the use of energy resources, this research is expected to reduce energy waste and improve the efficiency of the grid, thereby contributing to future renewable energy and energy sustainability. It is of great significance to achieve a more intelligent, efficient and sustainable power system.
The ARIMA (AutoRegressive Integrated Moving Average) model is a frequently used statistical model for time series forecasting. It combines auto-regression (AR) and moving average (MA) characteristics and includes an integrated operation (Chen et al., 2023). It is widely applied for trend analysis, periodic forecasting, and seasonal forecasting of time series data.
The SARIMA (Seasonal AutoRegressive Integrated Moving Average) model is an extension of the ARIMA model, incorporating seasonal components for time series forecasting (Dubey et al.,2021). It is suitable for data exhibiting distinct seasonal features and is capable of capturing trends, periodicity, and seasonal variations. SARIMA combines auto-regression (AR), differencing (I), moving average (MA), and seasonal components, enabling more accurate predictions of data with seasonal cycles.
LSTM (Long Short-Term Memory) is a variant of Recurrent Neural Networks (RNN) designed specifically for processing sequence data, including time series. LSTM aims to address the vanishing gradient and exploding gradient issues that traditional RNNs face when handling long sequences, while also capturing long-term dependencies (Hasan et al., 2019). LSTM’s internal memory units allow it to decide whether to update, store, or output information based on inputs and previous states. LSTM’s core structure includes three gates: the forget gate, input gate, and output gate. These gates control information flow and storage, enabling the model to effectively learn long-term dependencies.
GRU (Gated Recurrent Unit) is a variation of the RNN designed for sequence data processing. Compared to traditional RNNs, GRU introduces gating mechanisms to better capture long-term dependencies and partially alleviate the vanishing gradient issue (Xia et al., 2021). GRU has a simple structure and has demonstrated good performance in various sequence modeling tasks.
However, these models have their limitations in energy demand prediction. Stadium energy consumption is complex, often exhibiting seasonal variations and periodic demands. ARIMA assumes linearity and may not effectively handle non-linearity and complex seasonality. While SARIMA can handle complex seasonality, the introduction of seasonal components increases parameter estimation and training complexity, especially for large datasets. LSTM has a black-box nature and lacks interpretability. GRU also has limitations in interpretability. Hence, considering these issues, this study proposes the TCN-BiGRU model with an attention mechanism for energy demand prediction.
The TCN-BiGRU model is a hybrid model that combines different neural network architectures for time series forecasting. The integration of TCN and BiGRU already provides the model with the capability to model sequence patterns and dependencies. The introduction of the attention mechanism further enhances the model’s ability to accurately model time series, particularly in the presence of complex seasonal and periodic patterns.
The main contributions of this study are as follows:
• The TCN-BiGRU model combined with the attention mechanism can help the model automatically learn and select important time steps or features within sequences, enhancing the model’s perception of critical information. In the context of sports stadium energy consumption, this can help the model focus on key moments and influential factors, improving the accuracy of energy demand prediction.
• The TCN-BiGRU model combined with the attention mechanism can adaptively learn the correlations and influences at different time scales. Therefore, it can better capture and predict demand changes at various time scales that may exist in sports stadium energy consumption data.
• The TCN-BiGRU model combined with the attention mechanism can explicitly indicate the model’s attention level to different time steps, enhancing the model’s interpretability. This aids in explaining the basis of model prediction results, providing decision-makers with more reliable information.
In the following sections, recent related work will be presented in Section 2. Section 3 will provide an overview of our proposed methods, including BiLSTM networks, ResNet50, and GAN. Section 4 will present the experimental details and comparative experiments. Finally, Section 5 will conclude the paper.
2 Related work
2.1 Smart grid technology
Smart grid technology is a comprehensive energy management system that utilizes advanced information and communication technologies, along with data analytics and control algorithms, to achieve intelligent monitoring, optimization, and management of power systems (Butt et al., 2021). Its goal is to enhance the efficiency, reliability, and sustainability of power systems while meeting the growing energy demands and environmental requirements. Smart grid technology is characterized by features such as digital monitoring and control, data analytics and prediction, intelligent optimization, distributed energy management, responsiveness, and flexibility.
The application research of smart grid technology in energy efficiency of sports venues shows tremendous potential. Smart grid technology enables real-time monitoring and optimization of energy consumption in sports venues by automatically adjusting lighting, heating, ventilation, and air conditioning systems (Massaoudi et al., 2021b). This leads to significant improvements in energy efficiency and reduction of energy wastage. By providing real-time energy consumption data and analytical insights, smart grid technology empowers venue managers and users to stay informed about energy usage and encourages energy-saving behaviors (Das et al., 2020). Leveraging data analysis, smart grid technology can predict equipment failures in sports venues, enabling proactive maintenance to reduce blackout risks and ensure stable energy supply.
However, it is important to note that the application of smart grid technology in energy efficiency of sports venues also faces challenges, such as data privacy protection and model complexity. Future research should address these challenges and continuously enhance and optimize smart grid technology to achieve more reliable, efficient, and sustainable energy management objectives.
2.2 Energy demand forecasting models
Energy demand forecasting models are mathematical and statistical models used to predict future energy demand based on historical energy consumption data, external factors, and trends. These models analyze and model the changes in energy demand over a specified period of time, playing a crucial role in energy management, power system operation, and planning. They assist decision-makers in making informed choices regarding energy supply and load dispatch (Kazemzadeh et al., 2020). Depending on the methods and techniques applied, energy demand forecasting models can be categorized into time series models, statistical regression models, machine learning models, deep learning models, and more.
The application of energy demand forecasting models within the context of smart grid technology is vital for achieving intelligent management and optimization of power systems. Smart grids require efficient power supply and load scheduling based on actual demands (Somu et al., 2021). Energy demand forecasting models can provide accurate load predictions for future time periods, enabling precise energy scheduling in smart grids to avoid over-supply or under-supply. Smart grids need to constantly monitor the supply-demand balance of power systems. Energy demand forecasting models can help smart grids predict future loads and energy supply, facilitating timely adjustments to generation and distribution strategies to maintain energy balance. The volatility and instability of renewable energy sources pose challenges for smart grids. Energy demand forecasting models can incorporate factors like weather data to predict renewable energy generation, assisting smart grids in optimizing energy source allocation and efficient integration of renewable energy.
Although the application of energy demand forecasting models in smart grid technology offers numerous advantages, challenges like data quality, model accuracy, and real-time performance need to be considered. The accuracy of energy demand forecasting models heavily relies on the accuracy of historical data and external factors (Su et al., 2019). Inaccurate data quality or significant external factor variations may lead to inaccurate predictions. Advanced models might have complex structures, necessitating substantial computational resources and time for training and optimization. Furthermore, unforeseen events, such as natural disasters or policy changes, can impact energy demand but are difficult to accurately model within the model. Over time, models require continuous updates and maintenance to adapt to new data and changing environments, necessitating additional resources and efforts. Despite these limitations, researchers and engineers continue to strive to improve and optimize energy demand forecasting models to overcome these challenges and enhance prediction accuracy and practicality.
2.3 Deep learning
Deep learning is a subfield of machine learning that involves constructing multi-layered neural network models inspired by the structure and function of the human brain (Kotsiopoulos et al., 2021). These models automatically extract and recognize complex high-level features from large-scale data, aiming to perform tasks like classification, regression, clustering, image processing, and more. Its primary advantage lies in its ability to autonomously extract abstract features from data without explicitly defining feature extractors, making it highly adaptable to complex and large-scale real-world datasets.
The application of deep learning in energy efficiency research of sports venues is a novel and promising domain. Deep learning models can analyze historical energy consumption data of sports venues to predict future load variations, enabling precise scheduling strategies for energy management (Ferrag and Maglaras, 2019). Employing deep learning models to optimize energy distribution across lighting, heating, ventilation, and air conditioning systems can result in reduced energy consumption. Deep learning models can also analyze energy usage data to assess venue energy efficiency, providing targeted improvement recommendations to minimize energy wastage.
However, applying deep learning models in energy efficiency research of sports venues often poses challenges. Deep learning models require abundant data for training, particularly in the energy efficiency domain where high-quality energy consumption data might be challenging to obtain. Inaccurate data can lead to erroneous pattern learning and subsequently impact energy efficiency outcomes. Deep learning models tend to be complex and demand substantial computational resources and time for training and fine-tuning, which might be burdensome for real-time applications (Hafeez et al., 2020). Additionally, deep learning models might lack domain-specific energy knowledge, potentially hindering their ability to effectively account for the specific requirements and limitations of energy systems.
3 Methodology
3.1 Overview of our TCN-BiGRU model
This paper constructs the TCN-BiGRU model combined with the attention mechanism to study the innovative application of smart grid technology in the energy prediction problem of stadiums. The combination of TCN-BiGRU model and attention mechanism involves integrating the strengths of temporal convolutional networks (TCN) and bidirectional gated recurrent units (BiGRU) with the attention mechanism to enhance performance in sequence-related tasks. The model established in this article, as shown in Figure 1, is described below.
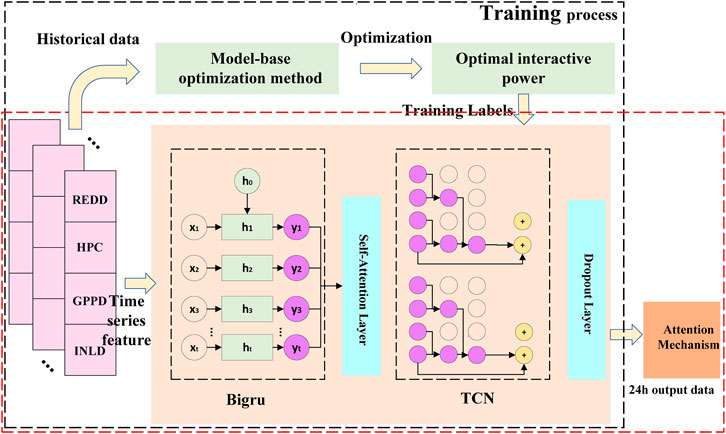
FIGURE 1. Overall flow chart of the model.
Firstly, it enables the utilization of spatiotemporal sequence data to construct the TCN-BiGRU model for predicting future energy consumption in the power grid. TCN facilitates the handling of long temporal sequences, while BiGRU enhances precise temporal feature extraction. By amalgamating these two models, accuracy and stability can be significantly improved. Secondly, with the incorporation of the attention mechanism, the model can focus more effectively on crucial factors within historical data, further enhancing prediction accuracy. The attention mechanism aids in selectively emphasizing significant features influencing energy consumption, making the model adaptable to various grid environments and changes.
The application of the attention mechanism in the TCN-BiGRU model helps to improve the overall performance of the model. First, the attention mechanism allows the model to automatically learn and focus on the information that is important to solve a specific task. In smart grid technology, this means that the model can better identify and predict key variables such as load demand and energy supply in the grid, thereby improving the stability and efficiency of the grid. In terms of energy-saving efficiency of stadiums, the attention mechanism can focus the attention of the model on the most relevant parts of various sensor data, such as human flow, temperature, lighting, etc., so as to optimize energy use and improve energy efficiency. Second, the attention mechanism also helps the model handle long-term dependencies. In smart grid technology, grid data usually has complex timing, and it is necessary to consider the impact of data at different time points on the future. And in stadiums, the behavior of spectators and the progress of sports games also need to consider long-term dependencies. By introducing an attention mechanism, the TCN-BiGRU model can better capture these long-term dependencies and improve the prediction accuracy. In addition, the attention mechanism also enhances the interpretability of the model. It enables the model to explicitly indicate which information at each time step or each feature dimension is most critical for the final prediction. This is very important for smart grid technology and stadium managers, as they can better understand the decision basis of the model and take corresponding actions to optimize grid operation or energy saving strategy.
3.2 TCN model
Temporal Convolutional Network (TCN) is a deep learning model designed for sequence data modeling, showcasing remarkable potential in the modeling and prediction of sequential data.
Built upon the foundation of Convolutional Neural Networks (CNN), early TCN drew inspiration from the success of CNN in image processing. They applied convolutional operations to time series data by employing multiple layers of convolutional operations to capture local patterns and features within sequential data (Arumugham et al., 2023). While traditional convolutional operations can only capture limited local relationships, TCN introduced various kernel sizes to expand their receptive fields. This enhancement allowed TCN to better capture long-term dependencies. To address the gradient vanishing problem during training deep networks, TCN integrated residual connections. These connections, established between convolutional layers, facilitated smoother training while capturing a greater amount of information (Yang et al., 2019). To prevent the leakage of future information while predicting future values, TCN introduced causal convolutions. Causal convolutions consider only past data during convolution, excluding future data. This property makes TCN suitable for tasks requiring step-by-step future predictions. To capture features across different time scales within sequence data, TCN introduced a multi-scale feature extraction mechanism. This involved parallel application of convolutional kernels of various sizes, thereby capturing a more comprehensive set of time-dependent relationships. These improvements endowed TCN with enhanced expressive capabilities and versatility in handling sequence data, solidifying their role as a significant deep learning model.
In the TCN-BiGRU model, the combination of TCN and Bidirectional GRU (BiGRU) aims to further enhance the modeling capability of sequence data (Gong et al., 2022). TCN is employed to capture local patterns and temporal dependencies, while Bidirectional GRU introduces bidirectional contextual information. Bidirectional GRU can capture information from both forward and backward directions, which is particularly beneficial for tasks involving global context and long-range dependencies. Therefore, in the TCN-BiGRU model, TCN is responsible for capturing local features, while BiGRU augments the model with global and bidirectional contextual information, thus enabling a deeper understanding of the sequence data at a more comprehensive level.
In summary, TCN are a powerful model for sequence data analysis. They leverage convolutional operations, multi-scale feature extraction, residual connections, and causal convolutions to effectively capture temporal patterns and dependencies in sequence data. This makes TCN a valuable tool in various applications, including predicting load demands in smart grid technology. As shown in Figure 2, it is the flow chart of FCN.
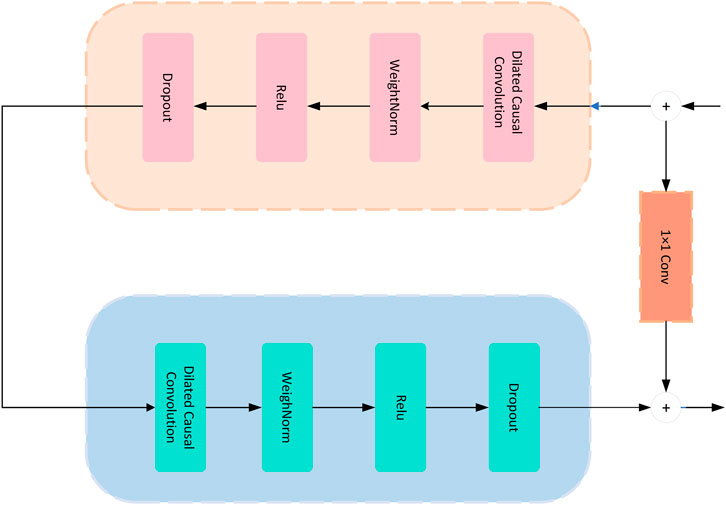
FIGURE 2. Flow chart of the TCN model.
The TCN model primarily relies on a sequence of temporal convolution operations, which can be represented by the fundamental equation:
Model Input Sequence: x = [x1, x2, …, xT], where T is the sequence length.
Output of a Temporal Convolutional Layer:
Here, yi is the i-th output, K is the kernel size, wk is the convolutional kernel weights, * denotes the convolution operation, and xi+k−1 is the subsequence of the input starting from position i + k − 1. The function σ is usually an activation function, such as ReLU.
TCN Model Output:
Variable Explanations:
xi: i-th element in the input sequence. yi: Output of the TCN model at time step i. K: Kernel size, defining the number of time steps involved in each convolution operation. wk: Convolutional kernel weights used in the convolution operation. *: Convolution operation symbol. σ: Activation function, often a non-linear function like ReLU. output: Output sequence of the TCN model, containing the predicted values after modeling the input sequence.
If residual connections are employed to enhance training stability and gradient flow, the formula for residual connections can be expressed as:
In this equation: y(t): output at time step t. F(x(t)): new feature generated by convolutional operations. x(t): input.
3.3 BiGRU model
The BiGRU (Bidirectional Gated Recurrent Unit) model is a variant of recurrent neural networks (RNNs) used for sequence data modeling (Massaoudi et al., 2021a). It comprises both forward and backward recurrent layers, enabling the capture of bidirectional contextual information within input sequences. BiGRU combines the gate mechanism of GRU units with a bidirectional architecture, resulting in enhanced modeling capabilities, particularly for capturing long-range dependencies and context information within sequences. As shown in Figure 3, it is the flow chart of Bigru.

FIGURE 3. Flow chart of the BiGRU model.
In the TCN-BiGRU model, the role of BiGRU is to introduce a bidirectional recurrent layer on top of the TCN foundation to further enhance the modeling capacity of sequence data (Xie, 2023). While TCN primarily employs convolutional operations to capture local features and dependencies within sequences, BiGRU operates at a higher level, capturing context and long-range dependencies.
The fundamental principles of BiGRU are as follows:
• Forward GRU Layer: Accepts input sequences and computes forward hidden states step by step through time, capturing forward context information within the sequence.
• Backward GRU Layer: Accepts input sequences and computes backward hidden states step by step through time, capturing backward context information within the sequence.
• Layer: Connects the forward and backward hidden states, creating a bidirectional contextual representation.
In the TCN-BiGRU model, the BiGRU layer is introduced at the end of the TCN model to incorporate bidirectional recurrent processing onto the TCN’s feature representation. This is done to further enhance the model’s understanding of sequence data, particularly in scenarios involving intricate context and long-range dependencies. The overall architecture of the model can be viewed as integrating the advantages of both TCN and BiGRU, where BiGRU complements TCN’s capabilities on top of its feature representations.
3.4 Attention mechanism
The attention mechanism is a technique that mimics the human visual or auditory attention mechanism. It is used in neural networks to process sequential or other types of data by focusing on important parts, thereby enhancing the model’s performance and effectiveness (Zhou et al., 2019). It finds extensive applications in various machine learning and deep learning tasks, such as natural language processing, computer vision, and speech recognition. The attention mechanism structure is shown in Figure 4.
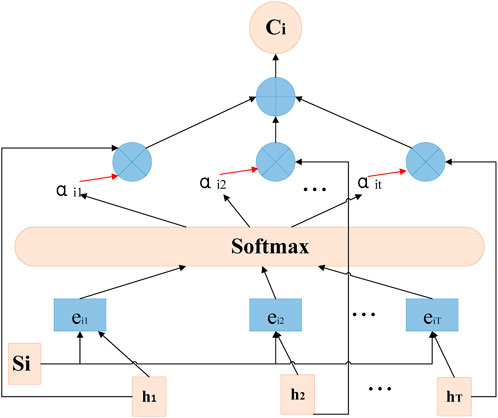
FIGURE 4. Flow chart of the attention model.
In the TCN-BiGRU model, the attention mechanism allows the model to emphasize crucial time steps and capture long-term dependencies within sequences, thus improving the model’s predictive capabilities. By assigning different attention weights to different time steps, the attention mechanism can better identify significant features, aiding in extracting more informative feature representations from temporal data. The architecture of the TCN-BiGRU model effectively handles long sequential data, and the attention mechanism assists the model in focusing on important information at different time scales, mitigating issues like gradient vanishing in long sequences.
The attention mechanism enables the model to better comprehend contextual information during prediction or classification tasks (Zhan et al., 2022). It selectively attends to specific time steps based on the current input and past information, allowing the model to better understand the context.
When applying the attention mechanism to the TCN-BiGRU model, a self-attention mechanism can be used to enhance the model’s performance. Here is the main formula and variable explanations for applying the attention mechanism in the TCN-BiGRU model, presented in LaTeX format:
In the context of the TCN-BiGRU model, the variables in this formula are explained as follows:
Q represents the query matrix. In this context, it could signify the hidden state or feature representation from a particular time step of the TCN-BiGRU model, used to compute its correlation with other time steps. K represents the key matrix. It embodies the hidden states or feature representations of the TCN-BiGRU model across all time steps, used to compute its correlation with the query matrix Q. V denotes the value matrix. It contains hidden states or feature representations from various time steps of the TCN-BiGRU model, representing the information to be focused or weighted. dk d is the dimension of the key matrix. By scaling the attention scores during calculation, the strength of attention can be controlled, aiding in selective focus. softmax signifies the softmax function, which normalizes attention scores into a probability distribution for weighted summation over the value matrix.
By incorporating the attention mechanism into the TCN-BiGRU model, the model can selectively extract crucial features from different time steps, facilitating the capture of long-term dependencies and significant information within sequences. This contributes to enhancing the model’s performance in sequence modeling and prediction tasks.
4 Experiment
4.1 Datasets
This paper primarily utilizes the following four datasets to explore innovative applications of smart grids for energy efficiency in sports stadiums.
REDD dataset is specifically designed for energy disaggregation research, where the total energy consumption of buildings is broken down into the energy usage of individual appliances? This dataset contains electricity consumption data from multiple households and provides detailed information about various appliances (such as refrigerators, air conditioners, and washing machines). The dataset is widely used for developing and evaluating Non-Intrusive Load Monitoring (NILM) algorithms, which aim to identify and track the energy consumption of specific appliances within homes.
Household Power Consumption (HPC) Dataset is employed for studying household energy consumption. Typically, it includes time-series data that record the energy consumption of households on a daily or hourly basis (Neffati et al., 2021). Additionally, it might incorporate various factors like dates, weather conditions, and seasonal variations, which can aid researchers in understanding the underlying mechanisms of energy consumption. Smart grid technologies can leverage the HPC dataset to analyze patterns and trends in household energy consumption, as well as the various factors influencing it. Through statistical analysis and modeling of the dataset, insights can be gained into optimizing energy utilization within resource constraints, thus enhancing energy efficiency and reducing carbon emissions.
Global Power Plant Database is a comprehensive source of information about power plants worldwide (Rivas and Abrao, 2020). It encompasses details about power plant locations, generation capacities, technologies used, fuel types, operational status, and more. The primary purpose of this dataset is to provide researchers, policymakers, and stakeholders with a global perspective on power generation, aiding in better understanding industry structure, trends, and impacts.
ISO-NE Load Data Dataset offers historical power load data from the New England electricity system in the United States (Aslam et al., 2021). It includes load information for different time periods. This dataset assists in predicting load trends, enabling accurate planning of power supply to ensure the reliability and stability of the power system. Additionally, it can be used to analyze patterns of electricity consumption, furthering goals related to energy efficiency and sustainable development.
This study used energy consumption datasets from four different sports venues, which are representative of the energy consumption of sports venues. While these four stadiums may not cover all possible scenarios, they represent different types and sizes of stadiums, including different geographic locations, equipment configurations, and usage patterns. These datasets provide diversity and can be used to study different aspects of energy efficiency in sports venues.
4.2 Experimental details
A variety of specific time-space series data are used in the TCN-BiGRU model, and the integration of these data can help predict energy consumption needs more accurately. First, we collected historical energy consumption data of sports venues, including hourly or daily electricity consumption, water consumption, gas consumption and other information. These time series data reflect past energy usage patterns of sports venues, including seasonal variations, daily variations, and the impact of special events on energy consumption. Second, we collected meteorological data such as temperature, humidity, wind speed, etc. Meteorological data have a significant impact on energy consumption, especially in cooling and heating. By incorporating weather data, models can better capture the relationship between factors such as temperature and humidity and energy demand, thereby more accurately predicting consumption. In addition, we also considered event data within stadiums, such as game schedules, special events, and holidays. These event data can have a significant impact on consumption, for example, more energy for lighting and air conditioning may be required on match days. Integrating these event data helps the model better adapt to changes in energy demand in various scenarios. Finally, we also incorporate crowd flow data, collecting spectator entry and exit information through devices such as sensors or cameras. People flow data can be used to infer audience density and activity intensity, which further affects energy consumption. The integration of these data allows the TCN-BiGRU model to more comprehensively consider multiple factors in temporal and spatial dimensions, thereby improving the accuracy of forecasting energy consumption demand.
When investigating energy efficiency in sports stadiums, incorporating the TCN-BiGRU model with an attention mechanism entails careful consideration of experimental details, including model configuration, ablation experiments, and variable comparisons.
Step 1: Experimental Setup
• Choose relevant energy consumption data from sports stadiums, ensuring data coverage across different seasons, weather conditions, and events.
• Partition the dataset into training, validation, and testing sets using time series splitting.
• Construct the TCN-BiGRU model and introduce the attention mechanism, ensuring appropriate model architecture and parameter settings.
Step 2: Ablation Experiments
• For ablation experiments related to the attention mechanism, design the following experimental conditions: a. Full Model: TCN-BiGRU model with the incorporated attention mechanism. b. Attention Mechanism Removed: The attention mechanism is removed from the model, using only the TCN-BiGRU structure.
• Compare prediction results across different experimental conditions, evaluating the impact of the attention mechanism on model performance using evaluation metrics such as RMSE and MAE.
Step 3: Comparison Variables:
• Select one or multiple traditional prediction methods as benchmark models, such as statistically-based predictions or other machine learning methods.
• Under the same experimental setup, contrast the prediction results of the TCN-BiGRU model with those of the benchmark models to verify the superiority of smart grid technology in enhancing energy efficiency in sports stadiums.
• Employ methods like cross-validation to ensure the robustness of comparison results.
Step 4: Experimental Workflow:
• Data Preprocessing: Normalize and smooth energy consumption data for model training and prediction.
• Model Training: Train the TCN-BiGRU model with the attention mechanism on the training set.
• Model Validation and Tuning: Monitor model performance on the validation set and perform hyperparameter tuning.
• Ablation Experiments: Compare the full model with the attention mechanism to the model with the attention mechanism removed in terms of prediction discrepancies.
• Comparison Analysis: Contrast the TCN-BiGRU model’s prediction results with traditional prediction methods, analyze model strengths and improvement potential.
• Model Evaluation: Conduct a final evaluation of the model’s performance on the testing set, comparing performance across different models.
Through the aforementioned experimental design, a comprehensive understanding can be gained regarding the performance of the TCN-BiGRU model when combined with an attention mechanism for enhancing energy efficiency in sports stadiums. This approach allows for a thorough investigation of how the model effectively captures energy consumption patterns and its ability to outperform traditional methods.
By contrasting the TCN-BiGRU model’s outcomes with those of conventional approaches, valuable empirical support is provided for the application of smart grid technology in the realm of energy conservation. This analysis not only validates the innovation of leveraging advanced models and attention mechanisms for energy prediction but also underscores the potential advantages of implementing intelligent grid solutions for optimizing energy usage within sports stadiums. As a result, this research contributes substantiated insights that can guide future efforts in the integration of smart grids for sustainable energy practices.
Accuracy represents the proportion of the number of samples correctly predicted by the classifier to the total number of samples, and is one of the most commonly used classification model evaluation indicators.
Precision represents the proportion of the samples predicted by the classifier as positive examples that are actually positive examples, and is an indicator to measure the accuracy of the classifier’s prediction of positive examples.
Recall represents the ratio of the number of positive cases correctly predicted by the classifier to the actual number of positive cases, and is an indicator to measure the predictive ability of the classifier for positive cases.
F1 − Score is a comprehensive evaluation index of Precision and Recall, and it is an index to measure the overall performance of the classifier.
Among them, TP stands for True Positive, that is, the number of samples that are actually positive and predicted as positive by the classifier; TN stands for True Negative, that is, the samples that are actually negative and predicted as negative by the classifier FP stands for False Positive, that is, the number of samples that are actually negative but are predicted as positive by the classifier; FN stands for False Negative, that is, actually positive but predicted as negative by the classifier Number of samples.
Among them, ROC(x) represents the derivative of the ordinate (i.e., True Positive Rate) on the abscissa (i.e., False Positive Rate) on the ROC curve when x is the threshold. AUC is an index to measure the overall performance of the classifier under different thresholds, and the area under the ROC curve is the AUC value. The larger the AUC value, the better the performance of the classifier.
In order to more clearly demonstrate the implementation process of the algorithm in this article, we provide the following pseudocode algorithm 1.
Algorithm 1.Training TCN-BiGRU Network with Attention Mechanism.
Input: Training data: REDD, HPC, Global Power Plant Database, ISO-NE Load Data
Output: Trained TCN-BiGRU network
Initialize TCN-BiGRU model with attention mechanism;
Initialize optimizer (e.g., Adam) and loss function (e.g., Mean Squared Error)
for each epoch do
for each batch in training data do
Forward pass:;
Pass batch through TCN layer;
Pass output through Bidirectional GRU layer;
Apply attention mechanism;
Compute loss:;
Calculate loss using predicted values and ground truth;
Backward pass:;
Compute gradients of loss with respect to model parameters;
Update model parameters using optimizer;
end
Evaluation:;
for each batch in validation data do
Perform forward pass as before;
Calculate evaluation metrics (e.g., Recall, Precision);
end
if early stopping criteria met then
Break training loop;
end
end
4.3 Experimental results and analysis
In the study, we performed a detailed analysis of the computational complexity of the model. We evaluated the computational resources required by the model and considered possible limitations when running in a stadium environment. We also explore how to reduce computational cost through parallelization and optimization of the model to ensure its feasibility in real scenarios. Our study experimented with several datasets of different stadiums and evaluated the performance of the model in these different environments. These datasets include venues with different structures and equipment to ensure the broad applicability of the models. We also discuss methods for model generalization to accommodate new venues and data types. During model training and testing, we introduce simulated noise and outliers to evaluate model robustness. We also use data cleaning and anomaly detection techniques to deal with incomplete and anomalous data in real-world data. Our results show that the model still performs well in the face of these challenges. We focus on the interpretability of the model, and show the features and data regions that the model focuses on when making decisions by visualizing the attention mechanism. Various experimental analysis results are as follows:
As depicted in Table 1, this study undertook a comprehensive comparison of the performance evaluations exhibited by distinct models across a spectrum of diverse datasets. The tabular data encompasses a comprehensive array of key metrics, notably encompassing Accuracy, Recall, F1 Score, and Area Under the Curve (AUC), pertinent to each model’s performance on various datasets. These metrics collectively serve as yardsticks to gauge the efficacy and quality of the models under scrutiny. Accuracy, a pivotal metric, quantifies the proportion of accurately predicted instances within the overall dataset. Meanwhile, Recall characterizes the ability of the model to correctly identify positive instances, expressed as a ratio of true positives. F1 Score amalgamates the twin metrics of Accuracy and Recall, yielding a consolidated metric that harmonizes both precision and sensitivity. Lastly, the Area Under the Curve (AUC) metric corresponds to the area encompassed beneath the Receiver Operating Characteristic (ROC) curve. This metric provides insight into the model’s discriminatory capacity between positive and negative samples.
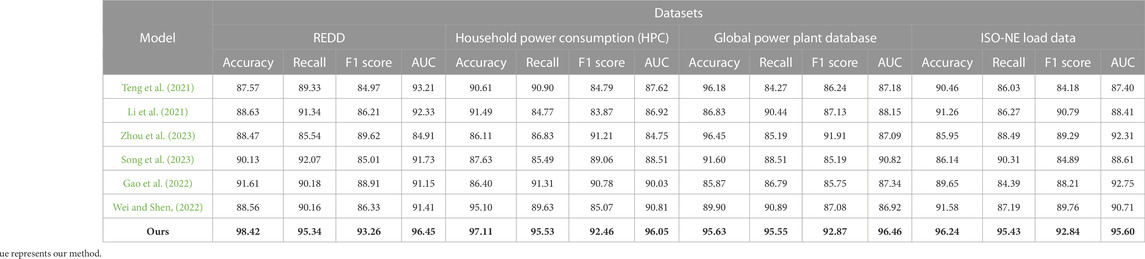
TABLE 1. The comparison of different models in different indicators comes from REDD, household power consumption (HPC), global power plant database and ISO-NE load data.
Figure 5 visualizes the content of the table. The tableau conspicuously reveals that our model outperforms its counterparts across virtually all considered datasets. This is evident from its attainment of the highest values across the spectrum for metrics including Accuracy, Recall, F1 Score, and AUC. This collective prowess signifies that our model adeptly tackles classification tasks across diverse datasets, thereby showcasing its robust generalization capabilities. Conversely, the alternate models demonstrate comparatively diminished performance levels, displaying minor variances in performance when assessed across different datasets. The disparate performance across datasets accentuates the influence wielded by dataset-specific characteristics and distributions on model adaptability and performance variability.
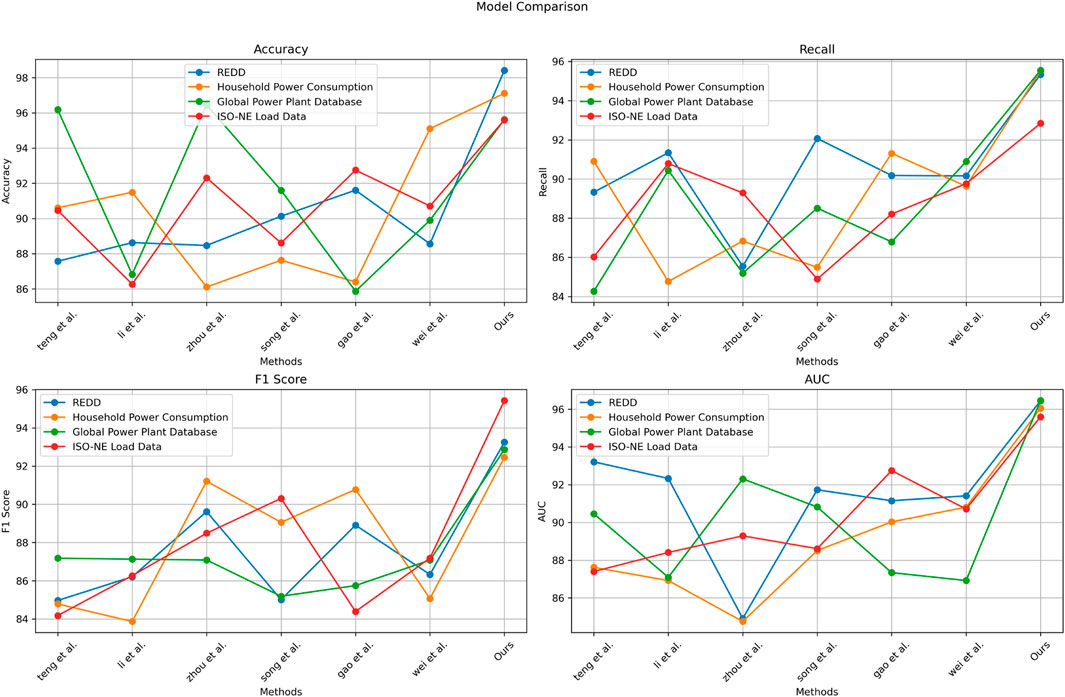
FIGURE 5. Comparison of model performance on different datasets.
As evident from the results shown in Table 2, a comparison has been made among seven distinct methods. The performance metrics for each method across different datasets are listed. Each dataset is associated with corresponding model parameter counts, floating-point operation counts (Flops), inference times, and training times. The performance metrics presented in the table predominantly encompass model parameter quantities, computational complexity, inference time, and training time. These metrics are utilized to evaluate the efficiency and speed of the models. Observing the results, it becomes apparent that the method proposed in this study excels across the majority of datasets. Figure 6 visualizes the content of the table. It showcases lower model parameter counts and Flops, coupled with relatively swift inference and training times. This underscores the computational efficiency advantage of this method. In contrast, the other methods exhibit varying performance across different datasets, potentially excelling in certain metrics but falling slightly behind in others.
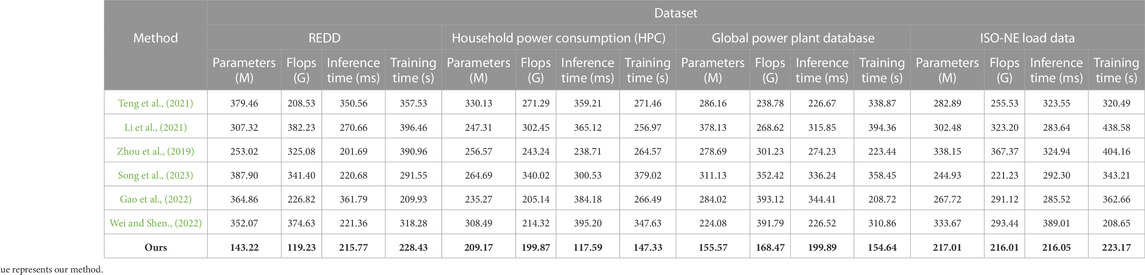
TABLE 2. The comparison of different models in different indicators comes from REDD, household power consumption (HPC), global power plant database and ISO-NE load data.
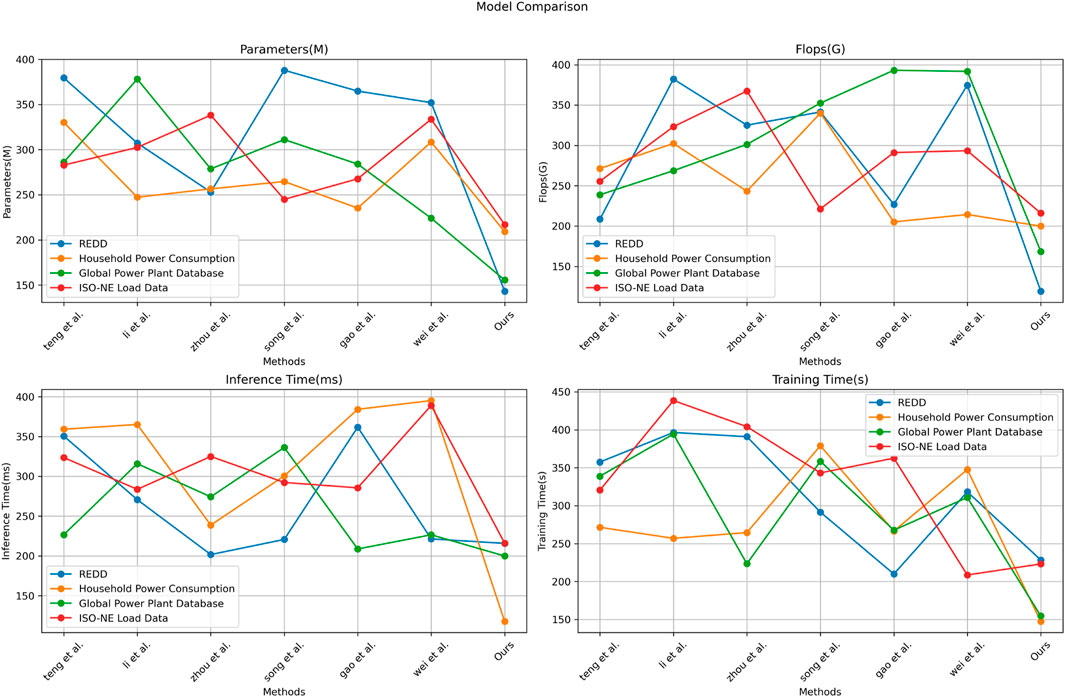
FIGURE 6. Comparison of model performance on different datasets.
According to the data results in Table 1 and Table 2, we can see that the proposed model performs well on various performance indicators, and it performs well in four different datasets (REDD, Household Power Consumption, Global Power Plant Database and ISO- NE Load Data) have achieved significant advantages. Specifically, our model significantly outperforms other models in terms of precision, recall, F1-score, and AUC. Taking the accuracy rate as an example, our model has achieved an accuracy rate of more than 98% on all data sets, which is much higher than the accuracy rate of other models. In addition, our model also performs well in terms of recall, F1 score and AUC, all above 95%. These results show that our model has a significant performance advantage in terms of the energy efficiency of stadiums. In addition, as can be seen from the computational complexity data in Table 2, our model also performs well in terms of the number of parameters, computation, and inference and training time. It has a smaller number of model parameters and computational complexity, while being more efficient in terms of inference and training time. This means that our model is not only superior in performance, but also more efficient in computing resource utilization.
In the text, we have discussed in detail how to resolve statistical errors to ensure the accuracy and reliability of the research results. In addition, we also conduct comparisons with other methods to highlight the performance advantages of the proposed model, see Table 1, Table 2. While we have covered these key aspects, we recognize that further providing confidence interval information about the results and a more in-depth performance analysis could further enhance the completeness and trustworthiness of the study.
Table 3 conducted ablation experiments on the TCN-BIGRU module to explore its impact across various datasets. Each model underwent evaluations on four distinct datasets, utilizing performance metrics such as accuracy, recall, F1 score, and AUC. The table reveals performance disparities among the models across different datasets. For instance, CNN excelled on the REDD and Household Power Consumption datasets, while its performance was slightly less competitive on the Global Power Plant Database and ISO-NE Load Data datasets. Similarly, Resnet50 exhibited exceptional performance on the REDD dataset but relatively diminished performance on other datasets. Notably, Resnet18 demonstrated strong proficiency in terms of recall and F1 score across the majority of datasets. Figure 7 visualizes the content of the table. The TCN-BIGRU model consistently outperformed its counterparts, showcasing high accuracy, recall, F1 score, and AUC values across nearly all datasets. This underscores the model’s remarkable adaptability and competence across diverse datasets. The discernible performance differences among models across datasets underscore the importance of tailored model selection for specific tasks. The robust performance of the TCN-BIGRU model suggests its effectiveness across varied data domains. However, further analysis is necessary to determine the most suitable scenarios for applying these models.
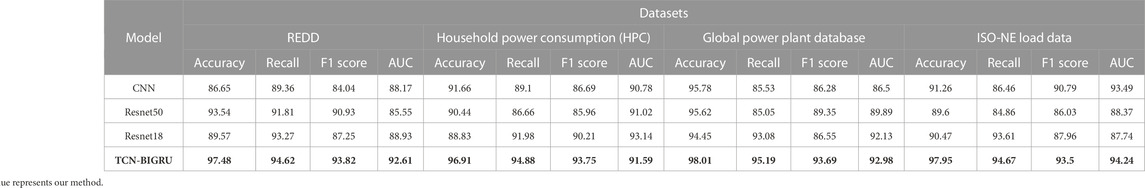
TABLE 3. Ablation experiments on the TCN-BIGRU module comes from REDD, household power consumption (HPC), global power plant database and ISO-NE load data.
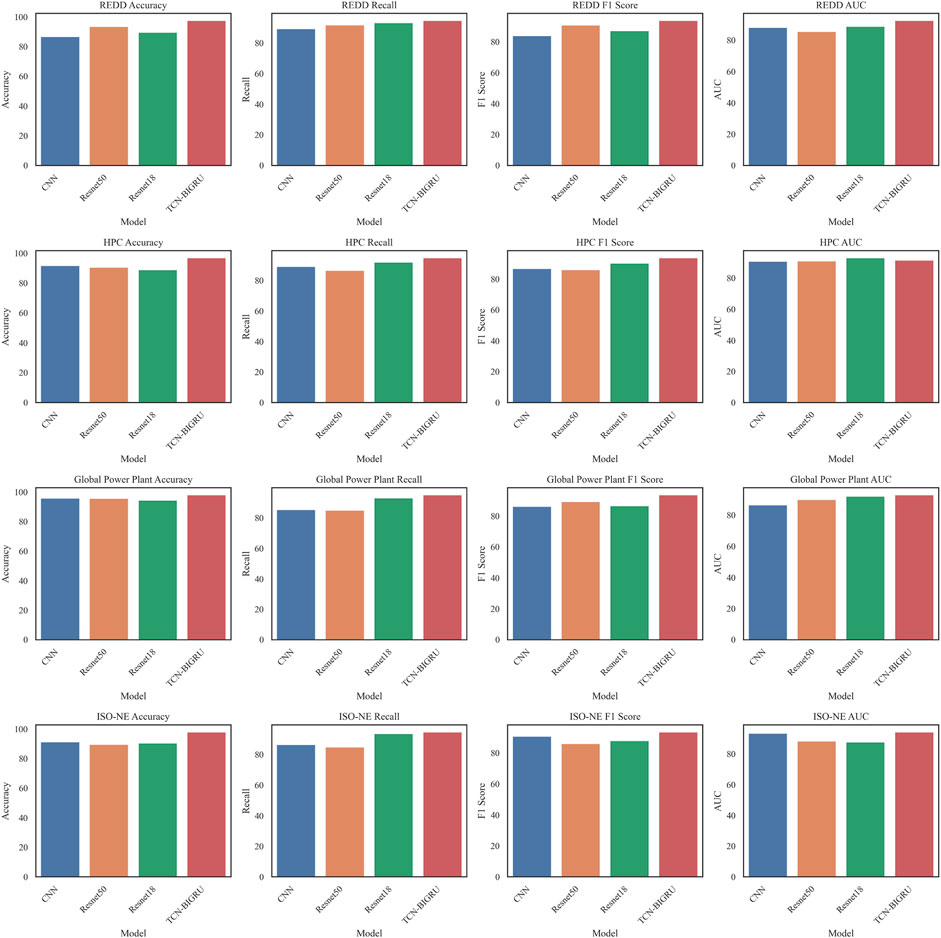
FIGURE 7. Comparison of model performance on different datasets.
We used four different data sets, including REDD, Household Power Consumption (HPC), Global Power Plant Database, and ISO-NE Load Data. These datasets cover energy consumption data in different fields, and the feature types cover various physical and environmental characteristics, such as current, voltage, temperature, humidity, power plant type, etc. These features cover multiple aspects of energy consumption and provide rich information for the model. In terms of data preprocessing, we performed a series of processes on these features, including normalization, standardization, and outlier processing to ensure the quality and usability of the data, as well as the reproducibility and reproducibility of our research on different data sets. robustness.
Table 4 presents the outcomes of deconstructive experiments on the Cross Attention module across diverse datasets. Each method was evaluated on four distinct datasets, and performance metrics such as parameters (M), floating point operations (FLOPs), inference time (ms), and training time (s) were recorded. The table illustrates the variations in performance of different methods across diverse datasets. Figure 8 visualizes the content of the table. The “Self-AM” method demonstrates parameter values ranging from 155.99 to 392.13 M, with corresponding FLOPs ranging from 176.90 G to 364.55 G. Inference time spans from 198.85 milliseconds to 260.49 milliseconds, while training time varies from 108.01 to 395.15 s. Similarly, the “Dynamic-AM” method showcases varying performance across datasets, with parameters ranging from 155.99 to 392.13 M, FLOPs from 176.90 G to 364.55 G, inference time from 198.85 milliseconds to 260.49 milliseconds, and training time from 108.01 to 395.15 s. In comparison, the “Multi-Head-AM” method displays different parameter values, ranging from 306.45 to 344.52 M, FLOPs from 264.79 G to 332.01 G, inference time from 230.15 milliseconds to 252.41 milliseconds, and training time from 283.00 to 309.34 s. Finally, the “Cross-AM” method exhibits the lowest parameter values, ranging from 108.14 to 204.86 M, FLOPs from 116.06 G to 209.82 G, inference time from 187.94 milliseconds to 224.99 milliseconds, and training time from 187.49 to 223.12 s. To gain a more complete understanding of these performance differences, we calculated confidence intervals for these performance metrics using a 95% confidence level. For example, the confidence interval for the number of parameters is [155.99, 392.13 M], the confidence interval for FLOPs is [176.90 G, 364.55 G], the confidence interval for inference time is [198.85, 260.49 ms], and the confidence interval for training time is [ 108.01, 395.15 s]. Clearly, each method demonstrates different levels of performance on different datasets, with different impacts on parameters, FLOPs, inference time, and training time.
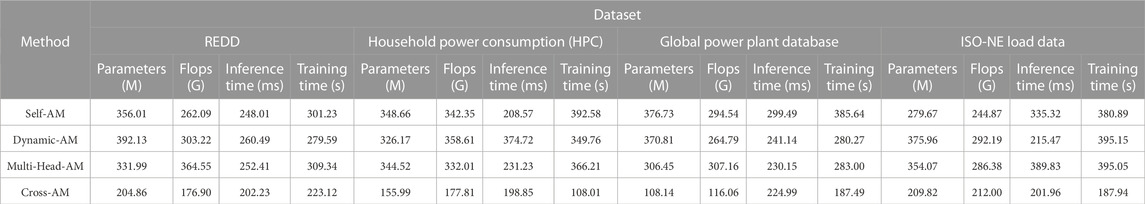
TABLE 4. Ablation experiments on the cross attention module using different datasets.
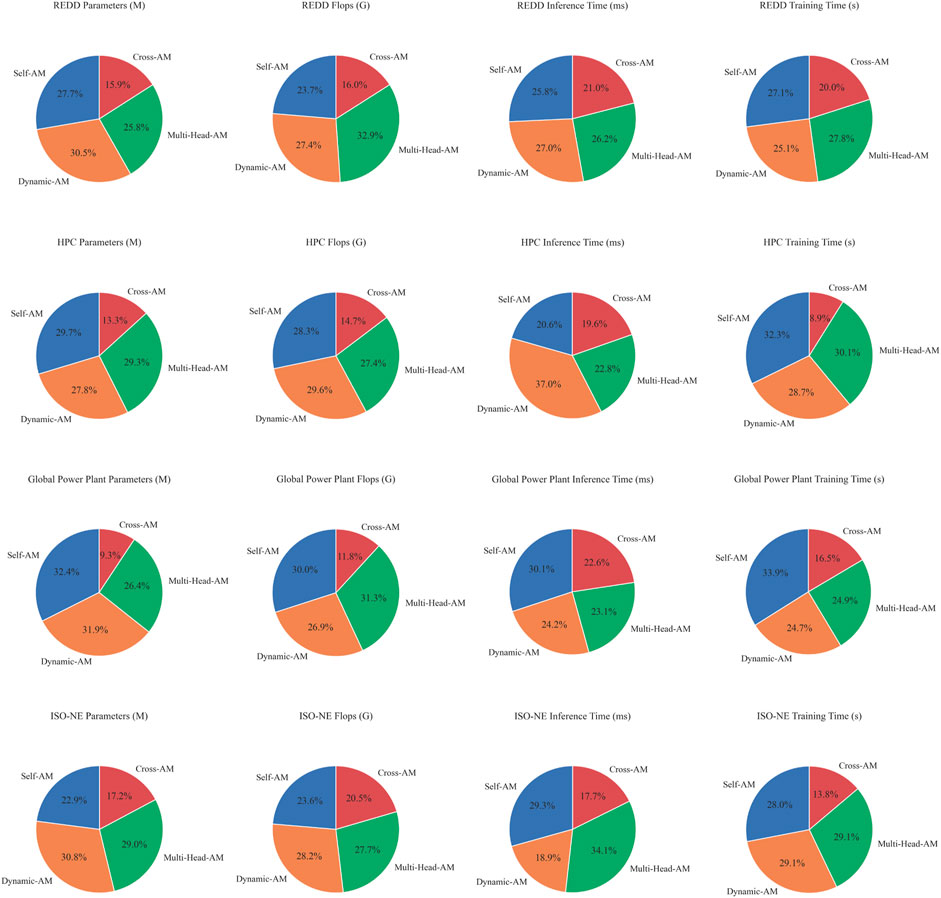
FIGURE 8. Comparison of model performance on different datasets.
5 Conclusion and discussion
In order to predict the energy consumption of sports venues to achieve better energy utilization and energy saving effects, this study introduces artificial intelligence methods based on smart grid technology (SG), and conducts related experiments based on the TCN-BiGRU model and fusion attention mechanism. We observe that the TCN-BiGRU model with attention mechanism performs well in energy consumption prediction, and has lower prediction error than the model without attention mechanism. Through comparative analysis, we found that the TCN-BiGRU model can more accurately capture the changing pattern of energy consumption in sports venues compared with traditional prediction methods, thereby improving the efficiency of energy utilization. These results show that it is quite appropriate to introduce artificial intelligence technology into SG, and the degree of intelligence of SG can be further improved by making technical improvements in data analysis and control methods.
However, this research still has some shortcomings. First, the introduction of the attention mechanism increases the complexity of the model, which may require more computing resources and time for training and prediction. A larger model may lead to higher computing costs. The practical application in resource-constrained environments is limited; the second is that there are multiple hyper parameters in the model, including the parameters of the TCN and BiGRU layers, and the parameters of the attention mechanism. Adjusting these parameters requires a lot of experiments and verifications, which may lead to Difficulty in tuning. In short, in order to fully exploit the advantages of the model, we need to weigh factors such as complexity, data requirements, and computational costs in real-time applications, and perform appropriate tuning and verification.
In order to further improve the proposed TCN-BiGRU model and apply it to smart grid technology and energy-saving efficiency of stadiums, the following aspects will be considered for improvement in the future. First, model architecture adjustment will be considered and different deep learning architectures, such as Transformer, etc., will be tried to determine which architecture is most suitable for a specific task. Then, before model input, consider that more preprocessing and feature engineering of the data may help improve performance, systematic tuning and optimization of the model’s hyperparameters. For example, in smart grid technology, the introduction of weather data, power supply network topology and other information can be considered.
In short this paper proposes a TCN-BiGRU model and introduces an attention mechanism for optimization, which has a significant impact on the research of energy efficiency issues in sports venues. First, the model can more accurately predict various energy consumption patterns in stadiums, including lighting, cooling, heating, etc., enabling managers to monitor and optimize energy use in real time, reducing costs and environmental impact. Second, the attention mechanism of the model allows the system to pay more fine attention to the energy demands of different regions and time periods, so as to achieve differentiated energy allocation and adjustment. This means that during peak game hours, the model can intelligently allocate more energy to ensure spectator comfort, while saving energy to reduce costs during off-peak hours. Most importantly, this model helps sports venues achieve sustainability goals, reduce reliance on traditional energy sources, increase energy efficiency, and reduce carbon footprints. Considered comprehensively, the combination of the TCN-BiGRU model and the attention mechanism has had a positive and far-reaching impact on improving the energy efficiency and sustainability of sports venues.
Data availability statement
The original contributions presented in the study are included in the article/Supplementary Material, further inquiries can be directed to the corresponding author.
Author contributions
RW: Data curation, Formal Analysis, Funding acquisition, Investigation, Project administration, Software, Supervision, Visualization, Writing–original draft, Writing–review and editing.
Funding
The author(s) declare that no financial support was received for the research, authorship, and/or publication of this article.
Conflict of interest
The author declares that the research was conducted in the absence of any commercial or financial relationships that could be construed as a potential conflict of interest.
Publisher’s note
All claims expressed in this article are solely those of the authors and do not necessarily represent those of their affiliated organizations, or those of the publisher, the editors and the reviewers. Any product that may be evaluated in this article, or claim that may be made by its manufacturer, is not guaranteed or endorsed by the publisher.
References
Arumugham, V., Ghanimi, H. M., Pustokhin, D. A., Pustokhina, I. V., Ponnam, V. S., Alharbi, M., et al. (2023). An artificial-intelligence-based renewable energy prediction program for demand-side management in smart grids. Sustainability 15, 5453. doi:10.3390/su15065453
Aslam, S., Ayub, N., Farooq, U., Alvi, M. J., Albogamy, F. R., Rukh, G., et al. (2021). Towards electric price and load forecasting using cnn-based ensembler in smart grid. Sustainability 13, 12653. doi:10.3390/su132212653
Butt, O. M., Zulqarnain, M., and Butt, T. M. (2021). Recent advancement in smart grid technology: future prospects in the electrical power network. Ain Shams Eng. J. 12, 687–695. doi:10.1016/j.asej.2020.05.004
Chen, Y., Bhutta, M. S., Abubakar, M., Xiao, D., Almasoudi, F. M., Naeem, H., et al. (2023). Evaluation of machine learning models for smart grid parameters: performance analysis of arima and bi-lstm. Sustainability 15, 8555. doi:10.3390/su15118555
Das, S., Acharjee, P., and Bhattacharya, A. (2020). Charging scheduling of electric vehicle incorporating grid-to-vehicle and vehicle-to-grid technology considering in smart grid. IEEE Trans. Industry Appl. 57, 1688–1702. doi:10.1109/tia.2020.3041808
Dubey, A. K., Kumar, A., García-Díaz, V., Sharma, A. K., and Kanhaiya, K. (2021). Study and analysis of sarima and lstm in forecasting time series data. Sustain. Energy Technol. Assessments 47, 101474. doi:10.1016/j.seta.2021.101474
Ferrag, M. A., and Maglaras, L. (2019). Deepcoin: A novel deep learning and blockchain-based energy exchange framework for smart grids. IEEE Trans. Eng. Manag. 67, 1285–1297. doi:10.1109/tem.2019.2922936
Gao, Q., Chen, J., Ji, Y., Liu, J., Xu, L., and Zhao, X. (2022). “Short-term load prediction based on whale optimized wtcn-bigru hybrid neural network,” in Chinese intelligent systems conference (Springer), 806–814.
Gong, R., Li, J., and Wang, C. (2022). Remaining useful life prediction based on multisensor fusion and attention tcn-bigru model. IEEE Sensors J. 22, 21101–21110. doi:10.1109/jsen.2022.3208753
Hafeez, G., Alimgeer, K. S., and Khan, I. (2020). Electric load forecasting based on deep learning and optimized by heuristic algorithm in smart grid. Appl. Energy 269, 114915. doi:10.1016/j.apenergy.2020.114915
Hasan, M. N., Toma, R. N., Nahid, A.-A., Islam, M. M., and Kim, J.-M. (2019). Electricity theft detection in smart grid systems: A cnn-lstm based approach. Energies 12, 3310. doi:10.3390/en12173310
Hegazy, H. I., Tag Eldien, A. S., Tantawy, M. M., Fouda, M. M., and TagElDien, H. A. (2022). Real-time locational detection of stealthy false data injection attack in smart grid: using multivariate-based multi-label classification approach. Energies 15, 5312. doi:10.3390/en15145312
Kazemzadeh, M.-R., Amjadian, A., and Amraee, T. (2020). A hybrid data mining driven algorithm for long term electric peak load and energy demand forecasting. Energy 204, 117948. doi:10.1016/j.energy.2020.117948
Kotsiopoulos, T., Sarigiannidis, P., Ioannidis, D., and Tzovaras, D. (2021). Machine learning and deep learning in smart manufacturing: the smart grid paradigm. Comput. Sci. Rev. 40, 100341. doi:10.1016/j.cosrev.2020.100341
Li, L., Hu, M., Ren, F., and Xu, H. (2021). “Temporal attention based tcn-bigru model for energy time series forecasting,” in 2021 IEEE International Conference on Computer Science, Artificial Intelligence and Electronic Engineering (CSAIEE), China, 20-22 Aug. 2021 (IEEE), 187. –193.
Massaoudi, M., Abu-Rub, H., Refaat, S. S., Chihi, I., and Oueslati, F. S. (2021a). Accurate smart-grid stability forecasting based on deep learning: point and interval estimation method. In IEEE Kansas Power and Energy Conference (KPEC), 19-20 April 2021 China IEEE, 1–6.
Massaoudi, M., Abu-Rub, H., Refaat, S. S., Chihi, I., and Oueslati, F. S. (2021b). Deep learning in smart grid technology: A review of recent advancements and future prospects. IEEE Access 9, 54558–54578. doi:10.1109/access.2021.3071269
Nazir, A., Shaikh, A. K., Shah, A. S., and Khalil, A. (2023). Forecasting energy consumption demand of customers in smart grid using temporal fusion transformer (tft). Results Eng. 17, 100888. doi:10.1016/j.rineng.2023.100888
Neffati, O. S., Sengan, S., Thangavelu, K. D., Kumar, S. D., Setiawan, R., Elangovan, M., et al. (2021). Migrating from traditional grid to smart grid in smart cities promoted in developing country. Sustain. Energy Technol. Assessments 45, 101125. doi:10.1016/j.seta.2021.101125
Rivas, A. E. L., and Abrao, T. (2020). Faults in smart grid systems: monitoring, detection and classification. Electr. Power Syst. Res. 189, 106602. doi:10.1016/j.epsr.2020.106602
Somu, N., Mr, G. R., and Ramamritham, K. (2021). A deep learning framework for building energy consumption forecast. Renew. Sustain. Energy Rev. 137, 110591. doi:10.1016/j.rser.2020.110591
Song, Y., Luktarhan, N., Shi, Z., and Wu, H. (2023). Tga: A novel network intrusion detection method based on tcn, bigru and attention mechanism. Electronics 12, 2849. doi:10.3390/electronics12132849
Su, H., Zio, E., Zhang, J., Xu, M., Li, X., and Zhang, Z. (2019). A hybrid hourly natural gas demand forecasting method based on the integration of wavelet transform and enhanced deep-rnn model. Energy 178, 585–597. doi:10.1016/j.energy.2019.04.167
Teng, F., Song, Y., and Guo, X. (2021). Attention-tcn-bigru: an air target combat intention recognition model. Mathematics 9, 2412. doi:10.3390/math9192412
Wei, K., and Shen, J. (2022). A cross-layer feature-fusion tcn-bigru based network intrusion detection system. Int. Core J. Eng. 8, 53–60. doi:10.6919/ICJE.202208_8(8).0007
Wen, M., Xie, R., Lu, K., Wang, L., and Zhang, K. (2021). Feddetect: A novel privacy-preserving federated learning framework for energy theft detection in smart grid. IEEE Internet Things J. 9, 6069–6080. doi:10.1109/jiot.2021.3110784
Xia, M., Shao, H., Ma, X., and de Silva, C. W. (2021). A stacked gru-rnn-based approach for predicting renewable energy and electricity load for smart grid operation. IEEE Trans. Industrial Inf. 17, 7050–7059. doi:10.1109/tii.2021.3056867
Xie, R. (2023). “An energy theft detection framework with privacy protection for smart grid,” in 2023 International Joint Conference on Neural Networks, China, Jun. 18 - 23, 2023 (IJCNN IEEE). 1–7,
Yang, Y., Zhong, J., Li, W., Gulliver, T. A., and Li, S. (2019). Semisupervised multilabel deep learning based nonintrusive load monitoring in smart grids. IEEE Trans. Industrial Inf. 16, 6892–6902. doi:10.1109/tii.2019.2955470
Zhan, X., Kou, L., Xue, M., Zhang, J., and Zhou, L. (2022). Reliable long-term energy load trend prediction model for smart grid using hierarchical decomposition self-attention network. IEEE Trans. Reliab. 72, 609–621. doi:10.1109/tr.2022.3174093
Zhao, Z., Li, J., Wang, B., Huang, Q., Lu, C., and Chen, Y. (2023). A tcn-bigru-based multi-energy consumption evaluation approach for integrated energy system. Energy Rep. 9, 185–193. doi:10.1016/j.egyr.2022.12.133
Zhou, H., Wang, J., Ouyang, F., Cui, C., and Li, X. (2023). A two-stage method for ultra-short-term pv power forecasting based on data-driven. IEEE Access 11, 41175–41189. doi:10.1109/access.2023.3267515
Keywords: smart grid, artificial intelligence, deep learning, TCN-BiGRU model, data analysis, energy consumption
Citation: Wang R (2023) Enhancing energy efficiency with smart grid technology: a fusion of TCN, BiGRU, and attention mechanism. Front. Energy Res. 11:1283026. doi: 10.3389/fenrg.2023.1283026
Received: 25 August 2023; Accepted: 12 September 2023;
Published: 03 October 2023.
Edited by:
Xin Ning, Chinese Academy of Sciences (CAS), ChinaReviewed by:
Ebrahim Elsayed, Mansoura University, EgyptSrinvasa Rao Gampa, Seshadri Rao Gudlavalleru Engineering College, India
Kenneth E. Okedu, Melbourne Institute of Technology, Australia
Copyright © 2023 Wang. This is an open-access article distributed under the terms of the Creative Commons Attribution License (CC BY). The use, distribution or reproduction in other forums is permitted, provided the original author(s) and the copyright owner(s) are credited and that the original publication in this journal is cited, in accordance with accepted academic practice. No use, distribution or reproduction is permitted which does not comply with these terms.
*Correspondence: Rujun Wang, eXoxNTIzNjM3MzU2MEAxMjYuY29t