 Leqing Li
 Yongqi Li
- China Southern Power Grid Power Generation Co., Ltd., Energy Storage Research Institute, Guangzhou, China
With the rapid progression of Energy Storage Systems (ESSs), the capability of extensively distributed and heterogeneous ESSs to support the power grid remains largely underexplored. To better exploit the potential of these numerous ESSs and enhance their service to the power grid, this paper proposes a model for evaluating and aggregating the grid-support capability of energy storage clusters by considering the peak regulation requirements. To begin with, the proposed model employs subjective and objective combination weighting methods to establish a grid-support capability matrix between ESSs indicators and grid demand scenarios, thereby facilitating the identification of the ESSs with a strong ability to regulate peak power. Next, based on the dual-peak pattern of grid load and diverse characteristics of ESSs, the ESSs in the peak regulation cluster are evaluated by clustering again. In addition, taking into account the operational constraints of the ESSs and the peak regulation requirements, a grid-support capability aggregation model for energy storage clusters based on the revised Chino polytope is proposed. The case study results demonstrate that the proposed model not only balances computational efficiency and aggregation accuracy to a certain extent but also enhances the capability of energy storage clusters to participate in peak regulation of the power grid.
1 Introduction
As the integration of large-scale renewable energy sources into the power grid escalates (Hua et al., 2019; Li et al., 2023) the lack of peak-shaving performance of the power system is becoming increasingly evident (Li et al., 2019). Novel Energy Storage Systems (ESSs) are proving to be crucial assets with their innate flexibility and adaptability, playing a substantial role in achieving rapid peak shaving (Cui B. et al., 2021a). This is particularly noteworthy as their incorporation within the grid systematically amplifies (Yi et al., 2022). However, due to the numerous and diverse indicators of individual ESSs, their scattered locations, and varying support capabilities for the power grid (Zhang and Hredzak, 2021; Han and Zhang, 2022), it is challenging for individual ESSs to form effective regulatory resources and administer them in isolation (Zhao et al., 2022). Nevertheless, energy storage clusters can provide scientific decision-making basis for power system operation scheduling by managing dispersed ESSs. Therefore, to enable the overall participation of ESSs in system peak shaving, it is necessary to evaluate the grid-support capability of massive ESSs and establish an aggregation model for the energy storage clusters.
In regard to the evaluation and analysis of energy storage clusters, extensive research has been conducted, focusing remarkably on the indices associated with individual ESSs. Ding et al. (2018) propose a comprehensive performance index system that combines structural and functional aspects, as well as an improved genetic algorithm for cluster evaluation. Ding et al. (2021) introduce the cluster flexibility supply-demand balance index and flexibility balance index and combine them with the modularity index to propose an evaluation method that comprehensively considers cluster topology and flexibility balance for energy storage clusters. A distributed dynamic evaluation clustering algorithm is introduced that utilizes energy storage capacity and local demand as state features, aiming to save computational resources (Zhang et al., 2021). However, most existing research focuses on evaluating different technical indicators of ESSs without considering the varying demands of the power grid or the balance between subjectivity and objectivity, which is not conducive to energy storage to better serve the power grid. To address this gap, this paper employs subjective and objective combination weighting methods to establish a grid-support capability evaluation model for energy storage clusters based on the peak shaving demands in a dual-peak grid pattern. In the first step, a grid-support capability matrix is solved to determine the support capability of each ESS for various grid demand scenarios, facilitating the selection of peak-shaving ESSs. In the second step, a comprehensive evaluation of power, capacity, and ramping indicators is conducted, using the K-means clustering algorithm to perform evaluations on power-type and energy-type ESSs.
The aggregation of energy storage cluster grid-support capability essentially characterizes the feasible domain of cluster flexibility. Energy storage capability can be described as the feasible region of output power in all periods (Sajjad et al., 2016), which is influenced by its operational constraints and grid scheduling constraints (Zhang and Hredzak, 2021). Analyzing the feasible region of an energy storage cluster requires considering the temporal coupling characteristics, such as the time dependency of charging and discharging (Wen et al., 2022a). Directly aggregating the feasible region of an energy storage cluster may lead to the curse of dimensionality (Muller et al., 2019), while approximating solutions may reduce aggregation accuracy (Chen and Li, 2021; Ayesha et al., 2023). Thus, there is a need for an efficient and accurate method to aggregate the energy storage clusters, which will lay the foundation for their efficient participation in grid peak shaving. This paper presents a novel method for aggregating ESSs based on the grid-support capability evaluation of energy storage clusters, thereby improving the rationality and computational efficiency of the aggregation process.
Regarding the aggregation of grid-support capability for ESSs, there are primarily two approaches: top-down and bottom-up (Wang and Wu, 2021; Bhatti et al., 2023). The top-down approach directly constructs the feasible domain of a cluster through data analysis and probabilistic modeling (Yi et al., 2020). Wang and Wu (2021) propose the high-dimensional polytope based bound shrinking method to calculate the feasible region of distributed energy resources considering the network constraints. The kth-order approximate models and two types of multi-timescale approximate models are proposed to analyze the exact aggregate feasible region of ESSs. Wen et al. (2022b) propose a flexibility optimization method and a backtracking elimination method to aggregate the temporally coupled grid-support capability of ESSs considering system security constraints. Nonetheless, an inherent problem associated with these top-down approaches is that when the computational scale enlarges, there is a concomitant and substantial degradation in computational efficiency. On the other hand, the bottom-up approach describes the feasible domain of individual resources (Ma et al., 2023), followed by aggregating multiple independent operating domains into a unified whole.
A plethora of scholarly research posits that calculating the feasible domain of a cluster from a bottom-up perspective involves computing the Minkowski sum of multiple high-dimensional polytopes, for which there is no efficient general solution. Therefore, existing research mainly focuses on approximating the feasible domain using a concise and compact model. Several basic geometric shapes, such as boxes (Chen et al., 2020), ellipsoids (Chen and Li, 2021), and medians (Calero et al., 2021), have been attempted for internal approximation. Among them, the Chino polytope preserves the characteristics of the feasible domain and has high aggregation efficiency (Cui Y. et al., 2021b). However, there is a geometric difference between the Chino polytope and the original feasible domain. To address this issue, this paper proposes a feasible domain weight adjustment strategy that prioritizes the high-demand peak-shaving feasible domain portions to enhance the overall peak-shaving capability of the energy storage cluster.
In summary, the contributions of this paper are as follows:
(1) To address the issue of incomplete evaluation of energy storage clusters, this paper establishes a grid-support capability evaluation model based on peak regulation requirements, utilizing a subjective and objective combination weighting method and the K-means clustering algorithm, which facilitates a more comprehensive evaluation and set the stage for aggregation.
(2) To address the issue of impractical computational scale and low accuracy in aggregating energy storage clusters, this paper proposes a novel grid-support capability aggregation method based on the revised Chino polytope, which not only strikes a balance between computational efficiency and aggregation accuracy but also enhances the capability of energy storage clusters to participate in peak regulation.
The remaining contents of the paper are as follows: Section 2 restates the background of the research question. Section 3 introduces the grid-support capability evaluation of energy storage clusters. Section 4 proposes grid-support capability aggregation based on the revised Chino polytope. Section 5 analyzes the result through the simulation. Section 6 summarizes the whole paper and gives the conclusion.
2 Problem statement
According to the typical power load curves of various provincial power grids published by the National Development and Reform Commission and the National Energy Administration, most provincial typical daily power load curves show a clear dual-peak trend. Specifically, there is an early peak during the daytime, while a late peak occurs during the nighttime. During the daytime peak period, the load is mainly driven by residential, commercial, and industrial electricity consumption, with a longer duration of peak load. During the nighttime peak period, the load is mainly driven by residential and commercial electricity consumption, with a shorter duration of peak load. The power grid regulation requirements differ under these two modes.
The integration of a high proportion of renewable energy has become an inevitable trend in power grid development (Leng and Zhang, 2023). Meanwhile, the intermittency and volatility of renewable energy sources will become crucial factors affecting the peak-to-valley difference in the power system (Yang et al., 2023). In addition, the output adjustment range and speed of traditional energy sources such as conventional thermal power and cogeneration are limited and cannot meet the peak load regulation requirements of future power systems. Therefore, the insufficient peak load regulation capacity of the power system has become increasingly prominent under the existing energy structure. In contrast, ESSs possess strong flexibility and rapid adjustment characteristics, enabling them to effectively address the peak-shaving challenges arising from both renewable and conventional energy sources. According to the peak shaving market rules, as a third-party independent entity, ESSs are required to strictly follow the day-ahead generation schedule for their output (Nan et al., 2022). When the load curve exceeds the peak-shaving line, the ESS discharges electricity, and when the load curve falls below the valley-filling line, the ESS charges. Based on the dual-peak mode, ESSs manifest two typical discharge periods during the early and late peaks. During the daytime early peak, the load curve is relatively stable, requiring energy-type ESSs to participate in peak regulation. During the nighttime late peak, the load curve has a steep slope, requiring power-type ESSs to participate in peak regulation. Given the extensive and diverse operational indicators of individual ESSs, their disparate geographic distribution, and their differing capabilities to bolster the power grid, it is a formidable challenge to consolidate individual ESSs into effective regulatory resources. Nevertheless, clusters of ESSs can provide a scientific basis for decision-making in power system operational scheduling by proficiently managing these ESSs. Consequently, with the objective of ensuring the comprehensive participation of ESSs in system peak shaving, it becomes imperative to undertake a detailed evaluation of the grid-support potential of numerous ESSs and to develop a robust model that encapsulates the capability inherent within these ESS clusters. Figure 1 shows the illustration of the problem background.
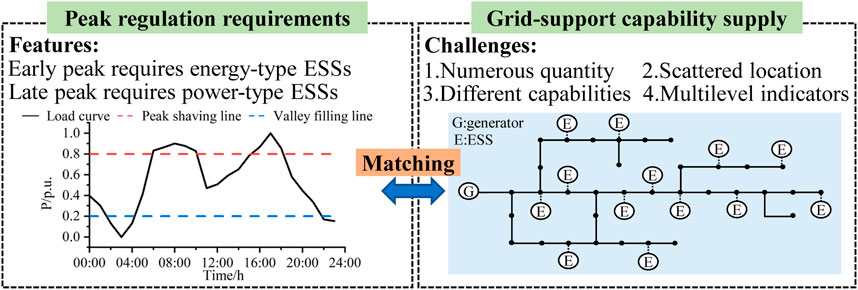
FIGURE 1. The illustration of the problem background.
To comprehensively consider the peak regulation requirements of the power grid and the operational characteristics of ESSs, this paper proposes a grid-support capability evaluation and aggregation model for energy storage clusters, based on the dual-peak mode of the power grid. This model not only optimizes computational resource utilization but also accommodates varying regulation requirements at different times, to a certain extent, improving the capability of energy storage clusters to participate in peak shaving. The illustration of the proposed evaluating and aggregating model is shown in Figure 2.
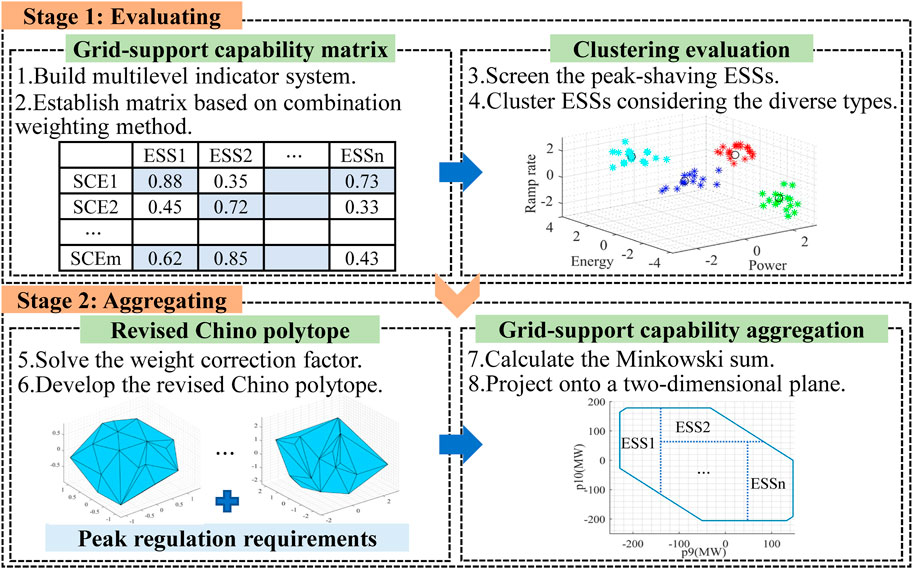
FIGURE 2. The illustration of the proposed evaluating and aggregating model.
In the first stage, a grid-support capability evaluation model for energy storage clusters is established. To begin with, a multilevel indicator system for ESSs is built, and based on this, a grid-support capability matrix is created using the combination weighting method to evaluate the compatibility between the ESSs and the grid demand scenarios. Next, we identify ESSs with strong peak-shaving support capabilities to form the selected cluster. In addition, using the power, capacity, and ramp rate as characteristic indicators, the K-means clustering algorithm is employed to conduct the second step evaluation for power-type and energy-type ESSs.
In the second stage, based on the grid-support capability evaluation model, a grid-support capability approximate model for individual ESS is established utilizing the revised Chino polytope. This model accurately characterizes the feasible region of energy storage participating in grid peak regulation at different times by solving the weight correction factor during peak regulation periods. Leveraging this approximate model, the grid-support capability of all ESSs is aggregated using the Minkowski sum, thereby obtaining the feasible region of the entire energy storage cluster. To visually compare the approximate effect of the existing model on the original feasible domain, this paper projects the high-dimensional results onto a two-dimensional plane. Moreover, the effectiveness of the proposed model is validated through peak-shaving verification involving the participation of an energy storage cluster.
3 Grid-support capability evaluation of energy storage clusters
3.1 Grid-support capability matrix based on combination weighting method
To evaluate the grid-support capability of various individual ESSs under different demand scenarios, we adopt a combination of analytic hierarchy process (AHP) and entropy weighting method to refine the technical indicators of ESSs. This results in the establishment of a hybrid subjective-objective matrix for evaluating the support capability between ESSs and grid demands. Compared to the conventional single-weighting method, the combination weighting method weakens the weights of larger indicators and strengthens the weights of smaller indicators, thus avoiding the problem of some indicators becoming ineffective due to large differences in weights.
Considering the perspectives of security, flexibility, and economy, a multilevel indicator system for the ESSs is constructed. The specific primary and secondary indicators are shown in Figure 3.
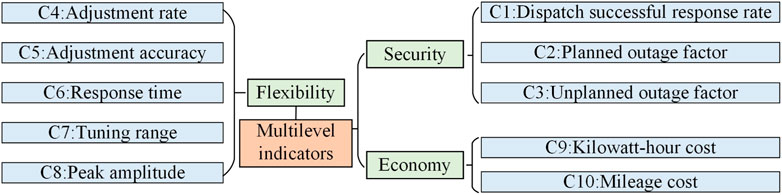
FIGURE 3. Multilevel indicator system for ESSs.
Subsequently, following the establishment of a multilevel indicator system, we construct a grid-support capability matrix based on the combined subjective and objective weighting method which is realized through the following distinctive steps:
Step 1:. The indicators of the energy storage systems are normalized and standardized. The judgment matrices for various primary indicators under different grid demand scenarios are constructed, focusing mainly on peak shaving, frequency regulation, and emergency power support as the typical application scenarios in this study.
Step 2:. The maximum eigenvalue of the corresponding matrix is deduced from the judgment matrices with a consistency test performed thereafter. If the test fails, return to step 1 to reconstruct the judgment matrices. If the test passes, proceed to the next step.
Step 3:. Calculate the weights of the primary indicators for various demand scenarios. Mirroring this process, obtain the weights of the secondary indicators.
Step 4:. Based on the historical data of the multilevel indicators corresponding to different grid demands of each ESS, the entropy weight method is employed to acquire the weights of the technical indicators for different demand scenarios.
Step 5:. Integration of the Analytic Hierarchy Process (AHP) and entropy weight method facilitates the establishment of a model for harmonizing subjective and objective weighted attribute values, consequently deriving the combined weights of the indicators. The proposed model for harmonizing subjective and objective weighted attribute values is solved using mathematical programming, ensuring the consistency between the two types of attribute values and avoiding the problem of one weight dominating over the other. The model is represented as follows:
where xij represents the standardized value of indicator j for ESS i. m is the number of energy storage power stations and n is the number of indicators. wi1 and wi2 are the subjective weights determined by the AHP and the objective weights determined by the entropy weight method, respectively.
Step 6:. The grid demand scenarios and the indicators of the ESSs are restored, and the processed indicators are multiplied by the weights of the indicators under different grid demand scenarios, resulting in the grid-support capability matrix between the ESSs and the power grid demand scenarios. Consequently, the support capability matrix is shown as follows:
where AS represents the grid-support capability matrix, and amk represents the grid-support capability of ESS m under the power grid demand scenario k.
By establishing the aforementioned grid-support capability matrix, we can evaluate the grid-support capability of various large-scale energy storage systems under different power grid scenarios. Then, select energy storage systems with grid-support capability exceeding 0.5 for peak shaving requirements and categorize them as peak shaving energy storage.
3.2 Clustering evaluation considering different types of ESSs
The first step evaluation has successfully identified energy storage systems that possess strong peak shaving support. Following this, the second step is primarily focused on further evaluating the selected peak-shaving energy storage through clustering algorithms based on the dual-peak pattern, thus establishing the groundwork for subsequent aggregation.
Specifically, due to the obvious dual-peak pattern of the power grid load, the peak shaving period can be divided into two distinct periods: the morning peak period, which requires sustained discharge at a relatively low power level, and the evening peak period, which demands high-power short-duration discharge. In this approach, the ratio of power-to-energy for each ESS is computed and subsequently sorted based on a numerical value. Standardization is then applied, further ranking these ratios. Simultaneously, the deviations between the load curve and the peak-shaving line during both the early and late peak periods are calculated and sorted using the same methodology. It is crucial to note that when a certain rank exhibits a higher number of deviations corresponding to the early peak, the ESSs within this rank are categorized as energy-type. Conversely, if a rank presents a predominant number of deviations associated with the late peak, the ESSs within this rank are classified as power-type. Therefore, the peak shaving energy storage systems are further classified into power-type and energy-type based on their energy-to-power ratio, which sets the foundation for peak shaving during the dual-peak pattern of the power grid. Subsequently, to facilitate the scheduling of the energy storage clusters, clustering analysis is performed separately on the power-type and energy-type peak-shaving energy storage clusters. The clustering analysis considers the maximum ramping rate, maximum charging and discharging power, and capacity of the energy storage as feature states and utilizes the K-means clustering algorithm for the second stage evaluation.
The specific steps of this method are as follows:
1) Standardize the feature states of each energy storage system, including the maximum ramping rate, maximum charging and discharging power, and capacity.
2) Randomly select K energy storage systems as initial cluster centers, denoted as yk.
3) Calculate the Euclidean distance between each energy storage system and the K cluster centers, and assign them to the cluster with the shortest distance.
4) Calculate the average feature states of each cluster’s energy storage systems and update them as the new cluster centers.
5) Check if the clustering results have converged, if not, go back to step 3).
The illustration of the proposed clustering evaluation method is shown in Figure 4. The proposed evaluation model can provide a comprehensive evaluation of energy storage systems in the cluster, facilitating their effective deployment and utilization in supporting the power grid demand. Furthermore, this aims to enhance the efficiency of subsequent energy storage cluster aggregation.
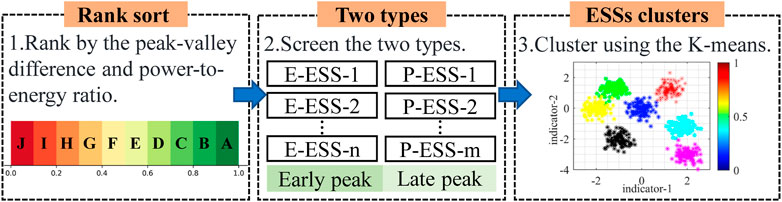
FIGURE 4. The illustration of the proposed clustering evaluation method.
4 Grid-support capability aggregation based on revised chino polytope
The impact of time-domain coupled energy constraints on energy storage, coupled with a burgeoning increase of the feasible boundary plane description with the rise of dimension and addition of parameter operation sets, presents a considerable challenge. Computationally, the aggregation of the grid-support capability in energy storage clusters involves computing the Minkowski sum of multiple high-dimensional polytopes, and direct solving leads to the curse of dimensionality. Therefore, to enhance the rationality and efficiency of the solution, this study utilizes the Chino polytope approximation method to characterize the feasible region of individual energy storage systems based on the previous grid-support capability evaluation results. The Chino polytope differs from the convex polytope of the original feasible domain in a geometric shape. To address this issue, this paper proposes a feasible domain weighting adjustment strategy based on the Chino polytope model that considers the difference in load demand at different periods and prioritizes retaining the flexibility part with higher peak shaving demands to improve the peak shaving capability of the energy storage clusters. In summary, the aggregating model considering the peak regulation requirements is the revision and improvement of the Chino polytope model.
4.1 Chino polytope model
The overall overview of the core ideas and key steps of the Chino polytope model are as follows. Firstly, considering the power, energy, and ramping constraints, the original flexibility of energy storage systems is obtained. Secondly, by constructing the matrix of the running constraints, the in-Chino polytope approximation model is established. Finally, the model is solved by transforming it into an optimization problem with original and approximate flexibility of normal vector direction.
For different types of ESSs, when considering a finite and discrete scheduling decision period with N scheduling points, where each segment has a time interval of ts, the output of the energy storage stations within the scheduling interval is represented by p(t), thus describing the feasible domain based on convex polytopes with the following constraints.
a)Power constraints
If the power is assumed to be pk constant in a certain scheduling period, the power constraints can be expressed as follows:
b) Energy constraints
The energy state of ESS may change with the change of its power, and the relationship between the discrete energy state sk and the power variable pk is as follows:
c) Ramp rate constraints
The ramp rate constraint represents the rate of change of power, expressed in discrete form as follows:
Taking into account the aforementioned constraints, the operationally feasible region of a single ESS
where p represents the power of energy storage in the decision-making period of N periods. A and b are the coefficients after expressing all inequality constraints of the feasible domain in matrix form. Therefore, the operational grid-support capability of ESS can be abbreviated as
To establish a Chino polytope model, the grid-support capability of a single ESS is utilized by the following expression:
where
The shape characterization parameters of the Chino polytope include construction matrix G, polytope center c, and shrinkage coefficient
where
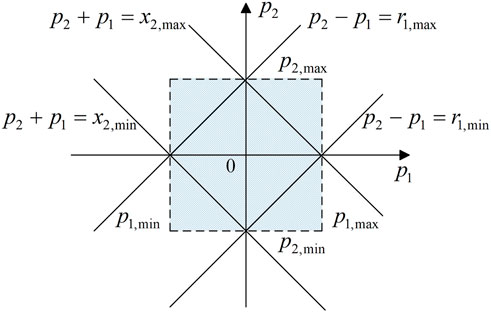
FIGURE 5. Construction vector matrix diagram.
Considering the power, ramp rate, and capacity constraints of the ESSs, the original matrix parameters of a single ESS are obtained.
where pmax and pmin represent the upper and lower limits of the ESS power respectively. rmax and rmin represent the upper and lower limits of the ESS ramp rate respectively. emax and emin represent the upper and lower limits of ESS capacity respectively.
To facilitate a more concise and coherent depiction of the similarity between the Chino polytope and the original polytope, this study randomly selects a sufficient number of polytope normal vectors. The similarity is then characterized by calculating the ratio of their diameters on the normal vectors. Therefore, the similarity between the Chino polytope and the original polytope is as follows:
where
If a certain normal vector
where
Furthermore, the diameter of the Chino polytope in the direction represented by the normal vector
4.2 Aggregating model considering the peak regulation requirements
Under different peak shaving demands in different periods of the power grid, the output of the energy storage cluster varies. To enhance the peak shaving capability of the energy storage cluster in power grid integration, it is advisable to improve the approximation accuracy of the flexible feasible domain during peak shaving periods. In response to this issue, this paper primarily adopts two measures to adjust the grid-support capability of the energy storage cluster. The first measure involves establishing a correction factor for peak load periods based on the difference among the peak shaving line, valley filling line, and load curves. The second measure involves considering the influence of uncertain factors such as temperature on energy storage and characterizing its dynamic probability distribution during peak load periods.
To begin with, based on the typical daily dual-peak load curve of the power grid, the peak shaving line, valley filling line, and the absolute difference between the load curve are normalized. This process determines the peak shaving weight for each time interval, thereby obtaining the weight correction factor. The specific calculation formula is shown as follows:
where Pload,t represents the load curve at time t. Pline,t represents the peak shaving and valley filling line at time t. Pmin and Pmax represent the minimum and the maximum value of the load curve respectively. wi is the weight correction vector for the i-th ESS, and N is the number of scheduling periods.
The approximate degree of the grid-support capability in the normal vector direction can be modified according to the weight correction factor.
where
Moreover, the output of energy storage is subject to uncertainties caused by factors such as temperature and state of health (SOH). To characterize this characteristic, the dynamic probability distribution of energy storage output during peak load periods is obtained based on historical energy storage output data using non-parametric kernel density estimation theory. Based on this, a certain confidence level is selected to dynamically represent the uncertainty of energy storage output during peak load periods. By considering its probabilistic characteristics in the process of aggregation, general chance constraints can be formulated as follows:
where x represents the decision variable, i.e., the energy storage output. e represents the prediction error vector. a, b, and c are constants and
The joint probability function of the prediction error e for a Gaussian Mixture Model (GMM) can be approximated by a linear combination of several Gaussian functions (Goel et al., 2023). Then, the quantiles of the random variable
where
After considering output uncertainty, the original feasible domain model for the energy storage cluster is as follows:
After solving
The expression for aggregating the construction matrix G, polytope center c, and construction scaling coefficient matrix
where
5 Case study
The case study is carried out on IEEE 39-bus system. The MATLAB R2021b software with the YALMIP toolbox and GUROBI solver is used to solve the optimization problems.
5.1 Grid-support capability evaluation and analysis
Initially, based on the multilevel technical indicator data of various ESSs in the three application scenarios of peak shaving, frequency regulation, and emergency power support, the secondary indicators are standardized and positively transformed. Subsequently, the combination weighting method is employed to determine the weights of each indicator. Based on the calculated results of subjective and objective weights, the allocation coefficients for subjective weight and objective weight can be obtained by solving Eq. 1, and the results are α1 = 0.5342 and α2 = 0.4658 respectively. Ultimately, the combined weight can be calculated by appropriately weighting these coefficients. The results of the weight calculation based on peak shaving are shown in Table 1.
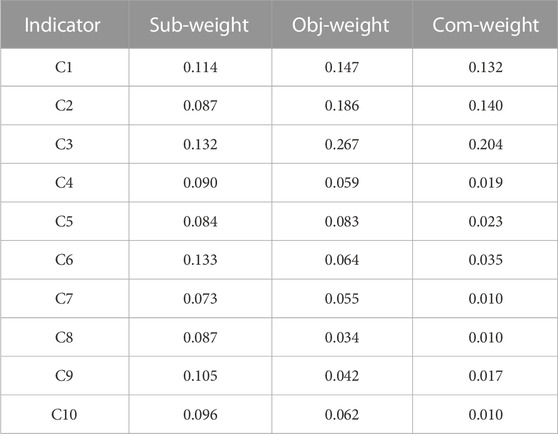
TABLE 1. Calculation results of weighting for ESSs multilevel indicator.
According to the calculation results in Table 2, it can be observed that among the various indicators of the ESSs applied for peak shaving scenarios, the weight of the non-planned outage coefficient indicator is 0.204, which has the highest proportion. The next significant indicators include dispatch success response rate and planned outage coefficient, which play a crucial role in the participation of ESSs in power grid peak shaving. Moreover, based on the weight calculation results, compared to the single weighting method, the combination weighting method combining subjective and objective weights weakens the influence of indicators with higher weights and strengthens the influence of indicators with smaller weights, which avoids potential issues of some indicators becoming ineffective due to large differences between them.
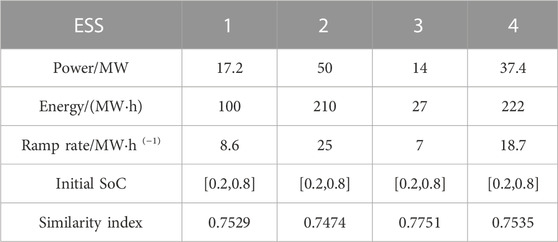
TABLE 2. The parameters and calculation results of ESSs.
Randomly generated massive ESSs with indicators following a normal distribution, and calculate their support level in peak shaving scenarios. Proceeding with the supportiveness results, a value of 0.5 is chosen as the threshold to select ESSs demonstrating strong peak-shaving capabilities. As a result, a total of 70 ESSs that fulfill the requirements for peak shaving are selected.
To facilitate the subsequent grid-support capability aggregation of energy storage clusters, the maximum ramp rate, maximum charging and discharging power, and capacity are taken as characteristic states. After standardizing the indicators, the K-means clustering algorithm is adopted to conduct a second stage evaluation and analysis on the selected peak shaving energy storage clusters. The clustering evaluation results are shown in Figure 6.
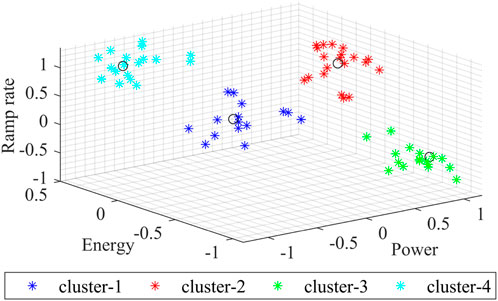
FIGURE 6. The clustering evaluation results.
5.2 Grid-support capability aggregation and analysis
The manuscript under consideration adopts a bottom-up approach to aggregate grid-support capabilities, whereby the feasibility domain pertaining to individual ESS is preliminarily delineated in accordance with a case study analysis. Considering a decision cycle T = 24 h and a time interval t = 1 h, with S = 100 normal vectors, the flexibility of 15 ESSs in cluster 1 is modeled using the approximate Chino polytope method. To demonstrate the derived outcomes in a succinct manner, four ESSs have been selectively extracted from this cluster and their results are tabulated in Table 2.
The incorporation of adjustable margins at any given time is paramount in ensuring the stability and efficiency of the ESS. As a result, in the study presented, the State of Charge (SoC) of the ESS is fixed between 0.2 and 0.8, providing a certain level of adjustability. It can be seen from the results that for the four different parameters of energy storage systems, the similarity index of the feasible region obtained by the Chino polytope and its original flexibility feasible region is more than 70%, indicating that the proposed method in this paper successfully reduces the conservatism typically inherent in feasible region, thus resulting in a larger scope for grid-support capability.
The existing evaluation methods generally involve the problem of not being able to directly draw high-dimensional spatial graphics. To visually compare the approximate effect of existing models on the original feasible domain, this paper projects the high-dimensional results onto a two-dimensional plane, which displays the feasible domains of two adjacent time points. Taking the power projection of t = 1 and t = 2 as an example, with
The projection of the original feasible domain of single energy storage and the feasible domain of the polytope Chino is shown in Figure 7.
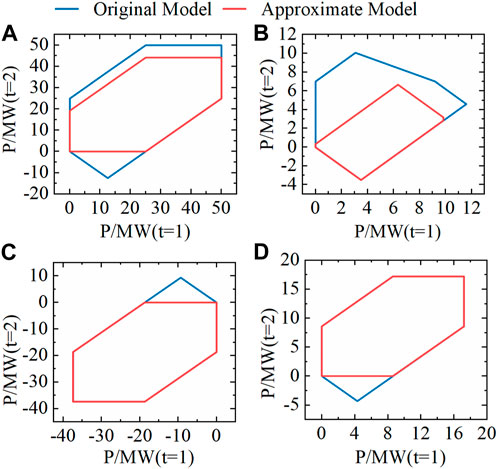
FIGURE 7. The comparison of original and approximate projected feasible region for different ESSs: (A) ESS-1; (B) ESS-2; (C) ESS-3; (D) ESS-4.
Furthermore, considering the peak shaving demand of the power grid in different time periods, the similarity is further adjusted. According to the typical daily dual-peak load curve of the region, the absolute value of the difference between the peak cutting line and the valley filling line and the load curve is normalized. In addition, due regard is attributed to the probability distribution of energy storage output during peak load periods, facilitating the determination of each moment’s peak load weight. The correction result for t = 4 and t = 5 is shown in Figure 8.
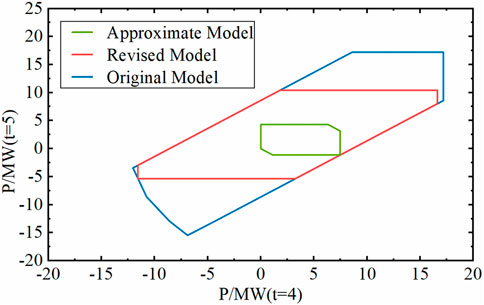
FIGURE 8. The comparison of projected feasible region for three types of models.
Based on the daily load curve, it is known that the peak shaving demand of the power grid is high during the t = 4 and t = 5 periods. Therefore, in the approximation model of a single energy storage polytope, the weight for this period is set to a higher value. The result shows that the revised polytope approximation accuracy for this period is much higher than the unmodified approximate polytope. This result demonstrates the feasibility of the revised model.
In this paper, the selected 15 ESSs are regarded as a peak shaving cluster. The time scale is T = 24 h, and the time interval is t = 1 h. Considering the constraints on ramp rate, power, and energy for ESSs, the grid-support capability aggregation of the energy storage cluster is performed using the Minkowski sum method. The power, energy, and ramping limits of the cluster are shown in Figure 9. It is verified in the case study that compared with the direct Minkowski sum of the original feasible region, the method based on the revised Chino polytope proposed in this paper has the potential to significantly conserve computational resources.
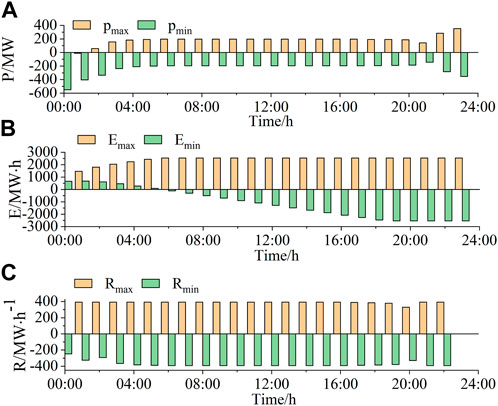
FIGURE 9. The upper and lower operation bounds of the aggregated ESSs: (A) power bounds, (B) energy bounds, (C) ramp bounds.
The power limits of the energy storage cluster indicate that this method can obtain the maximum output power range of the cluster. Under the constraints of these limits, the energy storage cluster forms a feasible domain. As a result, the operational range of the 15 energy storage clusters within one scheduling cycle is obtained, which facilitates their participation as a whole in peak shaving in the power system and reduces the computational burden on the dispatch center.
5.3 Analysis of energy storage clusters in peak regulation
To demonstrate that the proposed grid-support capability aggregation method based on the revised Chino polytope can improve the ability of energy storage clusters to participate in grid peak regulation, this paper takes the IEEE 39-bus system as an example.
The power grid consists of 39 busbars, including 10 generator busbars and 19 load busbars. In addition to these, one wind turbine and 15 ESSs are incorporated, with the collective ESSs treated as a singular unit for purposes of grid peak regulation. In the peak regulation model, we assume that the configured energy storage capacity is sufficient. In addition, since the load prediction is more accurate, it is assumed that the forecast value of day and day load is the same curve. The peak regulation model posits the minimum peaking cost of each unit as the objective function. It employs the power upper and lower limits, together with the power balance of each unit, as the constraint conditions. Consequently, a peak regulation strategy for the energy storage cluster is devised on a time scale of 1 hour. The comparison graph of the peak shaving correction amount between the revised and original model at different time intervals is shown in Figure 10.
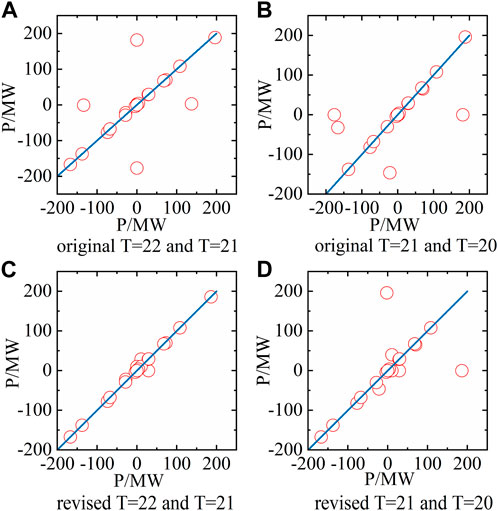
FIGURE 10. The comparison graph of peak shaving correction amount between the revised and original model at different time intervals. (A) original at T = 22 and T = 21, (B) original at T = 22 and T = 21, (C) revised at T = 22 and T = 21, (D) revised at T = 21 and T = 20.
Among them, T = 22 represents the energy storage cluster participating in the peak regulation strategy at time t = 2, and T = 21 represents the energy storage cluster participating in peak regulation at time t = 3. It can be seen from the results that, compared with the original model, the revised model based on the Chino polytope proposed in this paper makes the adjustment amount of the energy storage cluster at the later moment smaller in the process of participating in the peak regulation of the power grid, that is, the ability of the energy storage cluster to participate in the peak regulation of the power grid is improved.
6 Conclusion
This paper presents a model for evaluating and aggregating the grid support capability of energy storage clusters by considering the peak regulation requirements. The model’s effectiveness is demonstrated based on the IEEE 39-bus system, and several conclusions have been drawn. Primarily, the combined subjective and objective weighting method proposed in this paper circumvents issues arising from significant weight discrepancies across different indices, a problem often encountered with traditional single-weighting methods. Furthermore, grid-support capability aggregation based on evaluation increases the efficiency and rationality of massive ESSs aggregation analysis. Notably, the aggregation model based on the revised Chino polytope not only saves computing resources but also improves the ability of energy storage clusters to participate in power grid peak regulation. The method considers both aggregation precision and computing efficiency to some extent. Future work will look into constraints such as power flow within the power grid for the energy storage clusters to depict the grid-support capability of energy storage clusters more accurately.
Data availability statement
The original contributions presented in the study are included in the article/Supplementary Material, further inquiries can be directed to the corresponding author.
Author contributions
LL: Conceptualization, Data curation, Investigation, Project administration, Writing–original draft. YL: Writing–original draft, Formal Analysis, Funding acquisition, Resources, Validation. MW: Writing–original draft, Investigation, Project administration, Supervision. QT: Formal Analysis, Methodology, Resources, Writing–review and editing.
Funding
The author(s) declare financial support was received for the research, authorship, and/or publication of this article. This work is supported by the China Southern Power Grid Power Generation Co., Ltd., Energy Storage Research Institute (020000KK52220002). The funder was not involved in the study design, collection, analysis, interpretation of data, the writing of this article, or the decision to submit it for publication.
Conflict of interest
Authors LL, YL, MW, and QT were employed by China Southern Power Grid Power Generation Co., Ltd., Energy Storage Research Institute.
Publisher’s note
All claims expressed in this article are solely those of the authors and do not necessarily represent those of their affiliated organizations, or those of the publisher, the editors and the reviewers. Any product that may be evaluated in this article, or claim that may be made by its manufacturer, is not guaranteed or endorsed by the publisher.
References
Ayesha, , Numan, M., Baig, M. F., and Yousif, M. (2023). Reliability evaluation of energy storage systems combined with other grid flexibility options: a review. J. Energy Storage 63, 107022. doi:10.1016/j.est.2023.107022
Bhatti, B. A., Hanif, S., Alam, J., Mitra, B., Kini, R., and Wu, D. (2023). Using energy storage systems to extend the life of hydropower plants. Appl. Energy 337, 120894. doi:10.1016/j.apenergy.2023.120894
Calero, F., Canizares, C. A., and Bhattacharya, K. (2021). Aggregated BESS dynamic models for active distribution network studies. IEEE Trans. Smart Grid 12, 2077–2088. doi:10.1109/tsg.2020.3048648
Chen, X., Dall'Anese, E., Zhao, C., and Li, N. (2020). Aggregate power flexibility in unbalanced distribution systems. IEEE Trans. Smart Grid 11, 258–269. doi:10.1109/tsg.2019.2920991
Chen, X., and Li, N. (2021). Leveraging two-stage adaptive robust optimization for power flexibility aggregation. IEEE Trans. Smart Grid 12, 3954–3965. doi:10.1109/tsg.2021.3068341
Cui, B., Zamzam, A., and Bernstein, A. (2021a). Network-cognizant time-coupled aggregate flexibility of distribution systems under uncertainties. IEEE Control Syst. Lett. 5, 1723–1728. doi:10.1109/lcsys.2020.3045080
Cui, Y., Zhou, H., Zhong, W., Hui, X., and Zhao, Y. (2021b). Two-stage day-ahead and intra-day rolling optimization scheduling considering joint peak regulation of generalized energy storage and thermal power. Power Syst. Technol. 45, 10–20. doi:10.13335/j.1000-3673.pst.2020.0206
Ding, M., Gao, P., Bi, R., Hu, D., Yu, H., and Zhang, Y. (2021). Cluster partition method for high-permeability renewable energy considering flexibility. Proc. CSU-EPSA 33, 115–122+150.
Ding, M., Liu, X., Bi, R., Hu, D., Ye, B., Zhang, J., et al. (2018). Pyrazolo[1,5-a]pyrimidine TRPC6 antagonists for the treatment of gastric cancer. Automation Electr. Power Syst. 42, 47–55. doi:10.1016/j.canlet.2018.05.041
Goel, K., Michael, N., and Tabib, W. (2023). Probabilistic point cloud modeling via self-organizing Gaussian mixture models. Ieee Robotics Automation Lett. 8, 2526–2533. doi:10.1109/lra.2023.3256923
Han, X. T., and Zhang, Y. J. (2022). Decomposition-coordination-based voltage control for high photovoltaic-penetrated distribution networks under cloud-edge collaborative architecture. Int. Trans. Electr. Energy Syst. 2022, 1–20. doi:10.1155/2022/7280220
Hua, H., Qin, Y., Hao, C., and Cao, J. (2019). Optimal energy management strategies for energy Internet via deep reinforcement learning approach. Appl. Energy 239, 598–609. doi:10.1016/j.apenergy.2019.01.145
Leng, Y. J., and Zhang, H. (2023). Comprehensive evaluation of renewable energy development level based on game theory and TOPSIS. Comput. Industrial Eng. 175, 108873. doi:10.1016/j.cie.2022.108873
Li, H., Zhang, N., Kang, C., Xie, G., Li, Q., Yang, X. Q., et al. (2019). Inducing secondary metabolite production by Co-culture of the endophytic fungus phoma sp. and the symbiotic fungus armillaria sp. Proc. Chin. Soc. Electr. Eng. 39, 1009–1013. doi:10.1021/acs.jnatprod.8b00685
Li, Y., Han, M., Shahidehpour, M., Li, J. Z., and Long, C. (2023). Data-driven distributionally robust scheduling of community integrated energy systems with uncertain renewable generations considering integrated demand response. Appl. Energy 335, 120749. doi:10.1016/j.apenergy.2023.120749
Ma, G. L., Li, J. N., and Zhang, X. P. (2023). Energy storage capacity optimization for improving the autonomy of grid-connected microgrid. Ieee Trans. Smart Grid 14, 2921–2933. doi:10.1109/tsg.2022.3233910
Muller, F. L., Szabo, J., Sundstrom, O., and Lygeros, J. (2019). Aggregation and disaggregation of energetic flexibility from distributed energy resources. IEEE Trans. Smart Grid 10, 1205–1214. doi:10.1109/tsg.2017.2761439
Nan, B., Jiang, C., Dong, S., and Xu, C. (2022). Day-ahead and intra-day coordinated optimal scheduling of integrated energy system considering uncertainties in source and load. Power Syst. Technol., 1–15.
Sajjad, I. A., Chicco, G., and Napoli, R. (2016). Definitions of demand flexibility for aggregate residential loads. IEEE Trans. Smart Grid 7, 2633–2643. doi:10.1109/tsg.2016.2522961
Wang, S., and Wu, W. (2021). Aggregate flexibility of virtual power plants with temporal coupling constraints. IEEE Trans. Smart Grid 12, 5043–5051. doi:10.1109/tsg.2021.3106646
Wen, Y., Hu, Z., and Liu, L. (2022a). Aggregate temporally coupled power flexibility of DERs considering distribution system security constraints. IEEE Trans. Power Syst., 1–13. doi:10.1109/tpwrs.2022.3196708
Wen, Y., Hu, Z., You, S., and Duan, X. (2022b). Aggregate feasible region of DERs: exact formulation and approximate models. IEEE Trans. Smart Grid 13, 4405–4423. doi:10.1109/tsg.2022.3179998
Yang, Z., Yibo, W., Chuang, L., Guowei, C., Weichun, G., Yueyang, X., et al. (2023). Research on the deep peak-shaving cost allocation mechanism considering the responsibility of the load side. Front. Energy Res. 11. doi:10.3389/fenrg.2023.1182620
Yi, W., Liangzhong, Y., Siyang, L., Yunxin, L., Jian, L., and Xinying, W. (2022). A peak shaving method of aggregating the distributed photovoltaics and energy storages based on the improved K-means++ algorithm. Power Syst. Technol. 46, 3923–3931.
Yi, Z., Xu, Y., Gu, W., and Wu, W. (2020). A multi-time-scale economic scheduling strategy for virtual power plant based on deferrable loads aggregation and disaggregation. IEEE Trans. Sustain. Energy 11, 1332–1346. doi:10.1109/tste.2019.2924936
Zhang, R., and Hredzak, B. (2021). Distributed dynamic clustering algorithm for formation of heterogeneous virtual power plants based on power requirements. IEEE Trans. Smart Grid 12, 192–204. doi:10.1109/tsg.2020.3020163
Zhang, R., Hredzak, B., and Fletcher, J. (2021). Dynamic aggregation of energy storage systems into virtual power plants using distributed real-time clustering algorithm. IEEE Trans. Industrial Electron. 68, 11002–11013. doi:10.1109/tie.2020.3038074
Keywords: peak regulation requirements, combination weighting method, grid-support capability evaluation, grid-support capability aggregation, revised Chino polytope
Citation: Li L, Li Y, Wan M and Tan Q (2023) Evaluating and aggregating the grid-support capability of energy storage clusters by considering the peak regulation requirements. Front. Energy Res. 11:1281267. doi: 10.3389/fenrg.2023.1281267
Received: 22 August 2023; Accepted: 13 October 2023;
Published: 20 October 2023.
Edited by:
Mingfei Ban, Northeast Forestry University, ChinaCopyright © 2023 Li, Li, Wan and Tan. This is an open-access article distributed under the terms of the Creative Commons Attribution License (CC BY). The use, distribution or reproduction in other forums is permitted, provided the original author(s) and the copyright owner(s) are credited and that the original publication in this journal is cited, in accordance with accepted academic practice. No use, distribution or reproduction is permitted which does not comply with these terms.
*Correspondence: Yongqi Li, MjYzMTc2NDQ2NEBxcS5jb20=