 Qi Liu
 Lihong Zhang
 Xingquan Ji
 Huizhe Shi
- College of Electrical Engineering and Automation, Shandong University of Science and Technology, Qingdao, China
This study presents a new methodology to perform the distribution network dynamic reconfiguration (DNDR), taking into consideration the stochastic variations of loads and distributed generation (DG) of power. To solve the heavy computational burden that exists in traditional algorithms of the DNDR, this study first establishes the nodal sensitivity models to calculate the nodal variations caused by nodal power variations. Then, the DNDR is executed utilizing a co-evolutionary algorithm with the goal of loss minimization. The stochastic power flow calculations (PFCs) based on the nodal sensitivity are performed in the DNDR to handle the power fluctuations of the DGs and loads. Finally, the modified IEEE 33-bus test system and a practical distribution system are used for simulations. The simulation results validate the quickness and effectiveness of the proposed DNDR method.
1 Introduction
1.1 Literature review
The distribution network reconfiguration (DNR) can adjust the network topology and improve the performance of distribution networks by combining the open/closed states of line switches. The goals of the DNR include reducing the power losses (Lotfi et al., 2020), improving system reliability (Kianmehr et al., 2019), enhancing system resilience (Sun et al., 2023), reducing voltage drops (Song et al., 2020), and managing energy (Gao et al., 2022a). The DNR plays an important role in the distribution automation of the system.
It is usually formulated as a complex non-linear optimization problem. The solution algorithms for the DNR include intelligent optimization algorithms, heuristic algorithms, and mathematical programming algorithms. Intelligent optimization algorithms, such as the genetic algorithm, honeybee mating optimization algorithm, particle swarm optimization algorithm, and harmony search algorithm, have been successfully applied in DNR (Roosta et al., 2019; Jakus et al., 2020; Lotfi and Ghazi, 2021; Hizarci et al., 2022). However, the tremendous amount of computation of intelligent optimization algorithms greatly limits their engineering applications. The heuristic algorithms can solve the DNR problem with high speed. In the study by Harsh and Das (2023), a two-stage heuristic algorithm based on the power flow analysis is used for DNR. Zhan et al. (2020) proposed the switch opening and exchange method for DNR. Recently, efficient mathematical programming algorithms, such as convex programming, have been successfully applied in DNR. López et al. (2015) presented a mixed-integer second-order conic programming model for the DNR considering the reliability constraints. Sekhavatmanesh and Cherkaoui (2020) proposed a multi-step reconfiguration model of active distribution network restoration based on mixed-integer second-order cone programming.
Distributed generation (DG) technology has been developed rapidly in recent years due to its flexible and environment-friendly nature (Zheng et al., 2021a). However, when many DGs are connected to the system, the power fluctuation of DGs increases the risks of the distribution network operation (Zhang et al., 2023). Therefore, it is essential to take nodal power fluctuations into account in the DNR. Santos et al. (2022) considered the uncertainties of DGs and loads and carried out the DNR with the goal of reducing carbon emission costs. Raj and Kumar (2020) proposed a new DNR method based on affine arithmetic to handle the uncertainties of nodal powers. Haghighat and Zeng (2016) introduced continuous uncertainty sets and developed and solved a mixed-integer robust optimization model under a master–slave framework. Zheng et al. (2021b) presented an adaptive robust distribution network model for three-phase DNR.
1.2 Problem addressed
The distribution network dynamic reconfiguration (DNDR), which takes the time-varying load and constraint of the switch operation into account, is applicable for engineering applications. Considering the influence of forecast errors, the actual loads and DG in power deviate from the predicted data. When the uncertainty of nodal power is considered in the dynamic reconfiguration, the calculation burden is huge, which greatly limits its feasibility for engineering applications. In the study by Razavi et al. (2022), the stochastic DNDR based on the probability distance method is employed to shrink the scenario sets, and a self-adaptive modified crow search algorithm is introduced to find an optimal scenario. Gao et al. (2022b) established a stochastic dynamic reconfiguration model based on selected scenarios to address the uncertainties of the DGs and loads.
However, the number of switch operations is usually treated only as a constraint in existing dynamic reconfiguration approaches, which ignores the influence of the switch operation on the operational cost of distribution systems. When both the switch operational cost and nodal power fluctuation are considered in the DNDR, the computational burden is heavy, and it becomes difficult to obtain an effective solution quickly.
1.3 Contributions
To solve the problem of heavy computational burden that exists in the DNDR, a new methodology to perform the dynamic reconfiguration is proposed. The main contributions are as follows:
(i) The co-evolution algorithm is proposed to solve the dynamic reconfiguration model with the goal of loss minimization. The switch operational cost is considered in the DNDR, which can improve the operational costs of the distribution network effectively. The hash table is designed to store individuals’ fitness, which can avoid extensive fitness calculations.
(ii) The effect of power fluctuation on the operation constraints is considered in the dynamic reconfiguration model to ensure operation security. The sensitivity models of nodal power to bus voltage are used to calculate the voltage and branch power, which can improve the computation efficiency of the DNDR.
1.4 Article organization
The rest of this article is organized as follows: Section 2 introduces the stochastic model of the DGs and loads. Section 3 introduces stochastic PFCs. Section 4 introduces the DNDR algorithm. Section 5 presents the simulation results, and the conclusions are drawn in Section 6.
2 Stochastic model of DGs and loads
It is supposed that the day-ahead active power of the wind turbine (WT) and photovoltaic (PV) power generation is predicted on the basis of weather conditions, and random variations of the active power output of wind power generation and PV power generation follows the normal distribution. The probability density function of the active power output of wind power generation PWT and PV power generation PPV can be described as:
where
The reactive power of DG is supposed to follow the active power at the rated power factor.
The random variation of the active load follows a normal distribution, and the probability density function of the active load
where
It is supposed that the reactive load follows the active load by the rated power factor.
3 Stochastic power flow calculation
3.1 Sensitivity factors of bus voltage
The output power of the DGs is regarded as the negative load power in PFCs. The nodal equivalent power is the difference between the load power and DG output power:
where
In the process of calculating branch power, the power loss of the branch is temporarily ignored. Considering that the nodal voltages are close to their rated values at normal conditions, the per-unit value of the bus voltage is supposed to be 1. For the node
where
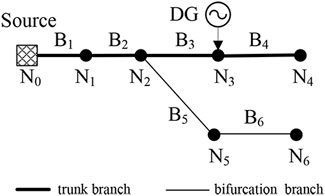
FIGURE 1. Diagram of the simple distribution network.
For the node without bifurcation, the nodal outfeed power is equal to the nodal equivalent power, such as node
For the general radial distribution network, when the outfeed power of node i changes, the voltage change
where
where
3.2 Stochastic power flow calculation based on sensitivity model
The power of the load and DG is supposed to be constant within a period. First, according to the predicted load power and DG power, the node voltages and branch power are obtained through PFCs. The distribution network operation scenarios considering the power fluctuations of the DGs and loads are obtained by Latin hypercube sampling (LHS). In the generative distribution network operation scenarios, the difference between the predicted value and generative value of each node is used to calculate the change of the node voltages by the sensitivity model. Then, the nodal voltages are obtained by summing up the change of node voltages caused by stochastic variations of nodal power. Finally, the branch power and line losses are obtained by nodal voltages.
4 Dynamic reconfiguration of distribution network based on co-evolution algorithm
4.1 Time intervals division
Time intervals division can reduce the computation cost of dynamic reconfiguration. As shown in Figure 2, the daily load curve is divided into natural periods. Several successive natural periods form a reconfiguration interval in which the network topology remains unchanged.
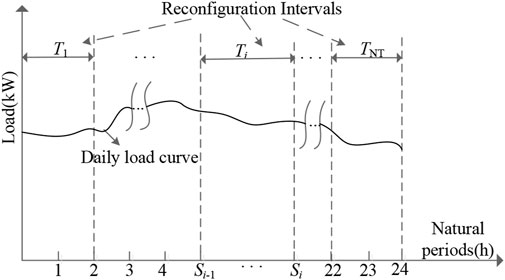
FIGURE 2. Schematic of reconfiguration intervals.
The objective function of reconfiguration interval divisions can be described as:
where
In addition, reconfiguration interval divisions must satisfy the following constrains:
where
Equations 13–16 constitute a typical integer programming model with constraints. The branch and bound algorithm is applied to obtain the best reconfiguration interval division schemes as the number of control variables is limited.
4.2 Static reconfiguration model for single time interval
The network loss
where
The objective of static reconfiguration in a single interval is to minimize the total power loss:
where
The following constraints should be satisfied during static network reconfiguration:
(1) Radial and connective network constraint.
The distribution network must have radial topology with all of nodes energized.
(2) Permissible range of bus voltage.
When the impact of the power fluctuation of the DGs and loads on the node voltage is considered, the voltage constraint can be described as:
where
(3) Branch power limits.
Taking the uncertainties of DGs and loads into account, the branch power constraint can be described as:
where
4.3 Improved genetic algorithm
4.3.1 Genetic encoding and decoding
In this study, the randomly arranged branch sequence is regarded as a chromosome by the strategy of searching random spanning trees based on the decimal coding method (Ouyang et al., 2009). In addition, the states of the switches can be obtained by the decoding process. As for the simple network shown in Figure 3, branch B1 and B5 do not take part in genetic encoding. The random combination of states of switches at the other branches forms a chromosome, such as R1: B2-B3-B4-B8-B9-B12-B6-B7-B10-B11. According to the strategy of searching random spanning trees, the spanning tree corresponding to chromosome R1 should be: B1-B2-B3-B4-B8-B9-B12-B6-B10-B5.

FIGURE 3. Schematic of a simple distribution network.
4.3.2 Detection of offspring chromosome
The most time-consuming part in the process of reconfiguration is the fitness calculation of chromosomes, which represents different reconfiguration schemes. There are a certain number of same individuals between the offspring and parent population after cross and mutation operations. The fitness of these individuals in the offspring population can be obtained directly from the parent population, thus avoiding time-consuming power flow calculation. Therefore, a hash table is designed to store the individuals' fitness, and the length of the hash table is the same as the size of the population. To enhance the efficiency of table querying, the set of open switches of individuals is used to represent the individual. For the network in Figure 3, the open switch set of chromosome R1 is {B7, B11}, so B7–B11 is stored in the hash table to represent R1. Figure 4 shows the detection process of the offspring chromosome. As B7–B11, which represents R1, is included in the parent chromosomes, the fitness of R1 can be obtained from the parent population.
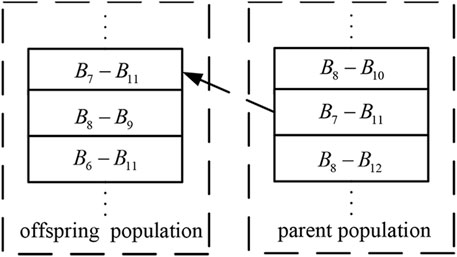
FIGURE 4. Comparison and detection among the offspring chromosomes.
4.3.3 Selection operation
The elitist strategy is applied in the selection operation, and the merging of the offspring and parent population increases the number of good individuals. The tournament algorithm is used in the merged population. Two individuals are chosen successively from all the chromosomes, and the one whose fitness is larger is selected.
4.3.4 Crossover operation
The order-based crossover method is applied in this study. First, two points of one chromosome are chosen to be cut off randomly. Then, the position of the first point is taken as the starting point and the genes between the two points are put into another chromosome. The repeating genes of the new chromosome are removed to get the next generation.
4.3.5 Mutation operation
Two points of one chromosome are chosen randomly and the genes between the two points are rearranged in the reverse order to get the new chromosome.
4.3.6 Obtaining target solution set
The solution set of the first iteration in the static reconfiguration is regarded as the initial target solution set. Then, the solution set of each iteration is compared with the target solution set, and the solution with better fitness, which has not appeared in the target solution set, is added into the target solution set.
4.4 Model of dynamic reconfiguration
The objective of the dynamic reconfiguration is to minimize the daily cost of the distribution network, which can be described as
where
The radial and connective network constraint, node voltage constraint, and line load constraint that should be satisfied during static network reconfiguration are also included in the dynamic network reconfiguration.
4.5 Co-evolution algorithm
The daily reconfiguration schedule constitutes the static reconfiguration schedule at each interval and cannot be guaranteed to be the best since it ignores the interaction between different static reconfiguration schedules. It is necessary to coordinate the reconfiguration schedule at each interval to get the daily reconfiguration schedule that satisfies all the constraints and has minimal operational cost.
The co-evolutionary algorithm is a kind of optimization algorithm which simulates the co-evolutionary phenomenon in nature. In the multi-population co-evolutionary algorithm, the problem is divided into several sections, and each section is represented by a population. The calculation of the fitness of one individual in a population requires the other population's representative solution that is together with the individual to form a complete solution. In this work, the solution set in each interval represents a population in co-evolutionary algorithm, and the co-evolutionary algorithm is applied to coordinate the reconfiguration schedule of each interval to get the daily reconfiguration schedule. Figure 5 is the flow chart of the co-evolutionary algorithm.
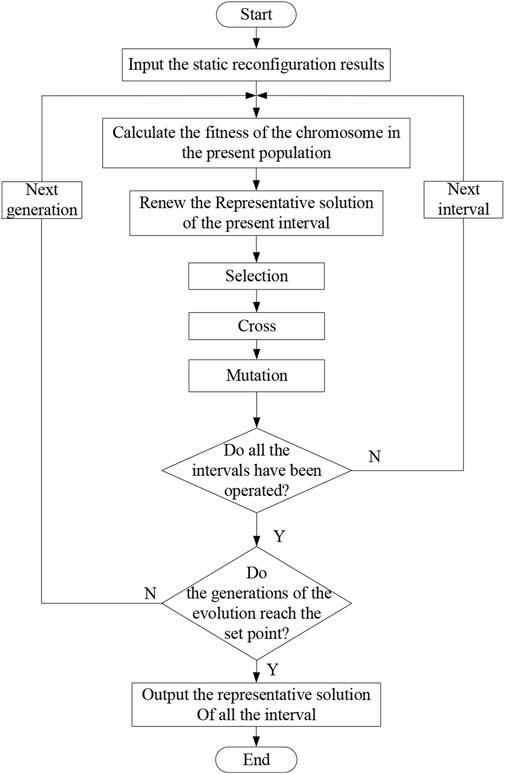
FIGURE 5. Flow chart of the co-evolution algorithm.
In the process of the multi-population co-evolutionary, the representative solution of every interval constitutes the best reconfiguration schedule. In the first iteration, the solution with the least power loss is temporarily regarded as the representative solution. In the subsequent iteration process, the solution with the least daily cost is regarded as the representative solution.
According to the total operational cost of the chromosomes and the representative solution of the interval, the tournament algorithm is used to select the individuals, amount of representative solutions are used to replace some chromosomes to increase the proportion of the representative solution.
In the process of dynamic coordination, if the daily cost of the new dynamic reconfiguration schedule arises, the current co-evolutionary step is regarded as invalid, and the representative solution of the interval is not updated. Abandoning the invalid representative solution can ensure the evolution along the direction of cost reduction.
5 Case studies
5.1 Case 1
The proposed reconfiguration algorithm is applied to the typical IEEE 33-bus system (Baran and Wu, 1989) as shown in Figure 6. The daily load curve is divided into 24 natural periods. The capacity of the overhead transmission line is 10.5 MV A. The WTs are located at nodes 6 and 23. The PVs are located at nodes 24 and 31. The electric price is 0.7$/kWh, operational cost of the switch is 10$ each time, and maximum reconfiguration time within a day is three. According to the principle of 3
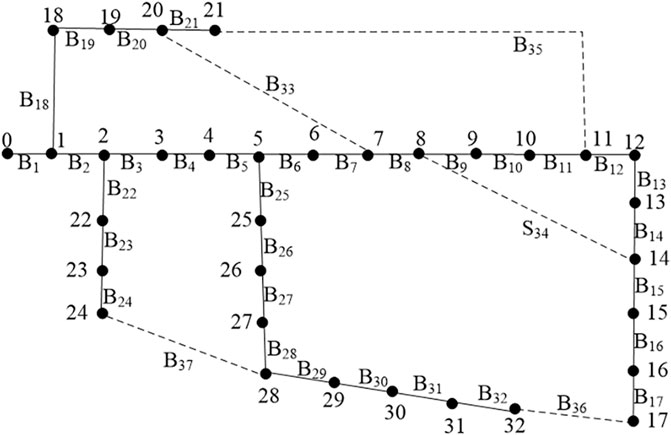
FIGURE 6. IEEE 33-bus distribution system.
The numerical simulations are implemented in MATLAB 2022b with Intel® Core™ i5-8350U CPU. Figure 7 shows the saved times of power flow calculation in the static reconfiguration of each interval. The total number of reduced power flow calculations is 749, and the proportion of the number of reduced power flow calculations in the genetic algorithm is 31.21%, which improves the efficiency of the static reconfiguration.

FIGURE 7. Number of reduced power flow calculation.
Figure 8 shows the comparison results of power losses in different scenarios. Before the reconfiguration, the total energy loss is 1,763.15 kWh and operational cost is 1,234.21$. After the reconfiguration, the total energy loss is 1,212.20 kWh and operational cost is 900.07$. The energy loss has decreased by 31.25%, and the operational cost has decreased by 25.74%. The proposed DNDR algorithm reduces the energy loss and operational cost effectively. When compared with power losses with and without DGs, it can be concluded that both the DGs and network reconfiguration play important roles in reducing power loss.
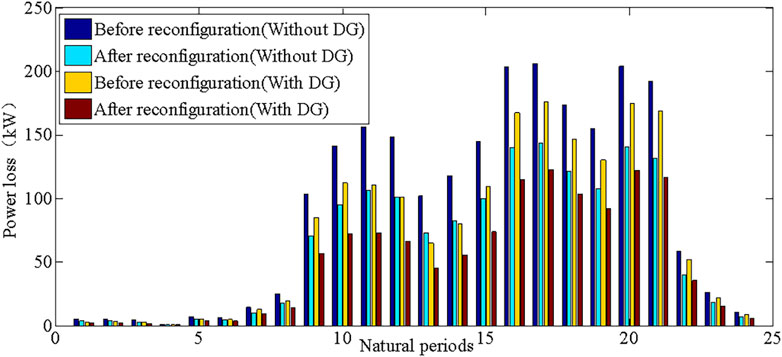
FIGURE 8. Comparison of power loss in each period before and after reconfiguration.
Figure 9 shows the comparison results of the lowest bus voltages in different scenarios. Before the reconfiguration, the lowest bus voltage is 0.9147 p.u. After the reconfiguration, the lowest bus voltage is 0.9434 p.u. The proposed dynamic reconfiguration algorithm avoids voltage violations.
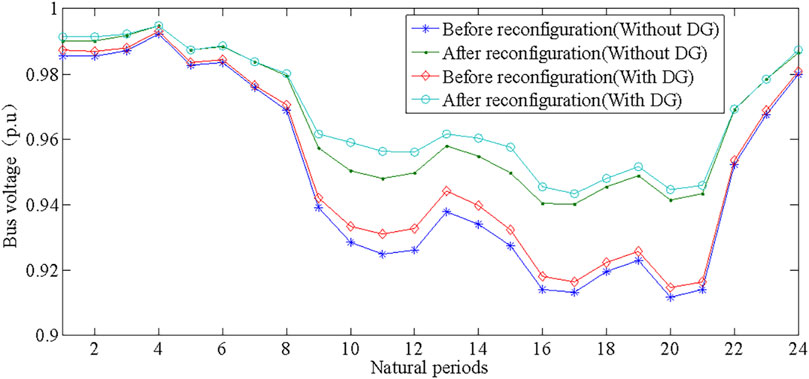
FIGURE 9. Comparison of lowest bus voltage in each period before and after reconfiguration.
Table 1 shows the reconfiguration results with and without interval coordination. Table 2 compares the reconfiguration results of different reconfiguration methods. In the reconfiguration results without interval coordination, the energy loss is 1,212.20 kWh and operational cost is 908.54$. In the reconfiguration results with interval coordination, the energy loss is 1,214.39 kWh and operational cost is 900.07$. As the proposed dynamic coordination algorithm considers the operational cost of switches, the daily operational cost is less than that of the reconfiguration results without interval coordination.
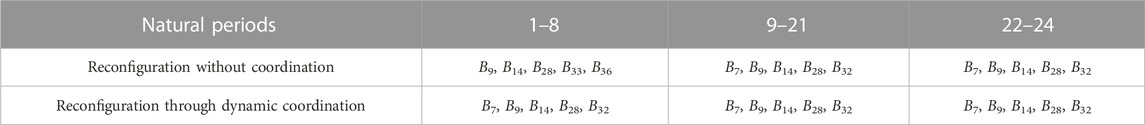
TABLE 1. Reconfiguration results in Case 1.
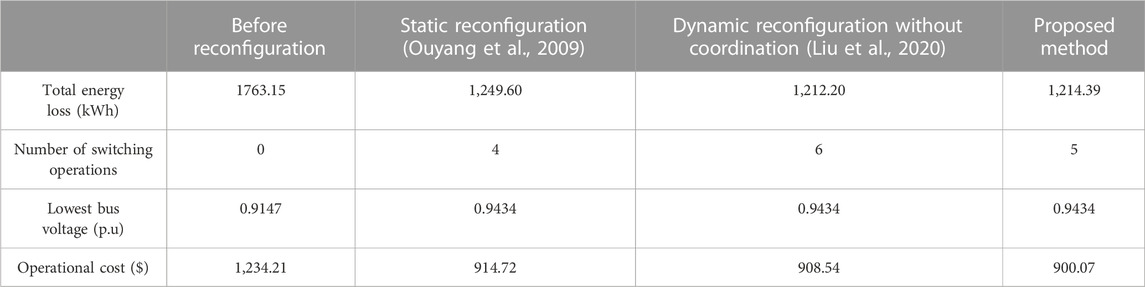
TABLE 2. Comparisons of reconfiguration results in Case 1.
Table 3 shows the influence of nodal power fluctuations on the lowest bus voltages. The traditional backward/forward sweep (BFS) algorithm is used to compare the power flow based on the sensitivity model (PFSM). The voltage error between the BFS and PFSM is no more than 0.33%. The branch power error between the BFS and PFSM is no more than 2.6%. It takes 60s to calculate power flow 100 times by BFS, and only 0.75s to calculate power flow 100 times by PFSM. The comparisons of the calculation accuracy and computation time prove the validity of the PFSM.
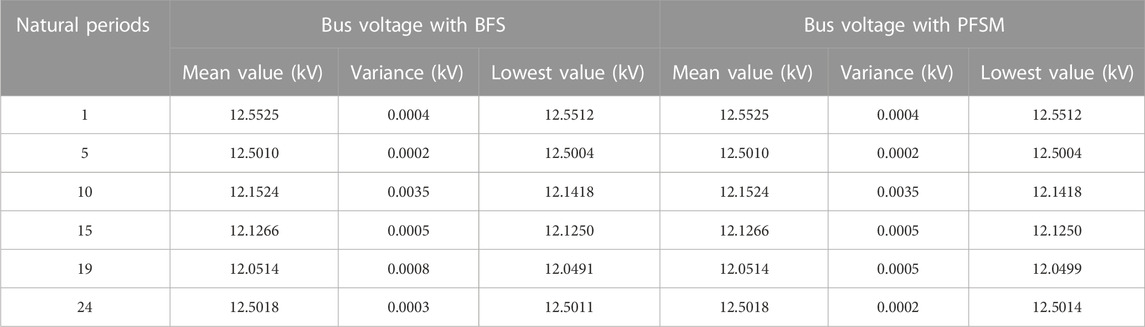
TABLE 3. Comparison of voltage results.
5.2 Case 2
The distribution system of the Taiwan Power Company (Wang et al., 2018) shown in Figure 10 is tested. The system consists of 11 feeders, 83 normally closed switches, and 13 normally open switches; the rated voltage is 11.4 kV and total active and reactive power loads are 28,350 kW and 20,700 kVar, respectively. The system is assumed to be three-phase balance in this work. The wind generations are installed at nodes 6, 13, 17, 19, 31, 34, 52, 58, 71, 79, and 33. The photovoltaic power generations are installed at nodes 7, 9, 12, 14, 21, 28, 45, 54, 64, and 75. The simulation parameters are the same as that of Case 1, except for the population size of the genetic algorithm that is 80.
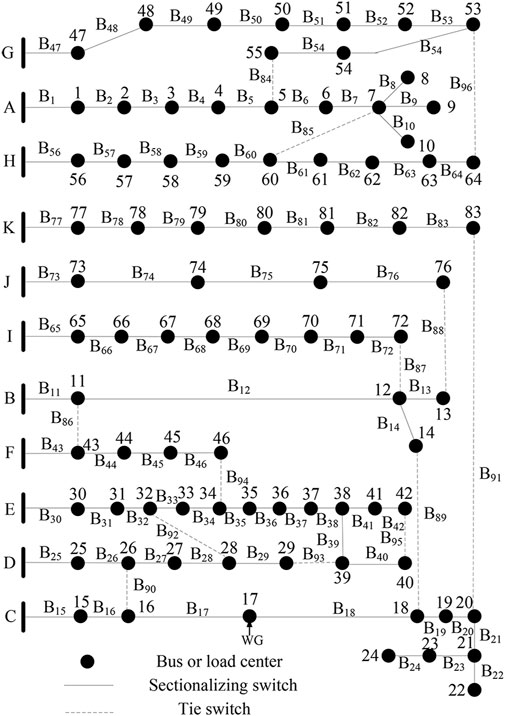
FIGURE 10. Distribution system of Taiwan Power Company.
Table 4 shows the reconfiguration results with and without interval coordination in Case 2. Table 5 analyzes the reconfiguration results of different reconfiguration methods. Through the proposed reconfiguration algorithm, the total energy loss decreases from 4,915.25 kWh to 4,382.13 kWh and operational cost decreases from 3,440.68$ to 3,157.49$. The lowest bus voltage increases from 0.9313 p.u. to 0.9510 p.u. The proposed DNDR algorithm improves the performance of the distribution networks. In the reconfiguration results without interval coordination, the number of switching operations is 11 and operational cost is 3,177.25$. In the proposed reconfiguration algorithm with interval coordination, the number of switching operations is nine and operational cost is 3,157.49$. The dynamic coordination among the different intervals can reduce the number of switching operations to cut the operational cost.

TABLE 4. Reconfiguration results in Case 2.
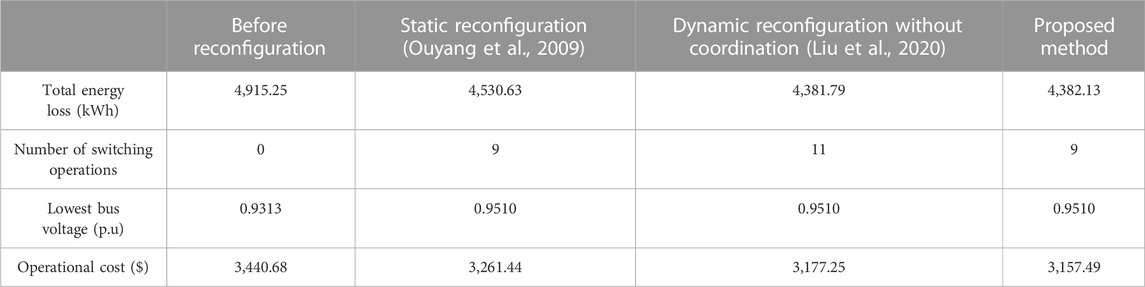
TABLE 5. Comparisons of reconfiguration results in Case 2.
Figures 11, 12 show the comparative results of power loss and node voltage before and after the dynamic reconfiguration. The simulation results show that the proposed dynamic reconfiguration method can effectively reduce the power loss and improve the voltage levels when the loads are heavy. Moreover, the influences of the DGs on power loss and node voltage are also considered. Before reconfiguration, the lowest node voltages are increased from 0.9291 p.u. to 0.9313 p.u. After reconfiguration, the lowest node voltages are increased from 0.9497 p.u. to 0.9510 p.u. The simulation results show that the appropriate DGs can decrease the net loads, reduce the power losses, and maintain the level of bus voltages.
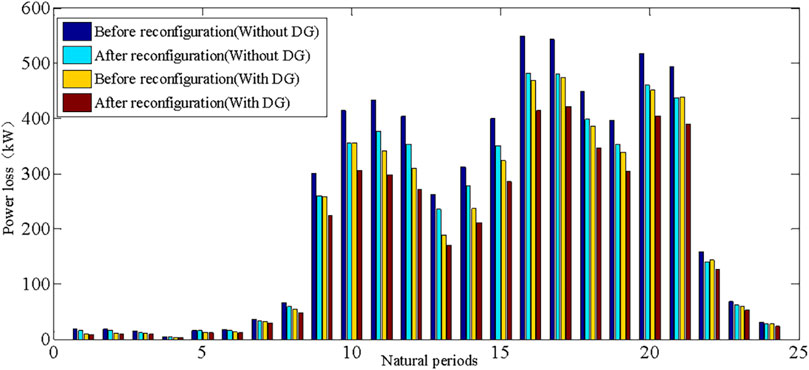
FIGURE 11. Comparison of power loss in each period before and after reconfiguration.
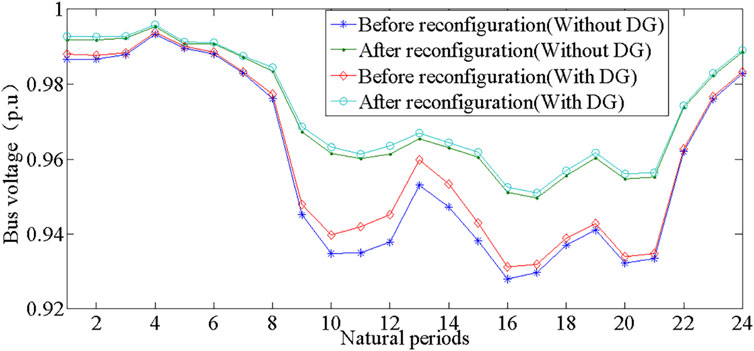
FIGURE 12. Comparison of lowest bus voltage in each period before and after reconfiguration.
6 Conclusion
This article presents a dynamic reconfiguration method of the distribution network considering the stochastic variations of loads and DG in power, and the following conclusions are drawn:
1) Both the power loss cost and switch operational cost are considered in the proposed dynamic reconfiguration method. The applied co-evolutionary algorithm can effectively coordinate the reconfiguration schedules among different time intervals to reduce the switch operational cost.
2) The effect of power fluctuation on the operation constraints is considered to ensure operational security. The voltage sensitivity models are used for PFCs, which can improve the computation efficiency of the DNDR.
Data availability statement
The original contributions presented in the study are included in the article/Supplementary Material; further inquiries can be directed to the corresponding author.
Author contributions
QL: conceptualization, formal analysis, methodology, and writing–original draft. LZ: formal analysis, visualization, and writing–review and editing. XJ: methodology and writing–review and editing. HS: supervision and writing–review and editing.
Funding
The author(s) declare financial support was received for the research, authorship, and/or publication of this article. This work was supported in part by the Natural Science Foundation of Shandong Province under Grant ZR2023QE238.
Conflict of interest
The authors declare that the research was conducted in the absence of any commercial or financial relationships that could be construed as a potential conflict of interest.
Publisher’s note
All claims expressed in this article are solely those of the authors and do not necessarily represent those of their affiliated organizations, or those of the publisher, editors, and reviewers. Any product that may be evaluated in this article, or claim that may be made by its manufacturer, is not guaranteed or endorsed by the publisher.
References
Gao, H., Ma, W., He, S., Wang, L., and Liu, J. (2022a). Time-segmented multi-level reconfiguration in distribution network: A novel cloud-edge collaboration framework. IEEE Trans. Smart Grid 13 (4), 3319–3322. doi:10.1109/TSG.2022.3156433
Gao, H., Ma, W., Xiang, Y., Tang, Z., Xu, X., Pan, H., et al. (2022b). Multi-objective dynamic reconfiguration for urban distribution network considering multi-level switching modes. J. Mod. Power Syst. Clean. Energy 10 (5), 1241–1255. doi:10.35833/MPCE.2020.000870
Haghighat, H., and Zeng, B. (2016). Distribution system reconfiguration under uncertain load and renewable generation. IEEE Trans. Power Syst. 31 (4), 2666–2675. doi:10.1109/TPWRS.2015.2481508
Harsh, P., and Das, D. (2023). A simple and fast heuristic approach for the reconfiguration of radial distribution networks. IEEE Trans. Power Syst. 38 (3), 2939–2942. doi:10.1109/TPWRS.2023.3256136
Hizarci, H., Demirel, O., and Turkay, B. E. (2022). Distribution network reconfiguration using time-varying acceleration coefficient assisted binary particle swarm optimization. Eng. Sci. Technol. Int. J. 35, 101230. doi:10.1016/j.jestch.2022.101230
Jakus, D., Čađenović, R., Vasilj, J., and Sarajčev, P. (2020). Optimal reconfiguration of distribution networks using hybrid heuristic-genetic algorithm. Energies 13 (7), 1544. doi:10.3390/en13071544
Kianmehr, E., Nikkhah, S., Vahidinasab, V., Giaouris, D., and Taylor, P. C. (2019). A resilience-based architecture for joint distributed energy resources allocation and hourly network reconfiguration. IEEE Trans. Ind. Inf. 15 (10), 5444–5455. doi:10.1109/TII.2019.2901538
Liu, Q., Ji, X., and Wang, H. (2020). Dynamic Reconfiguration of active distribution system based on matrix shifting operation and interval merger. J. Electr. Eng. Technol. 15, 621–633. doi:10.1007/s42835-020-00356-2
López, J. C., Lavorato, M. J., Franco, F., and Rider, M. J. (2016). Robust optimisation applied to the reconfiguration of distribution systems with reliability constraints. IET Gener. Transm. Distrib. 10 (4), 917–927. doi:10.1049/iet-gtd.2015.0558
Lotfi, H., Ghazi, R., and Naghibi-Sistani, M. (2020). Multi-objective dynamic distribution feeder reconfiguration along with capacitor allocation using a new hybrid evolutionary algorithm. Energy Syst. 11, 779–809. doi:10.1007/s12667-019-00333-3
Lotfi, H., and Ghazi, R. (2021). Optimal participation of demand response aggregators in reconfigurable distribution system considering photovoltaic and storage units. J. Ambient. Intell. Hum. Comput. 12, 2233–2255. doi:10.1007/s12652-020-02322-2
Ouyang, W., Cheng, H., Zhang, X., Yao, L., and Bazargan, M.(March 2009) “Random spanning tree based improved GA for distribution reconfiguration,” in Proceedings of the 2009 asia-pacific power and energy engineering conference, Wuhan, China, pp. 1–4. doi:10.1109/APPEEC.2009.4918634
Raj, V., and Kumar, B. K. (2020). A new affine arithmetic-based optimal network reconfiguration to minimize losses in a distribution system considering uncertainty using binary particle swarm optimization. Electr. Power Compon. Syst. 48 (6-7), 628–639. doi:10.1080/15325008.2020.1797940
Razavi, S. -M., Momeni, H. -R., Haghifam, M. -R., and Bolouki, S. (2022). Multi-objective optimization of distribution networks via daily reconfiguration. IEEE Trans. Power Deliv. 37 (2), 775–785. doi:10.1109/TPWRD.2021.3070796
Roosta, A., Eskandari, H. R., and Khooban, M. H. (2019). Optimization of radial unbalanced distribution networks in the presence of distribution generation units by network reconfiguration using harmony search algorithm. Neural. comput. Appl. 31, 7095–7109. doi:10.1007/s00521-018-3507-0
Santos, S. F., Gough, M., Fitiwi, D. Z., Pogeira, J., Shafie-khah, M., and Catalão, J. P. S. (2022). Dynamic distribution system reconfiguration considering distributed renewable energy sources and energy storage systems. IEEE Syst. J. 16 (3), 3723–3733. doi:10.1109/JSYST.2021.3135716
Sekhavatmanesh, H., and Cherkaoui, R. (2020). A multi-step reconfiguration model for active distribution network restoration integrating dg start-up sequences. IEEE Trans. Sustain Energy 11 (4), 2879–2888. doi:10.1109/TSTE.2020.2980890
Song, Y., Zheng, Y., Liu, T., Lei, S., and Hill, D. J. (2020). A new formulation of distribution network reconfiguration for reducing the voltage volatility induced by distributed generation. IEEE Trans. Power Syst. 35 (1), 496–507. doi:10.1109/TPWRS.2019.2926317
Sun, S., Li, G., Chen, C., Bian, Y., and Bie, Z. (2023). A novel formulation of radiality constraints for resilient reconfiguration of distribution systems. IEEE Trans. Smart Grid 14 (2), 1337–1340. doi:10.1109/TSG.2022.3220054
Wang, S., Liu, Q., and Ji, X. (2018). A fast sensitivity method for determining line loss and node voltages in active distribution network. IEEE Trans. Power Syst. 33 (1), 1148–1150. doi:10.1109/TPWRS.2017.2735898
Zhan, J., Liu, W., Chung, C. Y., and Yang, J. (2020). Switch opening and exchange method for stochastic distribution network reconfiguration. IEEE Trans. Smart Grid 11 (4), 2995–3007. doi:10.1109/TSG.2020.2974922
Zhang, C., Liu, Q., Zhou, Bin., Chung, C. Y., Li, J., Zhu, L., et al. (2023). A central limit theorem-based method for DC and AC power flow analysis under interval uncertainty of renewable power generation. IEEE Trans. Sustain. Energy 14 (1), 563–575. doi:10.1109/TSTE.2022.3220567
Zheng, W., Huang, W., Hill, D. J., and Hou, Y. (2021a). An adaptive distributionally robust model for three-phase distribution network reconfiguration. IEEE Trans. Smart Grid 12 (2), 1224–1237. doi:10.1109/TSG.2020.3030299
Keywords: dynamic reconfiguration, distributed generations, uncertainty, sensitivity, co-evolution
Citation: Liu Q, Zhang L, Ji X and Shi H (2023) Dynamic reconfiguration of distribution network considering the uncertainty of distributed generation and loads. Front. Energy Res. 11:1279579. doi: 10.3389/fenrg.2023.1279579
Received: 18 August 2023; Accepted: 18 September 2023;
Published: 06 October 2023.
Edited by:
Feng Zhang, Shandong University, ChinaCopyright © 2023 Liu, Zhang, Ji and Shi. This is an open-access article distributed under the terms of the Creative Commons Attribution License (CC BY). The use, distribution or reproduction in other forums is permitted, provided the original author(s) and the copyright owner(s) are credited and that the original publication in this journal is cited, in accordance with accepted academic practice. No use, distribution or reproduction is permitted which does not comply with these terms.
*Correspondence: Xingquan Ji, eHFqaUBzZHVzdC5lZHUuY24=