 Guanyang Li
 Junfei Wang
94% of researchers rate our articles as excellent or good
Learn more about the work of our research integrity team to safeguard the quality of each article we publish.
Find out more
ORIGINAL RESEARCH article
Front. Energy Res. , 14 September 2023
Sec. Sustainable Energy Systems
Volume 11 - 2023 | https://doi.org/10.3389/fenrg.2023.1276273
This article is part of the Research Topic Smart Energy System for Carbon Reduction and Energy Saving: Planning, Operation and Equipments View all 42 articles
The problem of non-ideal inertia of the photovoltaic energy storage system (PVESS) may occur due to unreasonable voltage control parameters. In response to this issue, this paper establishes an equivalent reduced-order model (EROM) for PVESS. This EROM considers the current control loop, voltage control loop and the virtual inertia control loop based on low-pass filter. This low-pass filter can effectively enhance the system’s virtual inertia. Since the output impedance of this EROM can visually reflect the external characteristics of the virtual inertia control loop, it is suitable for inertia analysis of PVESS. Furthermore, the impact of voltage control parameters and low-pass filter bandwidth on the system’s inertia is discussed from the perspective of the frequency response of the output impedance. Finally, the switch model of the PVESS is built on the RT-BOX hardware-in-the-loop experimental platform. The validity of the EROM and theoretical analysis is verified by several sets of experimental results.
With the rapid growth of photovoltaic power generation systems (Chang et al., 2017; Hatziargyriou et al., 2020), DC-based photovoltaic energy storage systems have attracted widespread attention (Dragičević et al., 2016; Dragičević et al., 2016). Both photovoltaics and energy storage need to be connected to the DC bus through power electronic converters (Li et al., 2022; Seane et al., 2022; Li et al., 2023). It’s worth noting that power electronic converters are the main reason for the low inertia of the photovoltaic energy storage system (PVESS). Unfortunately, low inertia can jeopardize the stable operation of the PVESS. Therefore, one of the main challenges currently faced is how to enhance the inertia of the PVESS.
Indeed, the full-order model can be utilized for analyzing system’s inertia. However, the expressions of the full-order model are relatively complex. As a result, the reduced-order model of PVESSs has gained increasing popularity among researchers (Huang et al., 2018). With the premise that the response speed of the virtual inertia control loops is significantly slower than that voltage and current control loops, the source converter is simplified as an ideal DC voltage source, as presented in literature (Tu et al., 2023). Building upon this, the inertia of the DC microgrid is analyzed through the established reduced-order model. However, in certain scenarios, the experimental results obtained from the switching model do not match the theoretical analysis conclusions derived from the reduced-order model. This is primarily attributed to the fact that the power converter is not a true ideal DC voltage source. Under the condition where the current loop control bandwidth is much faster than the voltage loop control bandwidth, a reduced-order circuit model for analyzing low-frequency oscillation issues in DC systems was developed in literature (Li et al., 2021). But, the accuracy and applicability of the reduced-order model is also relatively limited. Therefore, how to build a reduced-order model without neglecting the control parameters deserves in-depth study (Sun et al., 2022; Sun et al., 2022).
If the equivalent reduced-order model of the photovoltaic energy storage system has been established, the next step is to evaluate the system’s virtual inertia based on this model. Analytical methods such as state-space matrices (Deng et al., 2022; Deng et al., 2022) and transfer functions (Wu et al., 2017; You et al., 2022; Zhu et al., 2023) are commonly used theoretical foundations for studying inertia issues in PVESSs. Based on the established state-space model of the networked AC/DC microgrids, it was found in literature (Zhang et al., 2021) that inappropriate control parameters can lead to negative damping factors of the eigenvalues. For low-voltage DC systems with multiple energy storage converters, the system’s zero-poles are obtained using the transfer function model established in literature (Lin et al., 2021). Furthermore, both the system’s inertia and damping characteristics have been effectively improved through the proposed virtual inertia and damping control method. In fact, eigenvalues and zero-poles are more suitable for assessing small-signal stability of a system, but they are not appropriate for evaluating system’s inertia. To the best of the author’s knowledge, output impedance is a more suitable method for assessing system-level inertia. However, research in this area is largely lacking. Therefore, further research is needed on how to utilize the output impedance of this reduced-order model to evaluate the system’s inertia.
The virtual inertia controller not only enhances the system’s inertia but also improves the small-signal stability of the system. A low-pass filter-based virtual inertia control method is proposed in literature (Guo et al., 2017). This method effectively suppresses the oscillation peak in the output impedance of the energy storage converter at high-frequencies, thereby enhancing the small signal stability of the PVESS. In fact, the damping of the PVESS at specific oscillation frequencies can indeed be improved through appropriate virtual inertia control parameters. However, stability issues of the PVESS can also occur due to inappropriate virtual inertia control parameters (Mohamad et al., 2018). In literature (Tu et al., 2023), the influence of virtual inertia parameters on the small-signal stability of DC systems is investigated. However, the above-mentioned study was conducted under the assumption that voltage control parameters can be neglected. Moreover, the aforementioned literatures do not provide a suitable solution on how to solve the non-ideal inertia problem encountered by the PVESS. In order to address the issue of non-ideal inertia in DC microgrids, an inertia feedforward control method was proposed in literature (Zhu et al., 2020). However, this method would result in a more complex controller. Additionally, it would further burden the coordination pressure of control parameters among different control loops, making it less conductive to practical engineering applications. Therefore, for the non-ideal inertia problem caused by unreasonable control parameters, it will be more practical to design reasonable control parameters from the perspective of system-level inertia.
Considering the aforementioned issues, this paper will conduct research on the inertia of PVESSs based on the EROM. In this paper, the flowchart for virtual inertia estimation of the photovoltaic energy storage system is given as shown in Figure 1.
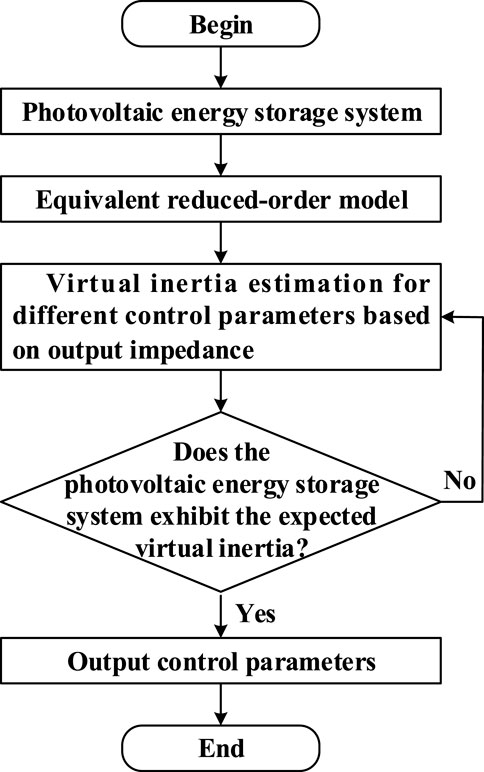
FIGURE 1. Flowchart for virtual inertia estimation of photovoltaic energy storage systems.
The rest of the paper is organized as follows. The issue of non-ideal inertia in PVESSs is introduced in Section 2. In Section 3, the EROM of the PVESS is established. The virtual inertia evaluation from the perspective of the output impedance of the EROM is presented by Section 4. Theoretical analysis and experimental validation are carried out in Sections 5, 6, respectively. Section 7 concludes.
The research objective of this paper is to study the non-ideal inertia of the photovoltaic energy storage system (PVESS), as depicted in Figure 2.
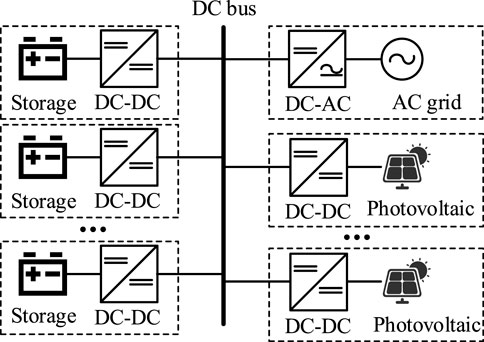
FIGURE 2. Topology of a typical PVESS.
If the DC-AC converter and photovoltaic converter in Figure 2 are replaced with ideal current sources, Figure 2 can be simplified to the form shown in Figure 3. Without loss of generality, the simplified PVESS in Figure 3 consists of x battery storage converters (BSCs). Clearly, the order of this simplified photovoltaic energy storage system model is 5x + 1.
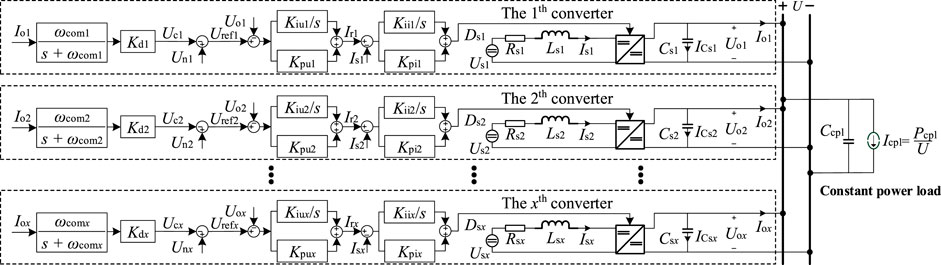
FIGURE 3. Topology and control block diagram of the simplified PVESS.
Where Rsy is the filter resistor of the yth BSC (y = 1,2,…,x), Lsy is the filter inductor of the yth BSC, Csy is the filter capacitor of the yth BSC, Dsy is the duty factor of the yth BSC, Usy is the input voltage of the yth BSC, Isy is the filter inductor current of the yth BSC, Uoy is the output voltage of the yth BSC, Ioy is the output current of the yth BSC, ICsy is the filter capacitor current of the yth BSC, Iry is the filter inductor current reference of the yth BSC, Kpiy is the proportional coefficient of the yth current controller, Kiiy is the integral coefficient of the yth current controller, Kpuy is the proportional coefficient of the yth voltage controller, Kiuy is the integral coefficient of the yth voltage controller, Urefy is the voltage reference of the yth BSC, Kdy is the droop coefficient of the yth droop controller, Uny is the rated voltage of the yth BSC, Ucy is the output signal of the yth droop controller, ωcomy is the low-pass filter bandwidth of the yth BSC, Ccpl is the input filter capacitor of the constant power load, Icpl is the input current of the constant power load, Pcpl is the power of the constant power load, U is the DC bus voltage, d is the differential operator, t is the time.
There are two application methods to enhance inertia in PVESSs, and their control structure are shown in Figure 4. In fact, these two control methods can be mutually converted (Samanta et al., 2018; Neto et al., 2020). Details are provided in Eq. 1. Therefore, the research work with Figure 3 will continue to be carried out by this paper.
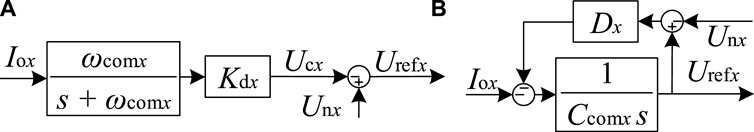
FIGURE 4. Two application methods to enhance inertia in PVESS. (A) The method of low-pass filter approach. (B) The method of virtual synchronous generator.
Where Ccomy is the virtual capacitor of the yth BSC, Dy is the damping gain of the yth BSC.
Taking a typical PVESS consisting of two BSCs as an example, the switch model of the system is constructed using the RT-BOX hardware-in-the-loop experimental platform, as shown in Figure 5. It is assumed that all BSCs are produced by the same manufacture, and their circuit parameters and control parameters are the same. The system parameters are show in Table 1.
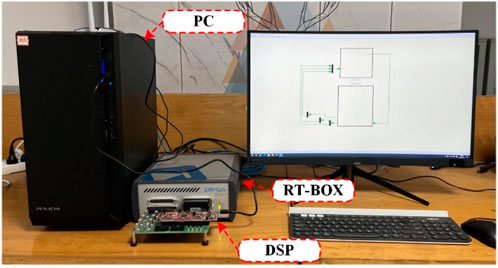
FIGURE 5. RT-BOX hardware-in-the-loop experimental platform.
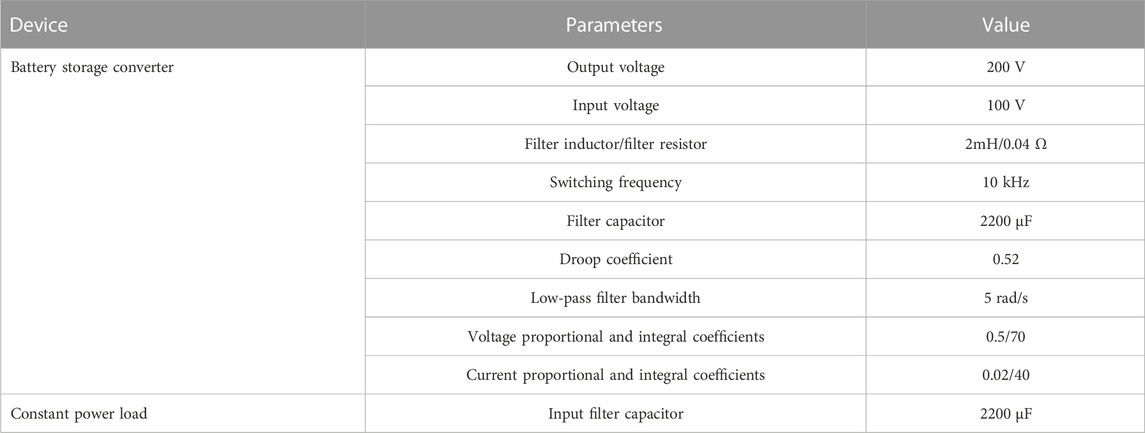
TABLE 1. Parameters of PVESS.
At 0.8 s, the power of constant power load step from 0.7 to 1.4 kW. The experimental result of the DC bus voltage of this system is shown in Figure 6. From Figure 6, it can be observed that the time-domain results of the DC bus voltage demonstrate a dynamic process characteristic of non-ideal inertia. Moreover, a second-order oscillatory characteristic with an oscillation frequency of approximately 10.7 Hz emerges during this dynamic process.
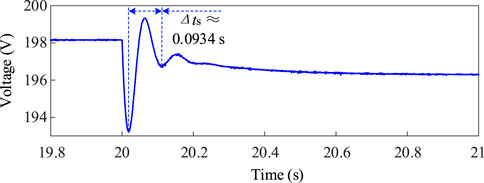
FIGURE 6. Time-domain experimental results of the PVESS.
To address the non-ideal inertia issue encountered by the PVESS, a equivalent reduced-order model (EROM) will be established in this paper. The topology and control block diagram of the EROM are shown in Figure 7.

FIGURE 7. Topology and control block diagram of the EROM.
Where Re is the filter resistor of the EROM, Le is the filter inductor of the EROM, Cs is the filter capacitor of the EROM, De is the duty factor of the EROM, Us is the input voltage of the EROM, Is is the filter inductor current of the EROM, Uo is the output voltage of the EROM, Io is the output current of the EROM, ICs is the filter capacitor current of the EROM, Ir is the filter inductor current reference of the EROM, Kpi is the proportional coefficient of the equivalent current controller, Kii is the integral coefficient of the equivalent current controller, Kpu is the proportional coefficient of the equivalent voltage controller, Kiu is the integral coefficient of the equivalent voltage controller, Kd is the droop coefficient of the EROM, ωcom is the low-pass filter bandwidth of the EROM.
At the beginning of the modeling, the effect of the control loops is not considered. In other words, the duty factor of each BSC is a rated constant. Then, the state equation of the PVESS can be written as
In the PVESS, it can be assumed that the open-loop transfer function from the duty factor Dsy of the yth BSC to the DC bus voltage U is denoted as Gudy(s). By linearizing Eq. 2, we can obtain the expression for the open-loop transfer function Gudy(s), as shown below.
Where the subscript “0” indicates the steady-state value, hy is the current-averaging factor of the yth BSC, and there exists ∑hy = 1.
Now, assuming Ce and Rcpl as the equivalent filter capacitor and equivalent resistor respectively. Since each BSC is produced by the same manufacture, the following equation can be obtained.
Also, since the duty factor Dsy of the yth BSC is equal to the duty factor Ds(y+1) of the (y + 1)th BSC. If not specifically stated, De will be used uniformly instead of the duty factor of each BSC. Because of the existence of Eqs 3, 4 can be written in the form of Eq. 5.
Since the BSCs in the PVESS are interconnected in parallel, the DC bus voltage is by all BSCs. From the perspective of reduced-order modeling, it is necessary to aggregate the transfer functions Gudy(s) of all BSCs to obtain the system-level transfer function Gudsys(s), which can be expressed as follows:
Assuming that a EROM can be established for the PVESS, the following equation holds:
For the yth BSC, considering the current control parameters, the expression for the duty factor can be written as follows:
By linearizing Eq. 2 and Eqs 6–8 separately and combing the resulting linearized equations, the system-level voltage closed-loop transfer function Guiucomsys(s) can be obtained as follows:
The expression for the voltage closed-loop transfer function Guiucomeq(s) in the EROM is given as follows:
It can be observed that the mathematical expressions in Eqs 9, 10 are identical. Therefore, mathematical analytical expressions can be established for the voltage control parameters between each BSCs and the EROM, as shown below.
The correctness of the equations will be verified through frequency sweep measurements (Feng et al., 2022). The specific schematic of the measurement is shown in Figure 8.
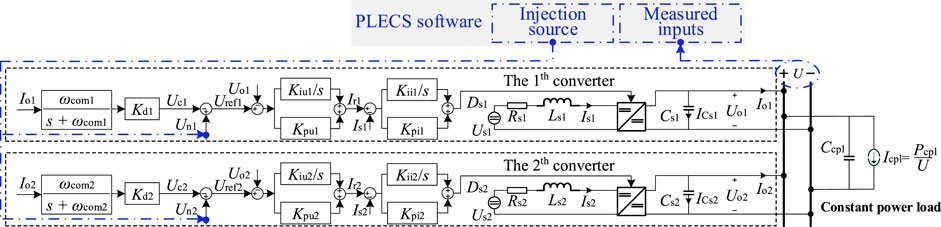
FIGURE 8. Schematic diagram of transfer function Guiucomsys(s) measurement.
As shown in Figure 9, the frequency response curve of the measured results is essentially consistent with the derived transfer function Guiucomsys(s) over a wide frequency range (e.g., 1 Hz to 1 kHz).
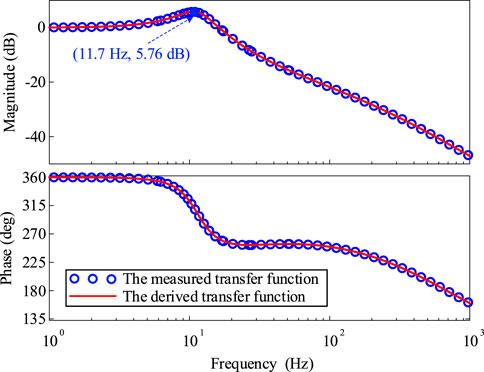
FIGURE 9. Bode diagram of transfer function Guiucomsys(s).
Similarly, this EROM is built on the RT-BOX hardware-in-the-loop experimental platform. Under the same load disturbance conditions, the time-domain results of the EROM are shown in Figure 9. As depicted in Figure 10, the time-domain responses of the PVESS and its EROM are largely consistent. This outcome validates the accuracy of the proposed EROM in this study.
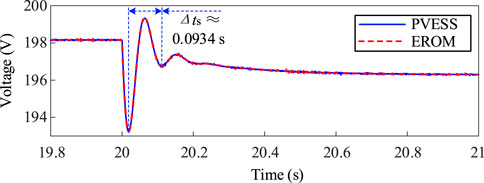
FIGURE 10. Time-domain experimental results of the EROM.
In the existing studies, the small signal stability of a PVESS can be judged through zero-poles or eigenvalues. However, these methods may not provide an intuitive evaluation of the inertia characteristics of the PVESS. Therefore, in this paper, the system-level inertia will be evaluated in terms of the output impedance frequency-domain response of the EROM. The mathematical equation for the output impedance Zout(s) of the EROM can be written as
In order to verify the correctness of Eq. 14, it will be verified by the frequency sweep measurement shown in Figure 11.
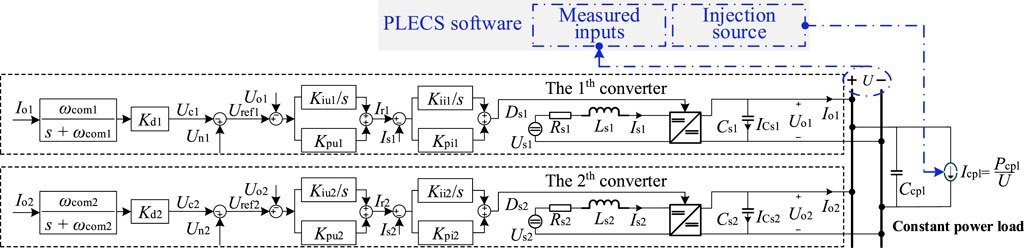
FIGURE 11. Schematic diagram of output impedance Zout(s) measurement.
The theoretical frequency response curves and measurements of the output impedance Zout(s) are given by Figure 12. As can be seen from Figure 12, the validity of the theoretical response curve is verified by the measurement results over a wide frequency range (e.g., 1 Hz to 1 kHz).
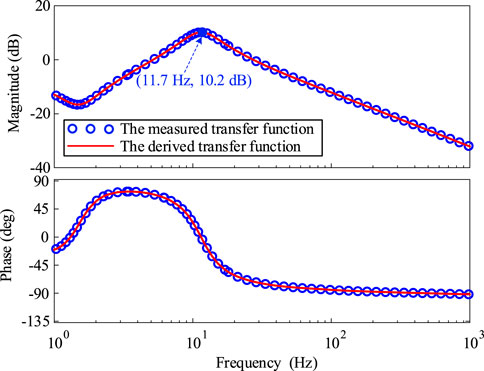
FIGURE 12. Bode diagram of the output impedance Zout(s).
The time scale of the virtual inertia characteristics of the photovoltaic energy storage system is typically in the order of seconds, falling within the low-frequency range, such as around 1 Hz. Therefore, this paper evaluates the virtual inertia of the photovoltaic energy storage system based on the magnitude-frequency curve of the output impedance in the low-frequency range. As shown in Figure 12, an LC oscillation loop at a frequency of 11 Hz can be observed from the magnitude curve of the output impedance. This implies that a low-frequency oscillation can be observed in the time-domain response of the DC bus voltage.
The zero-pole diagram of the output impedance is also provided, as shown in Figure 13. All the zero-poles of the output impedance are given by Figure 13A. In addition, the distribution of the zero-poles within the dashed box in Figure 13A is provided by Figure 13B. According to Figure 13, it can be observed that the oscillation frequency of the conjugate poles is approximately 11.5 Hz, which closely aligns with the experimental results shown in Figure 11. Based on this, it can be inferred that the zero-poles are better suited for assessing the oscillation frequency characteristics of the system rather than the virtual inertia.
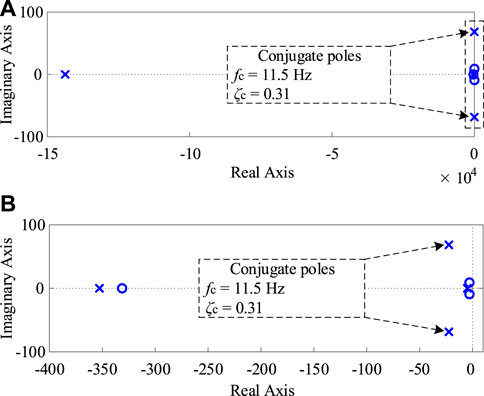
FIGURE 13. Zero-pole diagram of the output impedance Zout(s). (A) All zero-poles. (B) Zero-poles of the partial zoomed view.
As mentioned above, this paper will proceed to evaluate the system’s virtual inertia based on the magnitude-frequency curve of the output impedance in the low-frequency range.
(1) The impact of voltage proportional coefficients on system-level inertia
The bode diagram of output impedance for voltage proportional coefficients of 0.5, 1.5, 11.5 and 31.5 is shown in Figure 14. As the voltage proportional coefficient increases from 0.5 to 31.5, the magnitude curve of the output impedance exhibits virtual inertia characteristics in the low-frequency range.
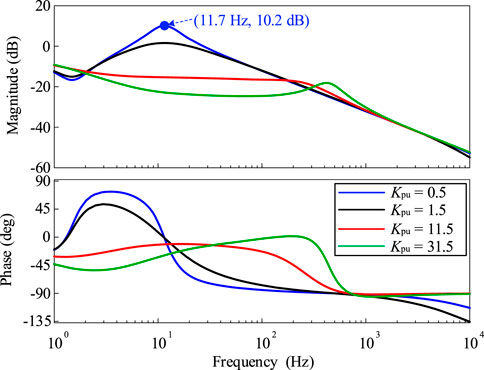
FIGURE 14. Bode diagram of output impedance for different voltage proportional coefficients.
The zero-poles diagram of output impedance for voltage proportional coefficients of 0.5, 1.5, 11.5 and 31.5 is shown in Figure 15. According to Figure 15, the zero-pole diagram does not directly reflect the response characteristics of the output impedance in the low-frequency range. Further, the zero-pole diagram is difficult to be used to evaluate the virtual inertia of the system.
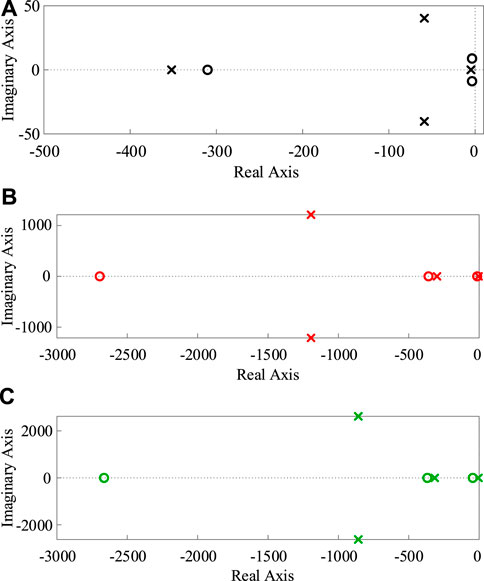
FIGURE 15. Zero-pole diagram of output impedance for different voltage proportional coefficients. (A) Kpu = 1.5. (B) Kpu = 11.5. (C) Kpu = 31.5.
Based on the above theoretical analysis, it can be inferred that smaller voltage proportional coefficients may lead to the occurrence of non-ideal inertia issues in the PVESS. It is worth noting that as the voltage proportional coefficient increases, the system may transition from non-ideal inertia to ideal inertia. In other words, the voltage proportional coefficient has a significant impact on the inertia of the PVESS.
(2) The impact of voltage integral coefficients on system-level inertia
The bode diagram of output impedance for voltage integral coefficients of 7, 70, 170 and 270 is shown in Figure 16. As the voltage integral coefficient increases, the magnitude of the output impedance in the low-frequency range remains almost unchanged. This indicates that the variation in virtual inertia is not very significant.
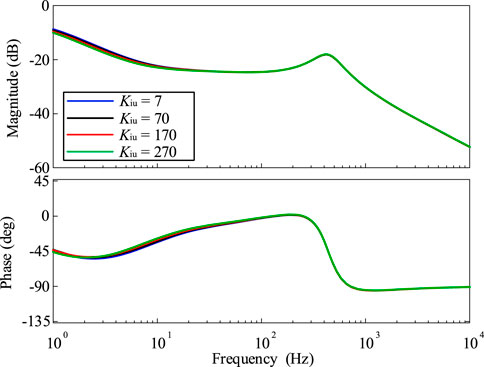
FIGURE 16. Bode diagram of output impedance for different voltage integral coefficients.
The zero-poles diagram of output impedance for voltage integral coefficients of 7, 70, 170 and 270 is shown in Figure 17. For convenience, the zero-pole diagram in Figure 17 are all for the low-frequency time-scale range.
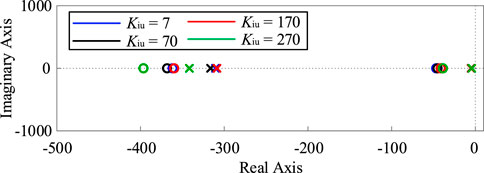
FIGURE 17. Zero-pole diagram of output impedance for different voltage integral coefficients.
The bode diagram of output impedance for low-pass filter bandwidths of 0.5, 1, 2 and 5 rad/s is shown in Figure 18. As observed from Figure 18, it is evident that with the decrease in the low-filter bandwidth, the magnitude of the output impedance in the low-frequency range gradually reduces. This indicates that the inertia of PVESS is gradually increasing.
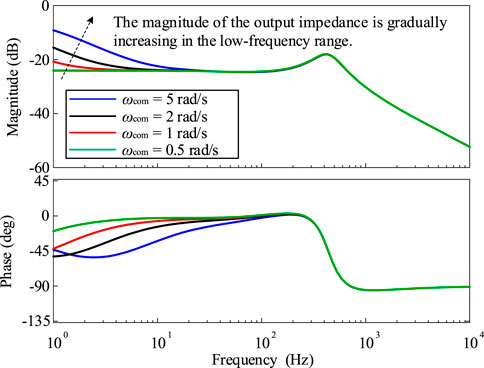
FIGURE 18. Bode diagram of output impedance for different low-pass filter bandwidths.
The zero-poles diagram of output impedance for low-pass filter bandwidths of 0.5, 1, 2 and 5 rad/s is shown in Figure 19. Consistent with Figure 17, the zero-pole diagram in Figure 19 are also all for the low-frequency time-scale range.
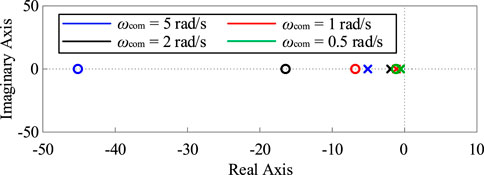
FIGURE 19. Zero-pole diagram of output impedance for different low-pass filter bandwidths.
(1) The impact of voltage proportional coefficients on system-level inertia
At 20 s, the constant power load steps up from 0.7 to 1.4 kW. Under this load disturbance condition, the time-domain experimental results for different voltage proportional coefficients of 0.5, 1.5, 11 and 31 are shown in Figure 20. The experimental oscillation frequency of 10.7 Hz closely corresponds to the theoretical analysis results of 11.7 Hz presented in Figure 13. thereby validating the accuracy of the theoretical analysis. However, the voltage proportional coefficient is set to 31, the simulated results of the DC bus voltage exhibit ideal inertia characteristics. Furthermore, the dynamic process is relatively slow. The experimental results in Figure 20 validate the effectiveness of the theoretical analysis.
(2) The impact of voltage integral coefficients on system-level inertia
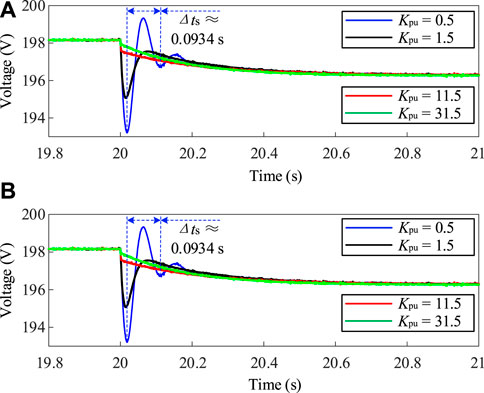
FIGURE 20. Time-domain experimental results for different voltage proportional coefficients. (A) Time-domain experimental results of the PVESS. (B) Time-domain experimental results of the EROM.
Under the same load disturbance conditions, the time-domain experimental results for voltage integral coefficients of 7, 70, 170 and 270 are shown in Figure 21. The experimental results provided by Figure 21 indicate that, with the increase of the voltage integral coefficient, there is almost no change in the dynamic behavior of the DC bus voltage. Therefore, in comparison to the voltage gain coefficient, the influence of the voltage integral coefficient on the system-level inertia can be disregarded.
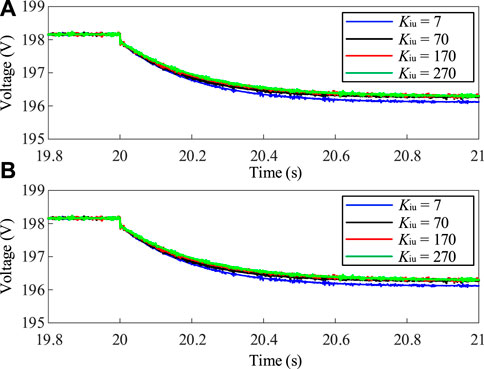
FIGURE 21. Time-domain experimental results for different voltage integral coefficients. (A) Time-domain experimental results of the PVESS. (B) Time-domain experimental results of the EROM.
Under the same load disturbance conditions, i.e., a constant power load increasing from 0.7 to 1.4 kW. The experimental results for different low-pass filter bandwidths of 0.5, 1, 2 and 5 rad/s are shown in Figure 22. As shown in Figure 22, it can be observed that with the decrease in the bandwidth of the low-pass filter, the dynamic process of the DC bus voltage becomes slower. This implies that the inertia of the PVESS is gradually becoming stronger. This validates the accuracy of the theoretical analysis.
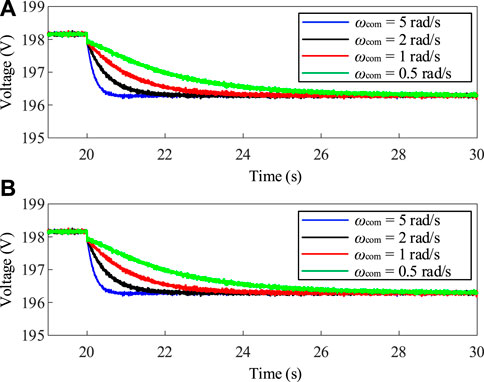
FIGURE 22. Time-domain experimental results for different low-pass filter bandwidths. (A) Time-domain experimental results of the PVESS. (B) Time-domain experimental results of the EROM.
In this paper, an equivalent reduced-order model (EROM) for inertia analysis of photovoltaic energy storage system is developed. With the output impedance of the EROM, the effect of the voltage control parameters and the bandwidth of the low-pass filter on the inertia of the system is directly evaluated. The direct cause of non-ideal inertia in time-domain experimental results is the presence of an LC oscillation loop in the low-frequency range of the output impedance. However, the fundamental reason behind this phenomenon is the use of a relatively small voltage proportional coefficient. With the increase of the voltage proportional coefficient, the output impedance exhibits virtual capacitance characteristics in the low-frequency range. In this scenario, the dynamic processes of the time-domain experimental results also exhibit ideal inertia characteristics. Compared to the voltage proportional coefficient, the system’s inertia is nearly unaffected by the voltage integral coefficient. Building upon this voltage control parameters, as the bandwidth of the low-pass filter is reduced, the magnitude of the output impedance decreases in the low-frequency range. Simultaneously, the dynamic process of the time-domain experimental results becomes slower, indicating that the system’s inertia is being enhanced.
In some photovoltaic energy storage systems, the battery storage converters need to be connected to the common DC bus via their respective DC lines. In this scenario, the selection range of the low-pass filter bandwidth will be limited by the DC line. However, the DC lines are not considered by the equivalent reduced-order model constructed in this paper. In the future, the effect of DC lines on the virtual inertia of the system will be discussed. In addition, how to analyze the large-signal stability of the system at different virtual inertia is also a focus of future work.
The raw data supporting the conclusion of this article will be made available by the authors, without undue reservation.
GL: Formal Analysis, Resources, Software, Writing–original draft. JW: Funding acquisition, Methodology, Project administration, Writing–review and editing. XW: Writing–review and editing. LZ: Resources, Writing–review and editing.
The author(s) declare financial support was received for the research, authorship, and/or publication of this article. This work is supported by the Science and Technology Project of Shandong Electric Power Engineering Consulting Institute Corp., Ltd. (Distributed intelligent grid active voltage coordination control technology and applications based on photovoltaic energy storage synchronous generators, No. 37-K2023-142).
Authors GL, JW, XW, and LZ were employed by Shandong Electric Power Engineering Consulting Institute Corp., Ltd.
The authors declare that this study received funding from Science and Technology Project of Shandong Electric Power Engineering Consulting Institute CORP., LTD. The funder had the following involvement in the study: Provided data support and HIL experimental design.
All claims expressed in this article are solely those of the authors and do not necessarily represent those of their affiliated organizations, or those of the publisher, the editors and the reviewers. Any product that may be evaluated in this article, or claim that may be made by its manufacturer, is not guaranteed or endorsed by the publisher.
Chang, J., Du, Y., Chen, X., Lim, E., Wen, H., Li, X., et al. (2022). Frequency regulation in adaptive virtual inertia and power reserve control with high PV penetration by probabilistic forecasting. Front. Energy Res. 10, 929113. doi:10.3389/fenrg.2022.929113
Deng, H., and Fang, J. (2022). State-space modeling, stability analysis, and controller design of grid-forming converters with distributed virtual inertia. Front. Energy Res. 8 (26). 833387. doi:10.3389/fenrg.2022.833387
Deng, W., Pei, W., Zhuang, Y., and Zhang, X. (2022). Interaction behavior and stability analysis of low-voltage multi-terminal DC system. IEEE Trans. Power Deliv. 37 (5), 3555–3566. doi:10.1109/TPWRD.2021.3131218
Dragičević, T., Lu, X., Vasquez, J., and Guerrero, J. (2016). DC microgrids—Part I: A review of control strategies and stabilization techniques. IEEE Trans. Power Electron. 31 (7), 1–4891. doi:10.1109/TPEL.2015.2478859
Dragičević, T., Lu, X., Vasquez, J., and Guerrero, J. (2016). DC microgrids—Part II: A review of power architectures, applications, and standardization issues. IEEE Trans. Power Electron. 31 (5), 3528–3549. doi:10.1109/TPEL.2015.2464277
Feng, F., Fang, J., Manandhar, U., Gooi, H., and Wang, L. (2022). Impedance modeling and stability-oriented parameter optimization of isolated dual active bridge-based two-stage AC-DC-DC converter. Front. Energy Res. 30 (6). 874467. doi:10.3389/fenrg.2022.874467
Guo, L., Zhang, S., Li, X., Li W., Y., Wang, C., and Feng, Y. (2017). Stability analysis and damping enhancement based on frequency-dependent virtual impedance for DC microgrids. IEEE J. Emerg. Sel. Top. Power Electron. 5 (1), 338–350. doi:10.1109/JESTPE.2016.2598821
Hatziargyriou, N., Milanovic, J., Rahmann, C., Ajjarapu, V., Canizares, C., Erlich, I., et al. (2021). Definition and classification of power system stability – revisited & extended. IEEE Trans. Power Syst. 36 (4), 3271–3281. doi:10.1109/TPWRS.2020.3041774
Huang, Y., Zhai, X., Hu, J., Liu, D., and Lin, C. (2018). Modeling and stability analysis of VSC internal voltage in DC-link voltage control Timescale. IEEE J. Emerg. Sel. Top. Power Electron. 6 (1), 16–28. doi:10.1109/JESTPE.2017.2715224
Li, C., Liu, X., Wang, R., Zhang, Y., and Zhang, L. (2022). An improved dual-loop feedforward control method for the enhancing stability of grid-connected PV and energy storage system under weak grids. Front. Energy Res. 22 (6). 939376. doi:10.3389/fenrg.2022.939376
Li, P., Guo, L., Li, X., Wang, H., Zhu, L., Gao, F., et al. (2021). Reduced-order modeling and comparative dynamic analysis of DC voltage control in DC microgrids under different droop methods. IEEE Trans. Energy Convers. 36 (4), 3317–3333. doi:10.1109/TEC.2021.3076438
Li, Z., Wu, L., Xu, Y., Wang, L., and Yang, N. (2023). Distributed tri-layer risk-averse stochastic game approach for energy trading among multi-energy microgrids. Appl. Energy 331, 120282. doi:10.1016/j.apenergy.2022.120282
Lin, G., Ma, J., Li, Y., Rehtanz, C., Liu, J., Wang, Z., et al. (2021). A virtual inertia and damping control to suppress voltage oscillation in islanded DC microgrid. IEEE Trans. Energy Convers. 36 (3), 1711–1721. doi:10.1109/TEC.2020.3039364
Mohamad, A., and Mohamed, Y. (2018). Impedance-based analysis and stabilization of active DC distribution systems with positive feedback islanding detection schemes. IEEE Trans. Power Electron. 33 (11), 9902–9922. doi:10.1109/TPEL.2018.2790945
Neto, P., Barros, T., Silveira, J., Filho, E., Vasquez, Z., and Guerrero, J. (2020). Power management Strategy based on virtual inertia for DC microgrids. IEEE Trans. Power Electron. 35 (11), 12472–12485. doi:10.1109/TPEL.2020.2986283
Samanta, S., Mishra, J., and Roy, B. (2018). Virtual DC machine: an inertia emulation and control technique for a bidirectional DC–DC converter in a DC microgrid. IET Electr. Power Appl. 12 (6), 874–884. doi:10.1049/iet-epa.2017.0770
Seane, T. B., Samikannu, R., and Bader, T. (2022). A review of modeling and simulation tools for microgrids based on solar photovoltaics. Front. Energy Res. 10, 772561. doi:10.3389/fenrg.2022.772561
Sun, J., Mihret, M., Cespedes, M., Wong, D., and Kauffman, M. (2022). Data center power system stability — Part II: system modeling and analysis. CSEE J. Power Energy Syst. 8 (2), 420–438. doi:10.17775/CSEEJPES.2021.02020
Sun, J., Xu, M., Cespedes, M., and Kauffman, M. (2022). Data center power system stability — Part I: power supply impedance modeling. CSEE J. Power Energy Syst. 8 (2), 403–419. doi:10.17775/CSEEJPES.2021.02010
Tu, H., Yu, H., and Lukic, S. (2023). Impact of virtual inertia on DC grid stability with constant power loads. IEEE Trans. Power Electron. 38 (5), 5693–5699. doi:10.1109/TPEL.2023.3243138
Wu, W., Chen, Y., Luo, A., Zhou, L., Zhou, X., Yang, L., et al. (2017). A virtual inertia control Strategy for DC microgrids analogized with virtual synchronous Machines. IEEE Trans. Industrial Electron. 64 (7), 6005–6016. doi:10.1109/TIE.2016.2645898
You, F., Si, X., Dong, R., Lin, D., Xu, Y., and Xu, Y. (2022). A state-of-charge-based flexible synthetic inertial control Strategy of battery energy storage systems. Front. Energy Res. 10, 908361. doi:10.3389/fenrg.2022.908361
Zhang, Y., Sun, Q., Zhou, J., Li, L., Wang, P., and Guerrero, J. (2021). Coordinated control of networked AC/DC microgrids with adaptive virtual inertia and governor-gain for stability enhancement. IEEE Trans. Energy Convers. 36 (1), 95–110. doi:10.1109/TEC.2020.3011223
Zhu, L., Liu, Q., Liu, S., Wang, Z., Meng, J., Gu, L., et al. (2023). An adaptive neural fuzzy virtual inertia control method for VSC-HVDC system. Front. Energy Res. 10, 1109277. doi:10.3389/fenrg.2022.1109277
Keywords: photovoltaic energy storage system, equivalent reduced-order model, low-pass filter, output impedance, voltage control parameters, virtual inertia
Citation: Li G, Wang J, Wang X and Zhang L (2023) Virtual inertia analysis of photovoltaic energy storage systems based on reduced-order model. Front. Energy Res. 11:1276273. doi: 10.3389/fenrg.2023.1276273
Received: 11 August 2023; Accepted: 28 August 2023;
Published: 14 September 2023.
Edited by:
Zhengmao Li, Aalto University, FinlandReviewed by:
Xialin Li, Tianjin University, ChinaCopyright © 2023 Li, Wang, Wang and Zhang. This is an open-access article distributed under the terms of the Creative Commons Attribution License (CC BY). The use, distribution or reproduction in other forums is permitted, provided the original author(s) and the copyright owner(s) are credited and that the original publication in this journal is cited, in accordance with accepted academic practice. No use, distribution or reproduction is permitted which does not comply with these terms.
*Correspondence: Guanyang Li, c2R1dGRxenhzQDE2My5jb20=
Disclaimer: All claims expressed in this article are solely those of the authors and do not necessarily represent those of their affiliated organizations, or those of the publisher, the editors and the reviewers. Any product that may be evaluated in this article or claim that may be made by its manufacturer is not guaranteed or endorsed by the publisher.
Research integrity at Frontiers
Learn more about the work of our research integrity team to safeguard the quality of each article we publish.