 Fei Jin
 Mingkai Weng
 Bin Wu
- State Grid Hebei Energy Technology Service Co Ltd., Shijiazhuang, China
The improvement of the AGC regulation capability of thermal power plants is very important for the secure and stable operation of the power grid, especially in the situation of large-scale renewable energy access to the power grid. In this study, the prediction and optimization for the AGC regulation capability of thermal power plants is proposed. Firstly, considering parameters related to the AGC regulation of the thermal power plant, the max-relevance and min-redundancy (mRMR) is used to extract features from historical sequences of the parameters. Next, a model with multi-long short-term neural networks (mLSTM) is constructed to predict the AGC regulation capability; that is, the obtained feature set is considered as the inputs of the first LSTM sub-model to predict future values of the main steam pressure and main steam temperature, which are then utilized as the inputs of the second LSTM sub-model to predict the actual power generation during AGC regulation operation. Then, the AGC regulation index is calculated according to the “management rules of grid-connected operation of power plant in Northern China” and “management rules of auxiliary service of the grid-connected power plant in Northern China” (i.e., “two rules”), and it is then considered as the objective function to be maximized by optimizing the coal feed rate, air supply rate, and feedwater flow rate. Finally, the actual AGC regulation process of a 300 MW coal-fired power plant is used as an application, and the results show that the proposed method can effectively predict and improve the regulation capability when the AGC instruction is received from the power grid.
1 Introduction
To achieve green and low-carbon development in energy, the Chinese government has put forward the development strategy of “carbon peak and carbon neutrality”, and the electrical power industry has continuously adjusted its energy structure (Yang et al., 2022). A large number of uncertain and fluctuating renewable energy power, which mainly includes solar energy and wind energy, has been connected to the power grid (Wang et al., 2023a). Currently, it is impractical and expensive to build large-scale energy storage to absorb the impact of the intermittent, strong fluctuations in the power supply of renewable energy to the grid. Thus, the load regulation capacity of thermal power units in response to automatic generation control (AGC) directly affects the power grid regulation security. Due to the need for deep peak shaving conditions, the power grid has put forward higher requirements for the coordinated control ability of thermal power plants (Wang et al., 2023b). Therefore, the accurate prediction and improvement of the AGC regulation capability of thermal power plants is of great significance for ensuring the safe operation of the power grid system (Li et al., 2023; Zhou et al., 2023).
To encourage thermal power plants to improve regulatory flexibility and AGC regulation capability, the Chinese National Energy Administration laid down the rules suitable for grid-connected entities involving power dispatching, that is, “management rules of grid-connected operation of power plant in Northern China” and “management rules of auxiliary service of the grid-connected power plant in Northern China” (i.e., “two rules”). The “two rules” clarifies the calculation method of the regulation capability index
Considering the uncertainty and non-linearity of the process characteristics of thermal power plants, researchers have constructed neural network models to predict the regulation capability of responding to the AGC instruction from the power grid. For example, Chen et al. (Chen and Wang, 2016) proposed a neural network-based predictive control algorithm to handle nonlinear problems in the AGC response. Xi et al. (Xi et al., 2020) proposed a novel DPDPN algorithm to improve AGC power allocation, and the predictive capability of deep learning was combined with the decision-making ability of reinforcement learning in the DPDPN method. Peng et al. (Peng et al., 2019) combined the optimization strategy of traditional predictive control with a neural network and proposed a new system-fitting algorithm based on the Bayesian neural network; however, it failed to consider the screening of variables and features, which led to long training time of the network and inadequate prediction accuracy. Wang et al. (Wang et al., 2021) utilized a long short-term memory neural network (LSTM) model to evaluate the performance of thermal power plants, and the prediction results were more accurate and stable, but they did not consider the feature selection problem in the model construction. To solve this problem, Ref (Liang et al., 2019) proposed a max-relevance and min-redundancy (mRMR) algorithm for feature extraction, thereby improving the model training efficiency. Therefore, in this paper, the AGC influencing factors are analyzed and extracted by using the mRMR algorithm, and the obtained variables are then taken as the inputs to the LSTM model to predict the AGC regulation capability of the power plant.
At present, the common approaches to improve the power generation change rate of thermal power units can include condensate throttling, steam extraction of heating units, refrigerant throttling of condensers, etc. (Hegazy et al., 2016; Zhang et al., 2021; Liu et al., 2023). These methods can greatly improve the dynamic characteristics of thermal power plants, shorten the response time of units, and increase the primary and secondary frequency regulation capabilities through rational utilization of turbine-side energy storage. For example, the condensate throttling control mainly uses the working medium storage capacity provided by the condensate water tank and the deaerator tank; thus, the energy originally used for heating the feed water in the reheating system can be temporarily utilized to increase the variable load rate of the unit.
It can be found that by changing the energy storage on the turbine side, the main steam temperature and pressure of the power plant can be quickly adjusted, thus improving the load change rate, that is, the regulation capability to AGC instruction. The main steam temperature and pressure of the turbine are ultimately affected by boiler side parameters, such as the coal feed rate, air supply rate, and feedwater flow rate (Stevanovic et al., 2018; Wang Y. et al., 2019; Yin et al., 2022). Therefore, this paper considers the construction of multi-stage sub-models to describe the AGC regulation capability. In the first sub-model, historical sequences of parameters such as coal feed rate, air supply rate, and feedwater flow rate are taken as inputs of an LSTM model; the main steam temperature and main steam pressure are taken as output parameters to be predicted. In the second sub-model, the prediction of the main steam temperature and main steam pressure are taken as inputs of another LSTM model, and the final power load change, that is, the actual power generation, is taken as output. Based on the constructed model, the particle swarm optimization (PSO) algorithm is proposed to optimize parameters of coal feed rate, air supply rate, and feedwater flow rate, to improve the AGC regulation capacity.
The rest of this paper is organized as follows. Section 2 details the fundamental modeling theories. The AGC regulation capacity model and optimization methods are presented in Section 3. Section 4 gives an application to a 300 MW thermal power plant, and Section 5 provides the conclusions.
2 Modeling theories
2.1 mRMR feature selection
The max-relevance and min-redundancy (mRMR) is a filtering feature selection algorithm, in which the evaluation function considers both the correlation between features and categories and the correlation between features. As a result, the filtered variables can retain the maximum number of relevant features while ensuring the minimum number (R et al., 2016; Ding and Peng, 2003). The algorithm uses mutual information to measure the correlation between variables, which can be expressed as follows:
where
Given a subset of candidate features, the measures for maximum correlation between features and categories and minimum redundancy between features are calculated as follows:
where
Considering the relevance and redundancy of the selected feature subset, the evaluation function of the mRMR feature selection is obtained by combining Eqs. 2, 3, which is given as follows:
The above equation can be solved by gradually increasing a single variable. Assuming that the set
2.2 LSTM neural network
Long short-term memory neural network is one variant of a Recurrent Neural Network (RNN). An LSTM neural network has a temporal recurrent neural network structure designed to solve the problems of gradient disappearance and gradient explosion RNN when processing long sequence data (Hochreiter and Schmidhuber, 1997). A typical LSTM model mainly consists of one input layer, one output layer, and several hidden layers. The implicit layer has three types of gate structures with a memory unit, which is responsible for storing state information and passing it forward. The three types of gates are the forgetting gate, the input gate, and the output gate (Sahin and Kozat, 2019; Yu et al., 2019; Yuan et al., 2019). The structure of the LSTM neural network is shown in Figure 1.
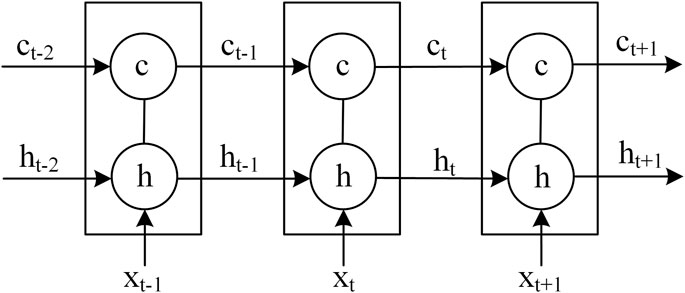
FIGURE 1. LSTM neural network structure diagram.
It is shown in Figure 1 that each LSTM has a cell, which can be regarded as the memory unit of the LSTM. At the time
LSTM can get and modify the information in each memory unit through the input gate
where
LSTM layer can calculate unit status updates at this time value
The cell state has two flow directions. One direction is to pass the LSTM layer at the next moment in the feedback structure as a long-term information feature; the other is to combine with the
3 AGC regulation capacity model and optimization
3.1 Model structure
The structure of the AGC regulation capability model is shown in Figure 2. The whole model contains multi sub-models, one of which is the prediction model of boiler performance, and the other is the prediction model of the actual generation power of the generator. In the first sub-model, historical sequences of coal feed rate, air supply rate, feedwater flow rate, main steam pressure, and main steam temperature are taken as the model input; the main steam pressure and main steam temperature value at the next sampling period are taken as the model output, to characterize the response of the boiler to the AGC instruction from the power grid. In the second sub-model, the main steam temperature and pressure predicted by the first sub-model are taken as the input, and the actual generating power is taken as the output.
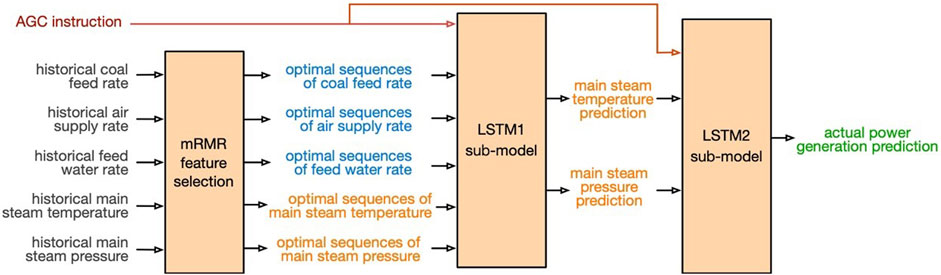
FIGURE 2. AGC regulation capability prediction model.
When the AGC instruction is given, the main steam pressure and main steam temperature response process are related to their historical values; therefore, historical values of the coal feed rate, air supply rate, and feedwater flow rate are utilized as the input of the first sub-model. The prediction process is shown in Eq. 8.
where
Definitely, the parameters of
The actual power generation of a thermal power plant is closely related to the main steam pressure and main steam temperature according to the operation mechanism of the steam turbine. Therefore, the actual power generation can be obtained based on the prediction of the main steam pressure and main steam temperature. That is, the AGC instruction value, the main steam pressure, and the main steam temperature are used as input variables of the LSTM network in the second sub-model to predict the final actual power generation. The prediction process is shown in Eq. 9.
where
3.2 AGC regulation capability optimization
According to the AGC regulation mechanism, the boiler and turbine will be tuned through the coordinated control system when the thermal power plant receives the AGC instruction. The final response of the plant is determined by the operating parameters of the coal feed rate, air supply rate, and feedwater flow rate. Therefore, these parameters can be optimized to maximize the regulation capability for a given AGC instruction.
According to the management rules of grid-connected operation of power plants, the regulation capability index is calculated by the
To illustrate the calculation of
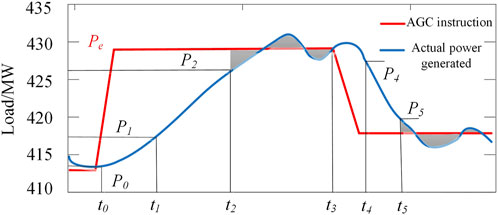
FIGURE 3. AGC regulation process of a thermal power plant.
The regulation rate refers that the output crosses the response dead zone to enter the regulation dead zone. In Figure 3, the regulation rate can be calculated in
The regulation accuracy refers to the integration of the absolute value of the difference between the actual output and the set point command over a while (the result is shown in the shaded part in Figure 3), and then it is divided the integrated value by the integration time, which is the regulation accuracy for that period. The calculation is given as follows:
where
According to the “two rules”, the regulation capability index is calculated by the
where,
where
The task of regulation capability improvement is to maximize the index of
In addition, according to the secure operation of thermal power plants, the following constraints are considered. For a given 300 MW thermal power plant, the upper and lower operation limits of the main steam pressure are set to 22.7 MPa and 17.2 MPa, respectively; the upper and lower limits of the main steam temperature are set to 569°C and 559°C, respectively. The fluctuation limit of the main steam pressure per second is less than 0.5 MPa. The upper limit of the unit load is 300 MW while the lower limit is 128 MW. Then we can obtain the following optimization problem:
The particle swarm optimization (PSO) algorithm is utilized here to obtain the optimal operating variables. These variables are regarded as particles in multi-dimensional search space, and the moving speed and direction of the particles are updated by iterating to obtain the optimal solution (Zhang et al., 2015; Liu et al., 2020). The variable to be optimized is denoted as
where
For the
where
With Eq. 17 as the fitness function, the speed and position of the particles are updated according to Eqs 19, 20. The best solution
3.3 Model implementation procedure
The implementation process of the AGC regulation modeling and optimization is shown in Figure 4, and the specific steps are given as follows:
(1) Collect historical operating data of the power plant in several periods of the AGC regulation process, including the parameters of coal feed rate, air supply rate, feedwater flow rate, the main steam pressure, and main steam temperature.
(2) Calculate mutual information between input and output variables, and select the optimal historical sequences of coal feed rate, air supply rate and feedwater flow rate as the inputs of the first sub-model.
(3) Construct the first sub-model with the extracted parameters in (2) as the inputs, to predict the main steam pressure and main steam temperature at the next time stamp by using the LSTM network.
(4) Construct the second sub-model, with the outputs of the first sub-model in (3) as the inputs, to predict the actual power generation at the next time stamp by using LSTM network.
(5) Given a new AGC instruction, optimize the values of coal feed rate, air supply rate, and feedwater flow rate by minimizing the difference between the actual power generation and AGC instruction.
(6) Obtain the optimal coal feed rate, air supply rate, feedwater flow rate and go to (5) to get a new AGC instruction.
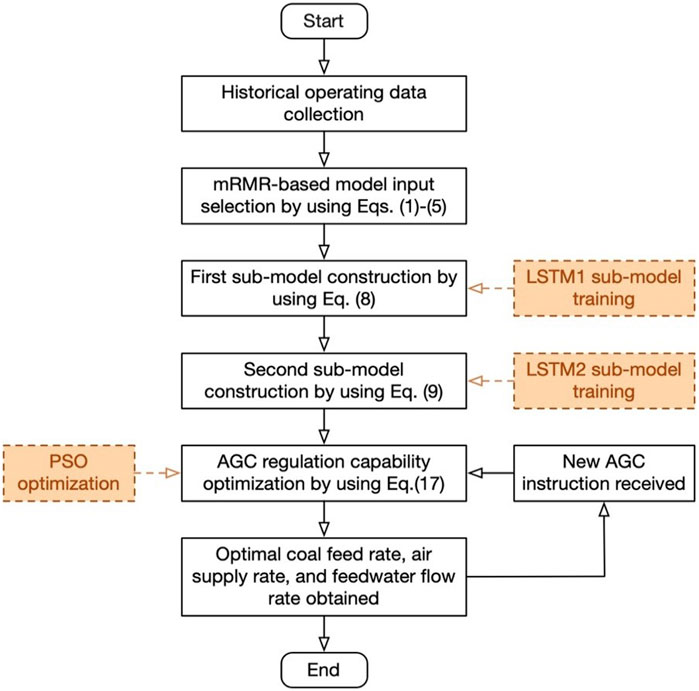
FIGURE 4. Flowchart of the AGC regulation modeling and optimization.
4 Application analysis
4.1 Data acquisition
In this paper, we obtain a high-resolution operation data set from the DCS system of a 300 MW coal-fired subcritical unit in North China. The unit is equipped with a subcritical parameter natural circulation steam package boiler with a maximum continuous output of 1,016 t/h. AGC regulation experiments were conducted to collect operation data containing the parameters shown in Table 1. The data samples were acquired with an interval of one second, with a total of 3,600 samples obtained. The AGC regulation curve is shown in Figure 5, including load-raising or decreasing processes.
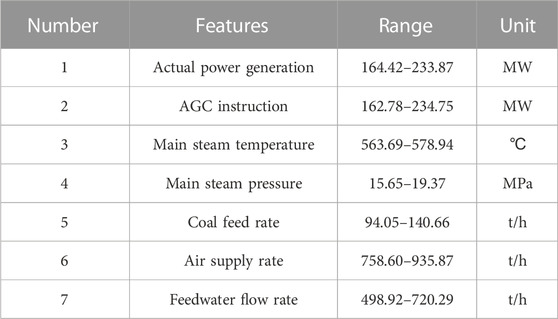
TABLE 1. Range of parameters.
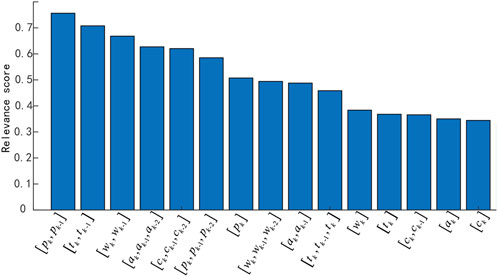
FIGURE 5. Ranking of variable relevance scores.
The data samples were preprocessed by using the z-score normalization to make them conform to a standard normal distribution, that is, with a mean of 0 and a standard deviation of 1. We use the above data to construct a LSTM model to achieve the prediction of unit power generation and the validation of unit AGC capability optimization strategy. The first 3,000 sets of collected data are used as the training set, and the last 600 sets of data are used as the test set to verify the training and optimization results of the model. Because the input data of the LSTM model is sequence data, the training set and test set data were divided into 43 and 10 sequence data based on AGC instructions’ changing.
4.2 Model accuracy analysis
The mRMR was used to extract the feature variables, and the correlation score of each variable was calculated comprehensively, as shown in Figure 5. The characteristic variables with correlation scores greater than 0.5 were selected as input variables. Therefore, the maximum historical time
The first sub-model of the LSTM network is set up to predict the main steam pressure and the main steam flow, respectively. The second sub-model of the LSTM network was used to predict the final actual power generation. Taking one sequence data containing 100 samples in the test set data as an example, the prediction results are shown in Figure 6, where the predicted and actual curves of the model nearly coincide. Figure 7 shows the model prediction error between the actual power generation and the model prediction is within 1.81 MW, which validates the accuracy of the proposed model.
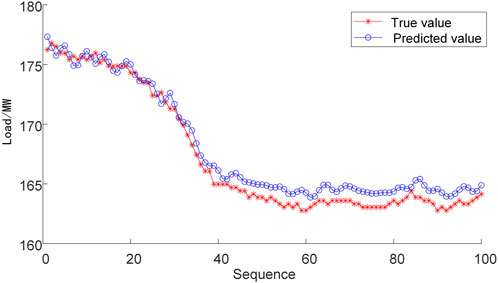
FIGURE 6. The mRMR-mLSTM model prediction.
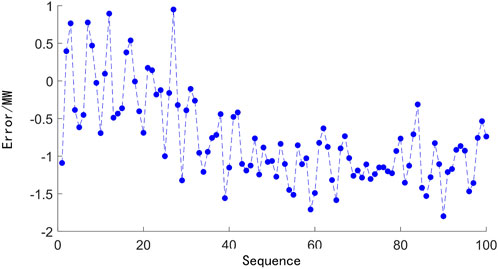
FIGURE 7. The mRMR-mLSTM model prediction error.
The average relative error (ARE), root mean square error (RMSE), and normalized root mean square error (NRMSE) were used as indexes to qualitatively evaluate the accuracy of the model, and each index was defined as follows:
where
To further verify the prediction performance of the proposed model with multi sub-LSTMs and mRMR-based feature selection (denoted as mRMR-mLSTM model), the model was compared with a single LSTM neural network model (denoted as LSTM model), and a model with multi sub-LSTMs and no mRMR-based feature selection (denoted as mLSTM model). The comparison of model prediction results and errors is shown in Figures 8–11. It can be seen that the predicted power generation of the single LSTM neural network model differs significantly from the actual power generation with a given AGC instruction, and the peak value of the model prediction errors reaches 3.94 MW. The mLSTM model has improved the accuracy compared with the single LSTM network, but the error is still larger than that of the mRMR-mLSTM model.
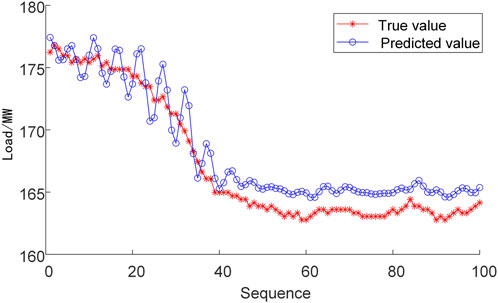
FIGURE 8. The mLSTM model prediction result.
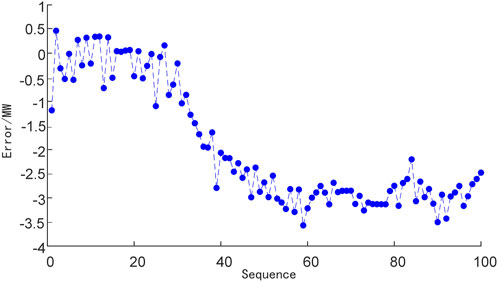
FIGURE 9. The mLSTM model prediction error.
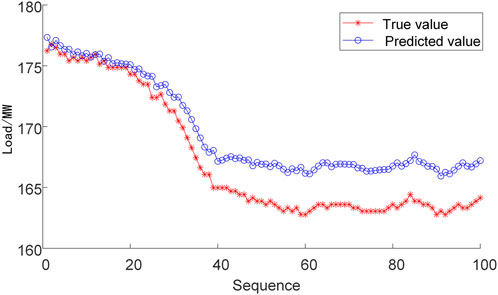
FIGURE 10. The LSTM model prediction result.
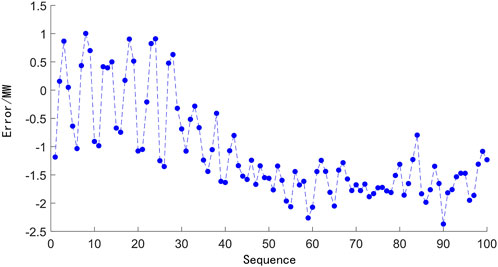
FIGURE 11. The LSTM model prediction error.
The comparison results of the single LSTM model, the mLSTM model, and the mRMR-mLSTM model are given in Table 2. The results showed that the error of the mRMR-mLSTM model was significantly lower than that of the LSTM model and the mLSTM model. Specifically, compared with the single LSTM model, the prediction RMSE error of the mLSTM model is reduced by 1.15 MW, with a 35.1% decrease, and the results show that it conforms to the real responding characteristics better by dividing the AGC process into multi-stages, which are described by different sub-models. In addition, the prediction RMSE error of the proposed mRMR-mLSTM model is less than 1.74 MW and reduced by 53.2% compared with the single LSTM model, which means the feature selection based on mRMR is beneficial to filter the relevant variables related to the AGC response. In general, the proposed mRMR-mLSTM model can be adequate to give an accurate prediction of actual power generation with a given AGC instruction.
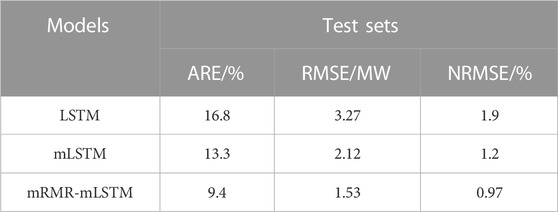
TABLE 2. Prediction accuracy comparison of different models.
4.3 AGC capability optimization results
Figure 12 shows the variation trend of the actual power generation of the thermal power plant in response to the AGC instruction. It can be seen that when the power plant receives the AGC instruction from the power grid, the values of the coal feed rate, air supply rate, and feedwater flow rate start to vary, and then the main steam pressure and main steam temperature also change at the same time, which results to the change of the actual power generation. Finally, the actual power generation reaches around the AGC command value. In addition, we can use Eqs 10–16 to calculate the
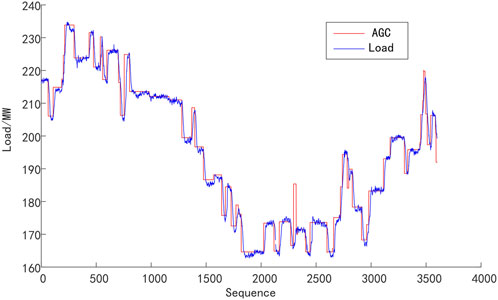
FIGURE 12. AGC instruction data.
With the error between the actual power generation and AGC instruction as the objective function, PSO is used to obtain the optimal values of the coal feed rate, air supply rate, and feedwater flow rate. Taking the optimization of the first time stamp as an example, the iterative process of PSO is shown in Figure 13. It can be seen that after 19 iterations, the objective function achieves the optimal value, and the deviation reaches 0.18 MW. Similarly, the optimization can be conducted online and we can get the optimal coal feed rate, air supply rate, and feedwater flow rate at each moment during the AGC regulation process. Correspondingly, the actual power generation can be obtained by using Eq. 9, which is shown in Figure 14.
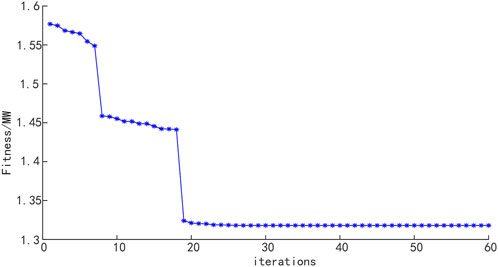
FIGURE 13. Particle fitness value iteration.
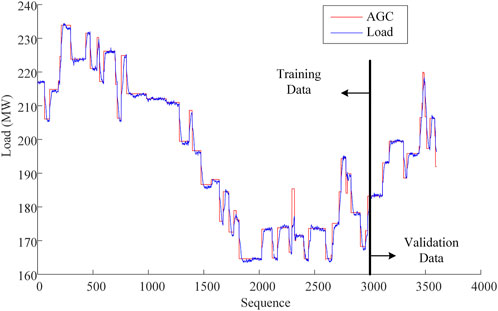
FIGURE 14. Actual power generation after optimization and AGC instruction.
As illustrated in Section 4.2, the LSTM model can give accurate predictions, which means the model is adequate to represent the actual operating characteristics of coal-fired unit. Thus, we consider it may be reasonable to use the calculation results for the comparison. During the experiment, the investigated power plant receives 52 AGC instructions from the power grid, and most of instructions maintain for approximately 1–2 min. According to the AGC instruction and actual power generation, the
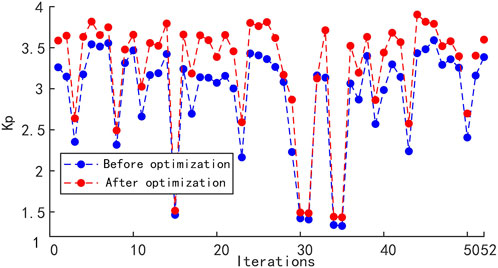
FIGURE 15. AGC regulation index comparison.
5 Conclusion
This paper proposes a prediction and optimization model for the AGC regulation capacity of thermal power units. Firstly, optimal historical sequences of the coal feed rate, air supply rate, feedwater flow rate, main steam temperature, and pressure are selected by using mRMR theory and are taken as the first sub-model of LSTM to predict the future values of main steam temperature and pressure, which are then considered as the inputs of the second LSTM sub-model to predict the power generation with a given AGC instruction. Then, based on the model, the PSO is applied to obtain optimal values of the coal feed rate, air supply rate, and feedwater flow rate by minimizing the difference between the actual power generation and AGC instruction. Finally, an application to a 300 MW power plant AGC regulation process is conducted. Comparisons results of different modeling methods show that the proposed mRMR-mLSTM model is adequate to predict the AGC regulation capability after introducing the mRMR feature selection and multi-stage process modeling, and the prediction RMSE error is 1.53 MW, which is reduced by 53.2% compared with the single LSTM model. In addition, after optimization by PSO, the AGC regulation index Kp reaches 3.448, which is improved by 15.7%. Thus, the proposed method can effectively predict and improve the adjustment capability of grid AGC recommendation.
Data availability statement
The data analyzed in this study is subject to the following licenses/restrictions: The dataset of this article was collected from a 300 MW coal-fired unit. Requests to access these datasets should be directed to MTkwNzIzMTg1NTlAMTYzLmNvbQ==.
Author contributions
FJ: Writing–original draft. XH: Writing–original draft. WZ: Writing–original draft. MW: Writing–original draft. BW: Writing–original draft.
Funding
The author(s) declare financial support was received for the research, authorship, and/or publication of this article. This work is supported by the Technology Project of State Grid Hebei Electric Power Co. Ltd. (TSS 2021-04). The funder was not involved in the study design, collection, analysis, interpretation of data, the writing of this article, or the decision to submit it for publication.
Conflict of interest
Authors FJ, XH, WZ, MW, and BW were employed by State Grid Hebei Energy Technology Service Co Ltd.
Publisher’s note
All claims expressed in this article are solely those of the authors and do not necessarily represent those of their affiliated organizations, or those of the publisher, the editors and the reviewers. Any product that may be evaluated in this article, or claim that may be made by its manufacturer, is not guaranteed or endorsed by the publisher.
References
Chen, D., and Wang, L. (2016). “Neural network based predictive automatic generation control,” in Proceedings of the IEEE Power and Energy Society General Meeting, IEEE Computer Society, Boston, MA, United states, July, 2016. doi:10.1109/PESGM.2016.7741573
Ding, C., and Peng, H. (2003). “Minimum redundancy feature selection from microarray gene expression data,” in Proceedings of the 2003 IEEE Bioinformatics Conference, Institute of Electrical and Electronics Engineers Inc., Stanford, CA, United states, August, 2003, 523–528. doi:10.1109/CSB.2003.1227396
Egido, I., Fernández-Bernal, F., and Rouco, L. (2007). Evaluation of Automatic Generation Control (AGC) regulators by performance indices using data from real operation. Transm. & 1 (2), 294–302. doi:10.1049/iet-gtd:20060173
Eslick, J. C., Zamarripa, , Miguel, A., Ma, J., Bhattacharya, I., Rychener, B., et al. (2022). Predictive modeling of a subcritical pulverized-coal power plant for optimization: parameter estimation, validation, and application. Appl. Energy 319, 119226. doi:10.1016/j.apenergy.2022.119226
Hegazy, A., Rothan, Y., and Engeda, A. (2016). Feasibility of using vapor compression refrigeration system for cooling steam plant condenser. Appl. Therm. Eng. 106 (5), 570–578. doi:10.1016/j.applthermaleng.2016.06.005
Hochreiter, S., and Schmidhuber, J. (1997). Long short-term memory. Neural Comput. 9 (8), 1735–1780. doi:10.1162/neco.1997.9.8.1735
Kennedy, J., and Eberhart, R. (1995). “Particle swarm optimization,” in Proceedings of the IEEE International Conference on Neural Networks, Piscataway, NJ, USA, November, 1995, 1942–1948. doi:10.1109/ICNN.1995.488968
Li, B., Wang, S., Li, B. T., Li, H. B., and Wu, J. Z. (2023). Optimal performance evaluation of thermal AGC units based on multi-dimensional feature analysis. Appl. Energy 339, 120994. doi:10.1016/j.apenergy.2023.120994
Liang, Y., Niu, D., and Hong, W. (2019). Short term load forecasting based on feature extraction and improved general regression neural network model. Energy 166 (1), 653–663. doi:10.1016/j.energy.2018.10.119
Liu, M., Liu, M., Chen, W., and Yan, J. (2023). Operational flexibility and operation optimization of CHP units supplying electricity and two-pressure steam. Energy 263, 125988. doi:10.1016/j.energy.2022.125988
Liu, X., Qi, H., Ren, M., and Cheng, L. (2020). “A prediction method of NOx in thermal power plants using GC-LSTM neural network,” in Proceedings of the 2020 Chinese Automation Congress, CAC 2020, Institute of Electrical and Electronics Engineers Inc., Shanghai, China, November, 2020, 3508–3512. doi:10.1109/CAC51589.2020.9327374
Liu, Z., Li, J., Zhang, P., Ding, Z., and Zhao, Y. (2022). An AGC dynamic optimization method based on proximal policy optimization. Front. Energy Res 10, 947532. doi:10.3389/fenrg.2022.947532
Peng, B., Ma, X., Ma, X., Tian, C., and Sun, Y. (2023). Coordinated AGC control strategy for an interconnected multi-source power system based on distributed model predictive control algorithm. Front. Energy Res 10, 1019464. doi:10.3389/fenrg.2022.1019464
Peng, D., Xu, Y., and Zhao, H. (2019). Research on intelligent predictive AGC of a thermal power unit based on control performance standards. Energies 12 (21), 4073. doi:10.3390/en12214073
Ramírez-Gallego, S., Lastra, I., Martínez-Rego, D., Bolón-Canedo, V., Benítez, J. M., Herrera, F., et al. (2016). Fast-mRMR: fast minimum redundancy maximum relevance algorithm for high-dimensional big data. Int. J. Intelligent Syst. Cell. 32 (2), 134–152. doi:10.1002/int.21833
Sahin, S. O., and Kozat, S. S. (2019). Nonuniformly sampled data processing using LSTM networks. IEEE Trans. Neural Netw. Learn. Syst. 30 (5), 1452–1461. doi:10.1109/TNNLS.2018.2869822
Stevanovic, V. D., Ilic, M., Djurovic, Z., Wala, T., Muszynski, S., and Gajic, I. (2018). Primary control reserve of electric power by feedwater flow rate change through an additional economizer – a case study of the thermal power plant “Nikola Tesla B”. Energy 147, 782–798. doi:10.1016/j.energy.2018.01.102
Wang, D., Han, X., Li, H., and Li, X. (2023b). Modeling and control method of combined heat and power plant with integrated hot water storage tank. Appl. Therm. Eng. 226, 120314. doi:10.1016/j.applthermaleng.2023.120314
Wang, D., Xie, X., Zhou, Y., Han, X., and Si, L. (2023a). Improved coordinated control strategy of coal-fired power units with coupled heat storage based on supercritical carbon dioxide cycle. Appl. Therm. Eng. 230, 120850. doi:10.1016/j.applthermaleng.2023.120850
Wang, J., Pang, X., Gao, S., Zhao, Y., and Cui, S. (2019a). Assessment of automatic generation control performance of power generation units based on amplitude changes. Int. J. Electr. Power & Energy Syst. 108, 19–30. doi:10.1016/j.ijepes.2018.12.046
Wang, R., Liu, H., Niu, Y., and Gu, Z. (2017). Study on PID parameters optimization based on performance indexes of AGC. J. Eng. Therm. Energy Power 32 (7), 58–63. doi:10.16146/j.cnki.rndlgc.2017.07.009
Wang, X., Tao, Y., and Zheng, K. (2018). “Feature selection methods in the framework of mRMR,” in Proceedings of the 8th International Conference on Instrumentation and Measurement, Computer, Communication and Control (IMCCC), Institute of Electrical and Electronics Engineers Inc., Harbin, Heilongjiang, China, July, 2018, 1490–1495. doi:10.1109/IMCCC.2018.00307
Wang, Y., Cao, L., Hu, P., Li, B., and Li, Y. (2019b), Model establishment and performance evaluation of a modified regenerative system for a 660 MW supercritical unit running at the IPT-setting mode, Energy, 179,890–915. doi:10.1016/j.energy.2019.05.026
Wang, Z., Jia, L., and Ren, C. (2021). “Attention-bidirectional LSTM based short term power load forecasting,” in Proceedings of the Institute of Electrical and Electronics Engineers Inc., Virtual, Online, China, August, 2021, 171–175. doi:10.1109/PSGEC51302.2021.9541781
Xi, L., Zhou, L., Lang, L., Duan, D., Xu, Y., Yang, L., et al. (2020). A deep reinforcement learning algorithm for the power order optimization allocation of AGC in interconnected power grids. CSEE J. Power Energy Syst. (JPES) 6 (3), 712–723. doi:10.17775/CSEEJPES.2019.01840
Yang, C., Sun, W., Han, D., and Yin, X. (2022). Research on power system flexibility considering uncertainties. Front. Energy Res. 10, 967220. doi:10.3389/fenrg.2022.967220
Yin, J., Liu, M., and Yan, J. (2022). Effect of fuel side deviations on the load-cycling performance of thermal power plants: a dynamic simulation. Appl. Therm. Eng. 206, 118041. doi:10.1016/j.applthermaleng.2022.118041
Yu, Y., Si, X., Hu, C., and Zhang, J. (2019). A review of recurrent neural networks: LSTM cells and network architectures. Neural Comput. 31 (7), 1235–1270. doi:10.1162/neco_a_01199
Yuan, X., Chen, C., Jiang, M., and Yuan, Y. (2019). Prediction interval of wind power using parameter optimized Beta distribution based LSTM model. Appl. Soft Comput. J. 82, 105550. doi:10.1016/j.asoc.2019.105550
Zhang, K., Zhao, Y., Liu, M., Gao, L., Fu, Y., and Yan, J. (2021). Flexibility enhancement versus thermal efficiency of coal-fired power units during the condensate throttling processes. Energy 218 (1), 119534. doi:10.1016/j.energy.2020.119534
Zhang, Y., Wang, S., and Ji, G. (2015). A comprehensive survey on particle swarm optimization algorithm and its applications. Math. Problems Eng. 2015, 1–38. doi:10.1155/2015/931256
Keywords: automatic generation control (AGC) regulation, thermal power plant, max-relevance and min-redundancy, long short-term neural networks, automatic generation control (AGC) optimization
Citation: Jin F, Hao X, Zhang W, Weng M and Wu B (2023) AGC regulation capability prediction and optimization of coal-fired thermal power plants. Front. Energy Res. 11:1275243. doi: 10.3389/fenrg.2023.1275243
Received: 09 August 2023; Accepted: 09 October 2023;
Published: 03 November 2023.
Edited by:
George Tsekouras, University of West Attica, GreeceReviewed by:
Yorgos Tsourakis, National Technical University of Athens, GreeceSanjay Sinha, Amity University, India
Copyright © 2023 Jin, Hao, Zhang, Weng and Wu. This is an open-access article distributed under the terms of the Creative Commons Attribution License (CC BY). The use, distribution or reproduction in other forums is permitted, provided the original author(s) and the copyright owner(s) are credited and that the original publication in this journal is cited, in accordance with accepted academic practice. No use, distribution or reproduction is permitted which does not comply with these terms.
*Correspondence: Bin Wu, YmluX3d1MDMxOEAxNjMuY29t