 Tingting Hou1
 Bibin Huang
- 1Economics and Technology Research Institute, State Grid Hubei Electric Power Company, Wuhan, Hubei, China
- 2State Grid Energy Research Institute Co., Ltd., Beijing, China
- 3School of Automation, Wuhan University of Technology, Wuhan, Hubei, China
To enhance the market participation initiatives from the power source and load sides, we propose a novel power system optimal scheduling and cost compensation mechanism for China’s peak regulation ancillary service market. Owing to China’s energy structure, thermal power accounts for nearly half of the country’s installed power generation capacity. Although the willingness of thermal power units to participate in peak regulation auxiliary services is low, we propose a peak regulation cost compensation and capacity-proportional allocation mechanism. This mechanism comprehensively considers the source-load initiative. From the source side, it encourages entities to participate in peak regulation, and the restriction of the peak regulation initiative is set to ensure that each entity benefits from the peak regulation transaction. From the load side, it takes the shiftable and sheddable load as the hybrid demand response and uses the price information to influence the power consumption behavior of the user side. Subsequently, a peak regulation scheduling model was constructed with the multi-objective minimum thermal power output fluctuation of the lowest system operating cost and minimum renewable energy abandonment. This was solved using a mixed-integer linear programming model and CPLEX. Finally, a power system consisting of wind-solar-hydro-thermal-storage and hybrid demand response with a modified IEEE 30-bus system was tested to verify the effectiveness. It was proven that the proposed method improves the utilization rate of renewable energy and optimizes the scheduling of the economic benefit system of each power generation entity.
1 Introduction
On 31 July 2023, a third-quarter regular press conference was held by the Chinese National Energy Administration to meet the needs of the new energy power system construction. The large-scale development of new energy is the basic path for low-carbon transformation, and the transformation and development of coal-fired power is important for integrating new energy into the power system. Among these, the auxiliary power service market mechanism plays a crucial role (National Energy Administration, 2023).
With the development of the Chinese power auxiliary service market, source-load cooperative multimodal peak regulation strategies have become a research hotspot. As thermal power accounts for nearly half of the country’s installed power generation capacity in China, its willingness to peak regulation is low, and it needs to invest a considerable amount in fuel costs, resulting in a decline in its economic benefits. To promote the transformation and development of coal-fired power-generation enterprises, the state has issued policy documents, such as Opinions on Improving the System, Mechanism, and Policy Measures for Green and Low-carbon Energy Transformation (National Development and Reform Commission and National Energy Administration, 2022). This policy requires the acceleration of the deep peaking transformation of thermal power generators and mandates the improvement of peak regulation cost compensation. Therefore, deep peak regulation (DPR) of thermal power plants remains one of the main peak regulation methods for the source side in China. The lower reserve capacity of thermal power plants is used to provide peak regulation power generation rights for renewable energy sources such as wind and solar energy. The load side adopts demand response (DR) to optimize the load curve.
Researchers have conducted relevant studies to accelerate the absorption of renewable energy using thermal power DPR. Yin and Duan (2022) proposed a pricing mechanism for DPR services. Shi et al. (2021) considered the short-term start-stop peak regulation of thermal power units. Tian et al. (2019), Peng et al. (2020), Yang et al. (2021), Yang et al. (2022) modeled a peak regulation ancillary service market. Although the above studies provide effective strategies for improving the economy of peak system regulations, they do not completely consider peak regulation cost compensation. In fact, the cost of the thermal power DPR is high. If not properly compensated, it may lead to economic pressure on thermal power unit operators and affect the stability of their production and operation.
This has led to in-depth research on peak regulation cost compensation and allocation mechanisms. Ye et al. (2022), Wu et al. (2023) used Shapley values to calculate peak regulation costs for different entities. Wu et al. (2019), Jiang et al. (2022) calculated the allocation of peak regulation electricity for wind farms based on the “equal power quantity-following the load” method. Jian et al. (2018) proposed a DPR model based on an improved cardinality method. Most of the above studies aimed at the global optimization of the system; however, there is a lack of consideration of the economic benefits of thermal power units. Therefore, some studies have attempted to introduce peak regulatory initiatives. The goal is to meet the system demand and ensure fairness and enthusiasm in the unit peak regulation. Li et al. (2020), Zhao et al. (2022) proposed an optimal scheduling strategy for a wind-solar-hydro-thermal-storage combined system optimization and scheduling strategy considering the active constraint of peak regulation. However, these methods typically adopt hierarchical scheduling or multiple iterations. This increases the complexity of the model and the solution time and may even lead to loss of feasible solutions.
On the load side, the DR, as a flexible resource in power systems, plays an increasingly important role in peak regulation strategies. Most existing studies focus on a single type of DR, such as an incentive-based demand response (IDR) or price-based demand response (PDR). Ju et al. (2022), Li et al. (2023) guided users to actively optimize the load curve through IDR on the demand side. Cui et al. (2021a), Song et al. (2022) compensated and allocated DPR costs based on an improved analytic hierarchy process when the PDR was included. However, these studies have often overlooked cases in which multiple types of DR may exist simultaneously in a single system. The development of a coordinated, unified, and effective DR strategy based on the diversity and complexity of various types of DR is an urgent problem. This is a crucial challenge in the current research on power system peak regulation.
The aim of this research is to address the problems of insufficient initiative of thermal power unit peak regulation, a single DR type, and complex solutions of nonconvex functions. We propose an active peak regulation optimal scheduling and compensation cost allocation mechanism for wind, solar, hydro, and thermal storage and a hybrid demand response. The goal is to ensure the overall optimization of the system and consider the economic benefits of the individual generators. We linearized the nonlinear functions in the constraint conditions and objective functions using a mixed-integer linear programming (MILP) model. The peak regulation model was constructed with the aim of minimizing fluctuations in the thermal power output, lowering the operating cost of the system, and minimizing the abandonment of renewable energy. Finally, CPLEX was used to solve the modified IEEE 30-bus system. This proves that the proposed method has advantages in improving the consumption level of renewable energy and promoting the peak regulation enthusiasm of each peak regulation subject.
2 Cost compensation mechanism structure
A structural diagram of the power-peaking system is shown in Figure 1. It consists of two parts: the power system peak regulation model and peak regulation scheduling model. Wind farms, photovoltaic power plants, and hydropower units on the source-side provide green and environmentally friendly power resources. The thermal power unit DPR absorbs more renewable energy; accepts the peak regulation compensation of wind power, photovoltaic power, and other thermal power units; and shares the compensation cost according to the proportion of the capacity. In this process, special attention is paid to the entities’ willingness for peak regulation, and the initiative constraint is set to ensure that each entity can benefit from peak regulation. HDR considers shiftable and sheddable loads and uses price information to influence the power consumption behavior of users. Energy storage (ES) systems utilize batteries. The grid structure is a modified IEEE 30-bus system, which allows the system to limit the transmission and distribution of electricity. Three main optimization objectives are set: minimum fluctuation of the thermal power output, lowest operating cost of the system, and minimum abandonment of renewable energy. During the operation of the entire system, the power outputs of the entities and electricity prices for the load are used as input decision variables. An MILP model was constructed to solve the objective function and decision variable, and the nonlinear function was treated using square/piecewise function linearization.
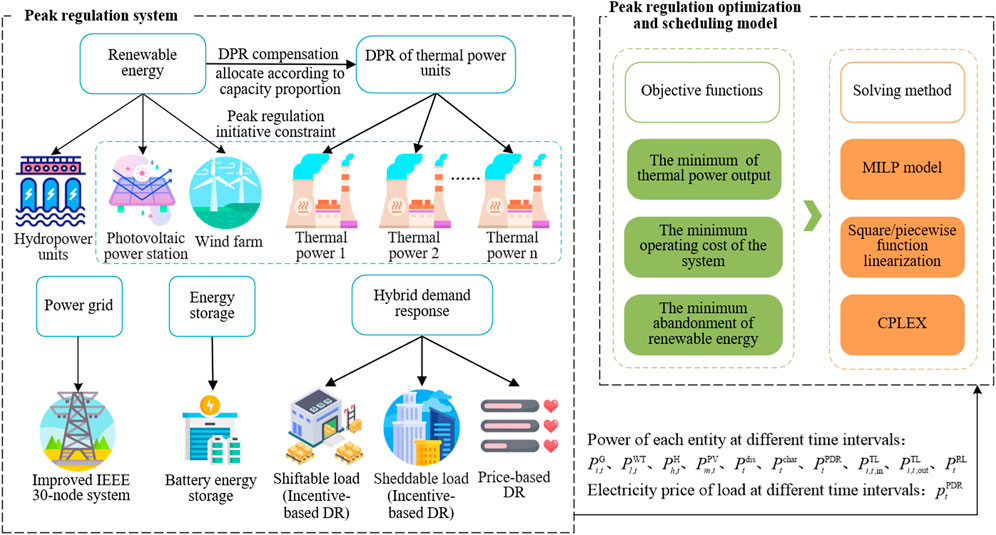
FIGURE 1. Power peaking system structure diagram.
3 Peak regulation cost compensation and capacity sharing mechanism
In research on the economic dispatch of power systems considering peak regulation initiatives, the issue of benefit allocation among various peak regulation entities is involved. Therefore, this section focuses on analyzing the compensation and capacity-proportional allocation mechanism for wind power, photovoltaics, and thermal power units participating in peak regulation.
3.1 Thermal power unit deep peak regulation compensation mechanism
The thermal power DPR compensation case is related to the output reduction behavior at dispatch time. Taking the compensated peaking service case in Hubei Province, China, as an example, the reference standard was set at 50% of the unit’s maximum output. Compensation is based on the generation of thermal power below the minimum technical output. The compensation case was divided into five levels, as listed in Table 1 (National Energy Administration and Central China Regulatory Bureau, 2022). where
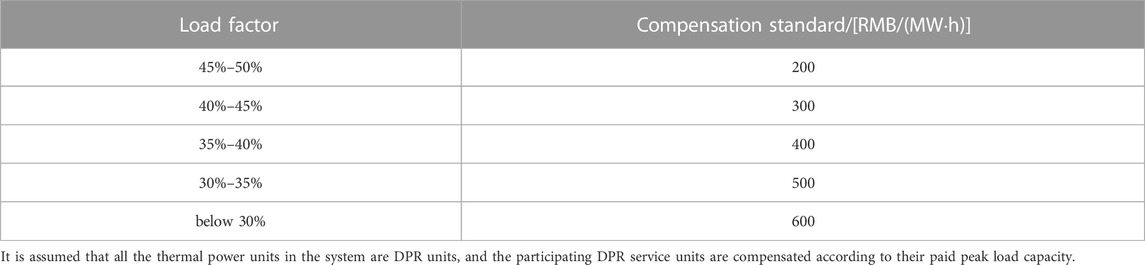
TABLE 1. Compensation case for DPR in Hubei Province, China.
Thus, the total peak regulation compensation expenditure at time t is
where
3.2 Peak regulation cost and capacity sharing mechanism
Wind, photovoltaic, and thermal power share DPR compensation costs. To further improve each entity’s enthusiasm for participating in peak regulations, a different approach was adopted for the capacity-sharing mechanism. Unlike the electricity allocation mechanism (Zhao et al., 2022), the capacity allocation mechanism was determined based on the proportion of each unit’s maximum output, whereas the allocation of thermal power units was determined based on the proportion of their non-DPR capacity.
where
3.3 Peak regulation initiative model
The proposed peak regulation initiative was quantified by the extra profits obtained from each entity participating in the service. The wind power profit and photovoltaic peak regulation are composed of the profit from electricity sales, the allocation cost, and the penalty for abandoning wind and light. The thermal power peak regulation profit is composed of compensation, allocation, and DPR costs. These are shown in Eqs. 7–9. The thermal power unit DPR transfers peaking power generation rights to renewable energy. However, renewable energy compensates for thermal power units. When the profit is positive, each entity is willing to participate in the peak regulation auxiliary service to ensure fairness of the compensation and cost allocation mechanism.
(1) Wind power peak regulation profit:
where
(2) Photovoltaic peak regulation profits
where
(3) Thermal power peak regulation profits
where
4 Hybrid demand response model
There are two types of HDR: incentive demand response IDR and PDR (Hou et al., 2022a).
4.1 IDR model
The stimulated demand response (IDR) mainly includes two types: shiftable and sheddable loads.
(1) Shiftable Load
A shiftable load generally refers to a load, that is, not interrupted but can shift the entire electricity consumption period, such as in air conditioning and factories. The subsidizing shiftable load’s cost
where
(2) Sheddable load Sheddable load refers to loads such as lighting and computers that cannot be shifted but can be reduced or interrupted for electricity consumption. The load schedule after adopting the sheddable load control is
where
The system’s subsidy cost for sheddable load is represented as
where
4.2 PDR model
The PDR changes the way users use electricity by adjusting the price signal based on the principle of consumer psychology. The electricity price elastic matrix is used to model the PDR, as shown in Eqs. 16–18.
where
5 Peak regulation model for power system
The peak regulation scheduling model was constructed with the minimum fluctuation of the thermal power output, lowest operating cost of the system, and minimum abandonment of renewable energy.
5.1 Objective function
Thermal power units bear the residual net load deducting other peaking resources (Li et al., 2020). In order to reduce the peak regulation pressure of thermal power units and maximize the use of resources such as wind, solar, water storage and DR to participate in peak regulation auxiliary services, the minimum fluctuation of thermal power output is taken as the objective function, as shown in Eq. 19.
where
The comprehensive electricity cost of the system includes the comprehensive operating costs of the thermal power units, ES, and load, as shown in Eq. 22.
(1) Comprehensive operating cost of thermal power units
a) Fuel and start-stop unit cost
where
The method used in Li et al. (2022) can reduce the difficulty of solving and increase the rate, which linearizes the quadratic function of unit i’s coal consumption cost.
According to Eq. 25, the abscissa of the cost function represents the power output of the thermal power units and the ordinate represents the cost. Assuming that the abscissa is divided into m segments, with each segment having a length l, the expression is as follows:
where
b) Unit DPR loss cost
The additional unit losses caused by the unit DPR are approximately calculated with reference to the widely used Manson-Coffin formula (Lin and Tian, 2017), as shown in Eq. 31.
where
Linear fitting of the actual unit loss data was performed to obtain the linear formula of the unit loss under different outputs:
where
c) Unit DPR-assisted fuel combustion cost
where
Based on the different operating conditions of the thermal power units, the comprehensive operating cost is expressed as
where
(2) ES comprehensive operating costs
where
a) ES operating cost model
The ES operating cost model considers charging and discharging.
where
b) ES operating profit model
The ES operating profit depends mainly on its electricity sales and environmental profits, as shown in Eq. 37.
where
(3) Comprehensive load electricity cost
where
The profit from electricity sales to internal users can be expressed as follows
where
The minimum total abandoned consumption of wind power, photovoltaic power, and hydropower in T periods is taken as the objective function, as shown in Eq. 40:
where
5.2 Constraints
(1) Power balance constraints
where
(2) Thermal power unit power-output constraint
where
(3) Thermal power unit ramping constraint:
where
(4) ES constraints
where
(5) Power grid transmission capacity constraint
where
(6) IDR constraint
where
(7) PDR constraint
where
6 Case study
The validity of the proposed model was verified by analyzing the results of the previous 96 periods (15 min/period) (Huang et al., 2023). The MILP model was solved using the MATLAB 2022A platform and calling CPLEX 12.9 through YALMIP. The simulation was performed on an AMD Ryzen Threadripper 3970X processor with 64 GB RAM. The maximum runtime was 100.3 s.
6.1 Case study parameters
The modified IEEE 30-bus system was used for the simulation analysis to verify the effectiveness and applicability of the proposed method, as shown in Figure 2 (Cao et al., 2023). The case study included one wind farm, one photovoltaic power station, one hydroelectric power station, five thermal power units, and one energy-storage system. The parameters of each unit are listed in Table 2 and Table 3 (Li et al., 2019).
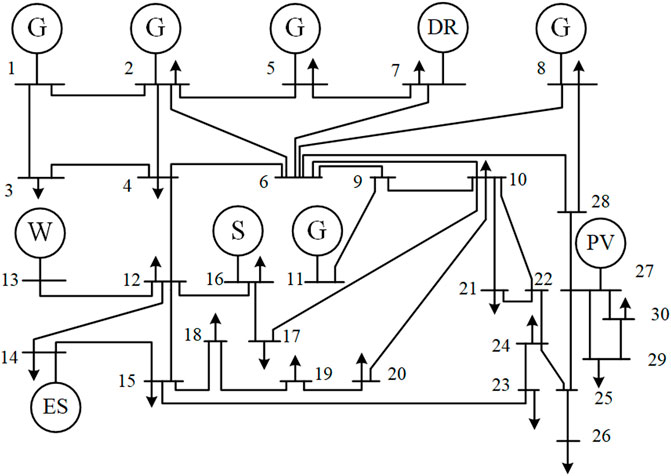
FIGURE 2. Modified IEEE 30-bus system.
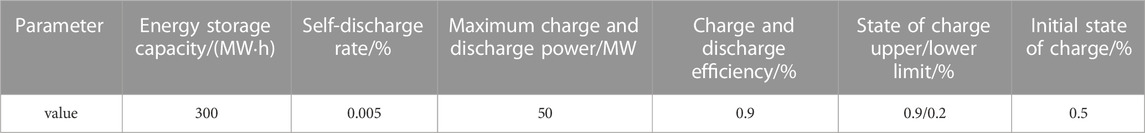
TABLE 2. Parameters of the energy storage system.
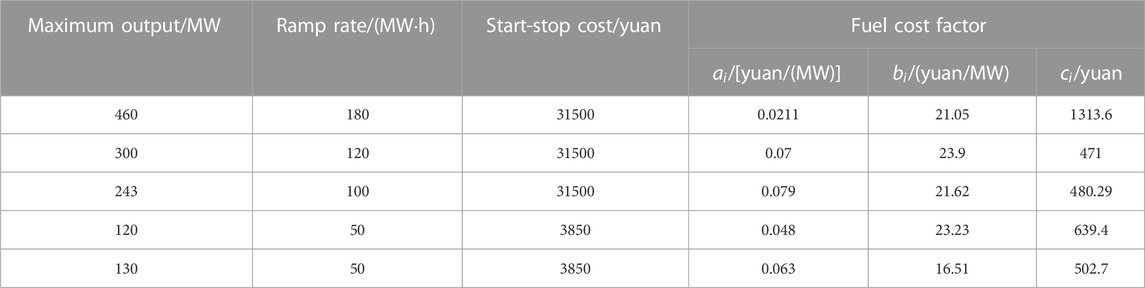
TABLE 3. Parameters of thermal power units.
The on-grid electricity price for wind power is 570 yuan/(MWh), and that for photovoltaic power is 921 yuan/(MWh). The penalty coefficient for wind and photovoltaic abandonment was 536 yuan/(MWh). The wind power, photovoltaic power, and load curves are shown in Figure 3 (Li et al., 2023). The on-grid electricity price of the thermal power was 375 yuan/(MWh), and the thermal power unit purchase cost was 4,394 yuan/kW. The fuel consumption during the DPR stage of the unit was 4.8 t/h, and the fuel price was 6,130 yuan/t. The profits from electricity purchases and ES sales are based on the peak and grid valley electricity prices, as shown in Figure 4. The charge and discharge cost was 50 yuan/(MWh), and the ES environmental benefit was converted to 314 yuan/(MWh) (Yang et al., 2022). In PDR, a three-level load price is used to represent the peak, valley, and flat power consumption characteristics, as shown in Figure 4. Assuming that 5% of the users participate in the PDR every hour, the elastic matrix parameters of the electricity price are listed in Table 4 (Cui et al., 2021b). In the IDR, the user compensation fee for the shiftable and sheddable load was 140 yuan/(MWh), and the parameter settings are shown in Table 5 and Table 6 (Hou et al., 2022b).
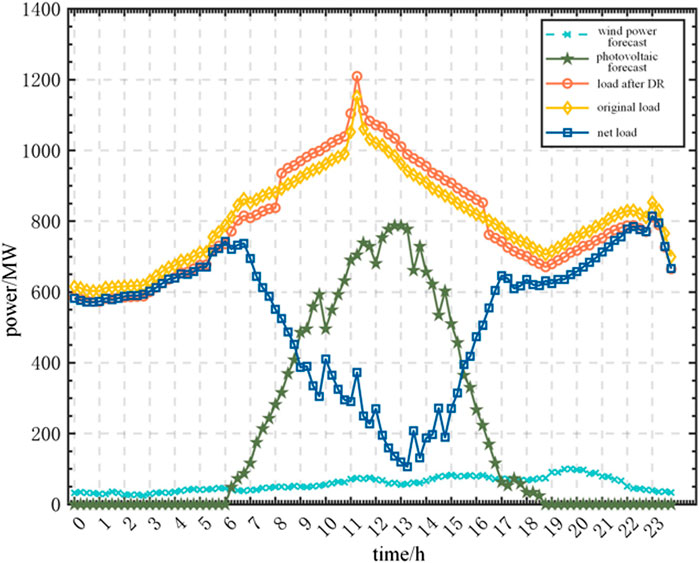
FIGURE 3. Wind power, photovoltaic power generation, and load curves.
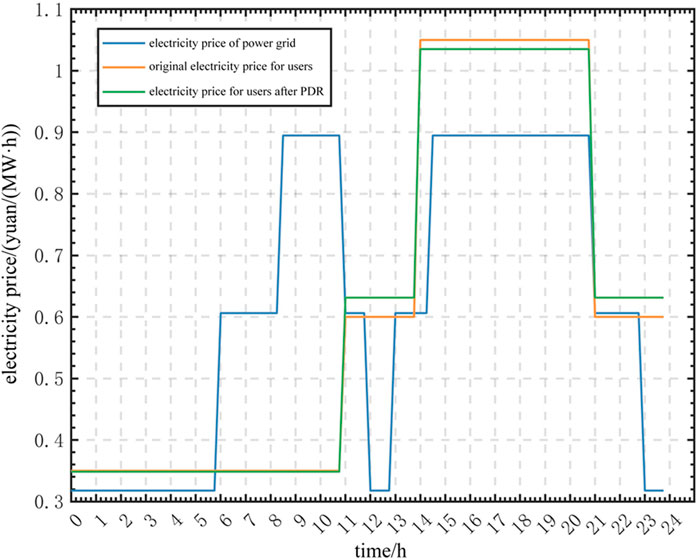
FIGURE 4. Electricity price of power grid and users.
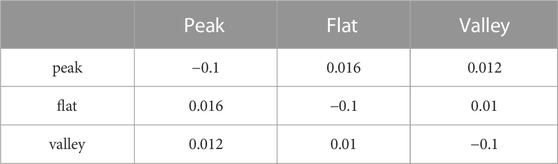
TABLE 4. Price elasticity matrix of demand.
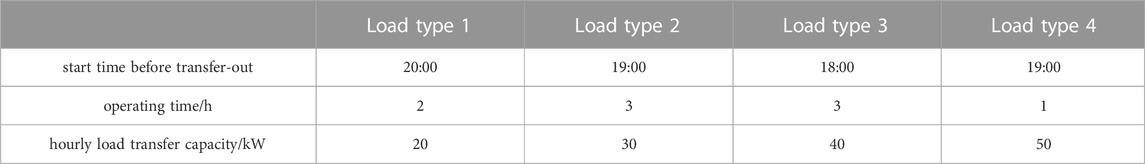
TABLE 5. Parameters of shiftable load.
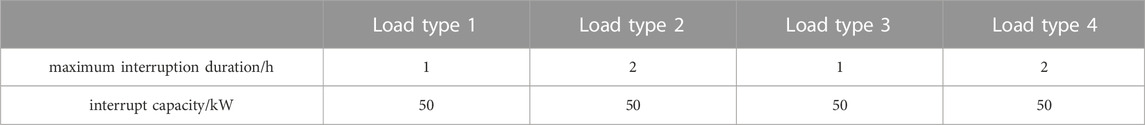
TABLE 6. Parameters of sheddable load.
6.2 System peak regulation dispatch results analysis
To develop an efficient and economical experimental design model, we used an
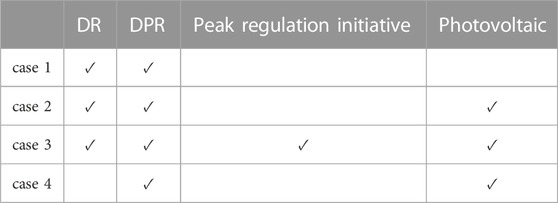
TABLE 7. Four cases for simulation.
The above four cases were simulated and analyzed, and the power output curves and optimization results for each entity are presented in Figure 5 and Table 8.
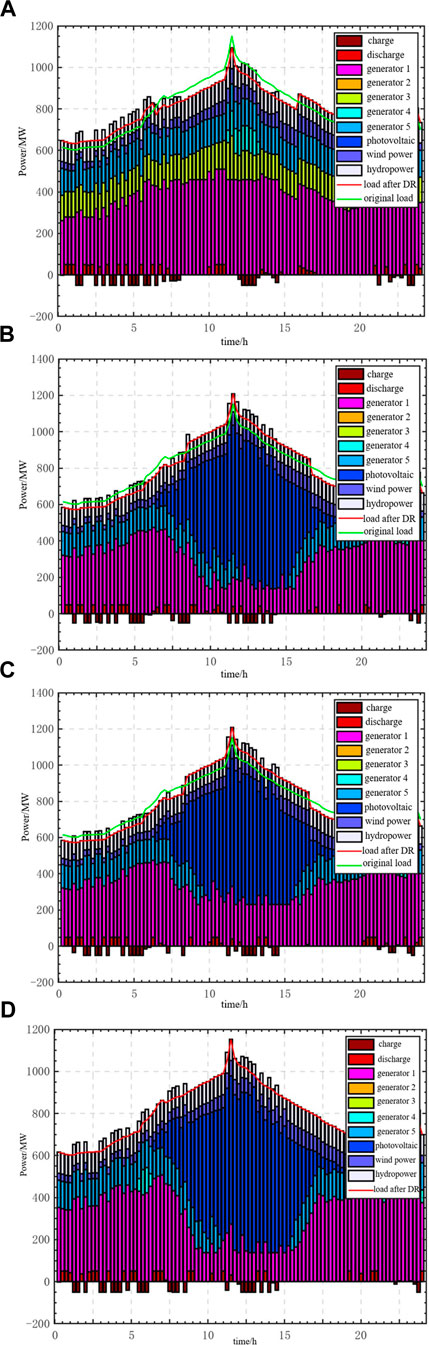
FIGURE 5. Optimal scheduling results of each unit under different cases. (A) Optimal scheduling results for case 1. (B) Optimal scheduling results for case 2. (C) Optimal scheduling results of Case 3. (D) Optimal scheduling results of Case 4.
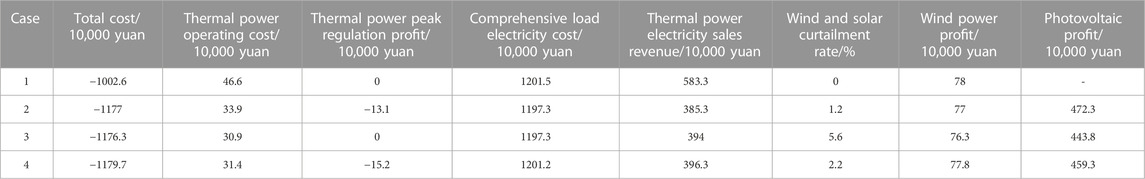
TABLE 8. Optimization results under different cases.
By comparing Cases 2 and 4, it can be seen that the renewable energy consumption significantly improved after the implementation of the demand response. The load curve was optimized by guiding users to change their power consumption behavior through demand response, and the wind power abandonment rate was reduced from 2.2% to 1.2%. In addition, the demand response can effectively reduce the peak–valley difference in the system net load, peak load pressure, and energy storage of the thermal power units. By comparing the output of the thermal power units in Figure 5, we can see that in Case 4, the thermal power unit output fluctuation is smaller and the operating cost is lower.
By comparing Cases 2 and 3, we found that Case 3 gives up the DPR because it considers the peak regulation initiative. This is because of the following reasons: although DPR improves the system’s flexibility, with an increase in the peak regulation depth, thermal power units face greater economic pressure owing to the unit loss cost and fuel injection cost and the reduced power generation. The peak regulation compensation obtained by thermal power units cannot fully compensate for the increased cost due to the DPR; therefore, they choose to withdraw from the peaking cooperation voluntarily, which proves the fairness of the cost compensation and capacity-sharing mechanism.
Case 3 can be viewed as a case in which DPR is not considered. Compared with Case 3, Case 2 considers DPR and ES access to the thermal power units. Despite the increased loss and fuel injection costs of the thermal power units, the DPR reduces the wind abandonment rate by 4.4% and increases the profit by 285,000 yuan. This is achieved while ensuring the lowest total operating cost of the system. In summary, the thermal power unit DPR has a significant effect on the renewable energy consumption and system operating costs.
To explore the impact of different renewable energy penetration rates on the system peak regulation, cases 1 and 2 were compared. The results show that, in Case 1, the operating cost of the thermal power units increases significantly with a decrease in renewable energy penetration. This is because thermal power units operate in the conventional peak regulation stage, instead of renewable energy to provide more electricity, need to face more coal consumption costs and start-stop costs. Despite the increased cost of the thermal power units, the system can still operate well in high-permeability wind and low-permeability renewable energy systems, thereby demonstrating good adaptability.
To further explore the effectiveness of the proposed model, this section analyzes the output of each thermal power unit, as shown in Figure 6.
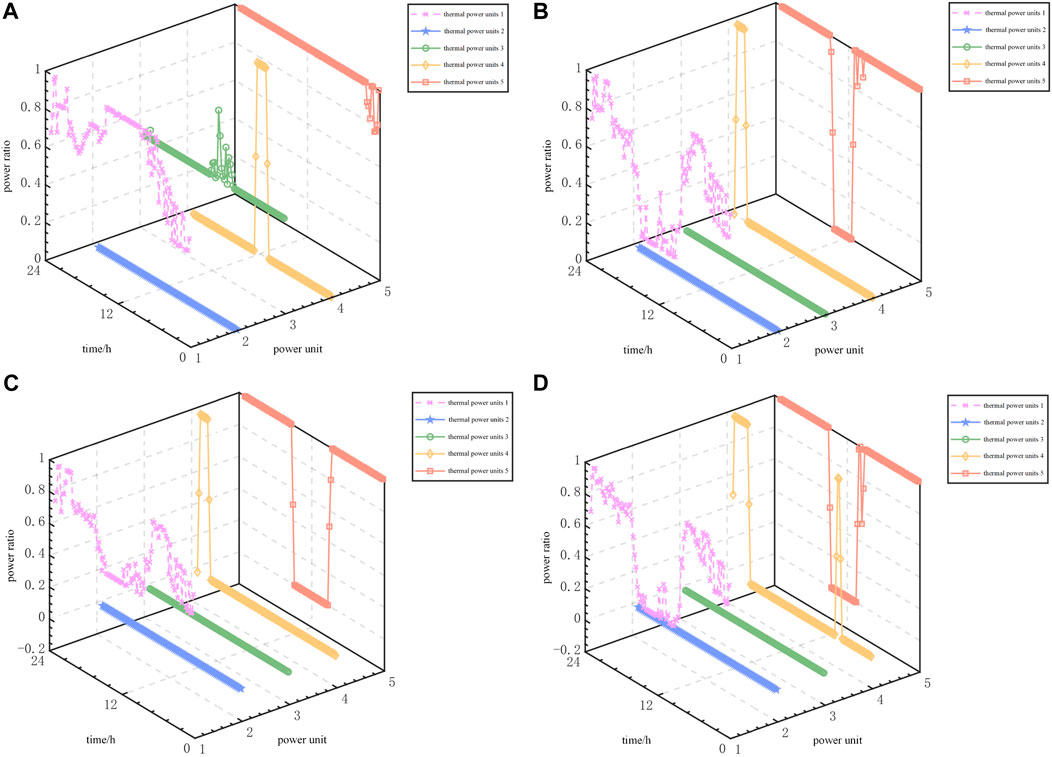
FIGURE 6. Optimal scheduling results of thermal power units under different cases. (A) Optimal scheduling results for case 1. (B) Optimal scheduling results for case 2. (C) Optimal scheduling results of Case 3. (D) Optimal scheduling results of Case 4.
In case 2, thermal power unit 1 is in the DPR state from 10:00 to 15:00, whereas units 4 and 5 perform the start-stop peak regulation. From the perspective of the system peak regulation effect, the DPR can improve the flexibility of the system. However, in Case 3, the DPR-related cost of the thermal power units cannot be adequately compensated for. Unit 1 includes the DPR and enters a normal peak load-balancing state after the active peak load-balancing constraint is introduced. This is because of the lack of compensation in the peak regulation service or the design of the compensation mechanism. Considering the peak load balancing initiative, it is essential to explore appropriate incentive mechanisms and compensation strategies. These efforts aim to attract thermal power units to participate actively in deep-peak regulations, which can significantly improve the system economy.
Similar to Case 3, the thermal power units in Case 1 did not participate in the DPR for different reasons. In Case 3, the thermal power units exit the DPR because the system fails to provide adequate compensation for the increased peaking cost. In Case 1, although there is a large peak and valley difference in the net load curve, the start–stop cost of small-capacity units is relatively low because of the large number of thermal power units; therefore, they can replace DPR by start-stop peaking. The system can achieve better economy and scheduling flexibility through a flexible start-stop peak regulation strategy. This means that thermal power units can not only combine depth peaking and start-stop peaking strategies to provide a stable power supply to the system, but can also reduce the peak-valley difference of the system. Thus, it is an economical and efficient choice for system operations.
7 Conclusion
This study addresses the peak regulation issues arising from the large-scale integration of renewable energy sources into the power grid, as well as China’s ancillary service electricity market reform. It proposes a source-load cooperative multimodal peak regulation and cost compensation mechanism for wind-solar-hydro-thermal-storage and hybrid demand-response power systems. The main conclusions are as follows.
(1) The proposed optimal scheduling for peak regulation is based on a capacity-proportional allocation mechanism. It can effectively smoothen the net load peak-valley difference and reduce the peak pressure on the thermal power units. The renewable energy consumption level of the system is increased by 4.4%, and the profit is increased by 5.6%.
(2) To encourage more thermal power units to actively participate in deep-peak load balancing, it is necessary to explore suitable incentive mechanisms and compensation strategies. The standard compensation system of auxiliary services for peak regulation in China’s power market still requires improvement, and the supporting policies require further strengthening.
(3) It should be pointed out that the proposed model still needs to test its operability through practice. In the follow-up study, the pilot work of peak regulation auxiliary service can be carried out on a regional scale, and the existing models can be compared and evaluated by using the cooperation and competition among multiple peak regulation subjects.
Data availability statement
The original contributions presented in the study are included in the article/Supplementary Material, further inquiries can be directed to the corresponding author.
Author contributions
TH: Conceptualization, Data curation, Writing–original draft. RF: Formal Analysis, Funding acquisition, Investigation, Writing–review and editing. ZW: Resources, Writing–review and editing. BH: Validation, Writing–review and editing. HH: Methodology, Supervision, Writing–original draft, Writing–review and editing.
Funding
This work is supported by the Science and Technology Project of State Grid Hubei Electric Power Company (No. 521538220005).
Conflict of interest
Authors TH, RF, and ZW were employed by the company State Grid Hubei Electric Power Company and BH was employed by the company State Grid Energy Research Institute Co., Ltd.
The remaining author declares that the research was conducted in the absence of any commercial or financial relationships that could be construed as a potential conflict of interest.
Publisher’s note
All claims expressed in this article are solely those of the authors and do not necessarily represent those of their affiliated organizations, or those of the publisher, the editors and the reviewers. Any product that may be evaluated in this article, or claim that may be made by its manufacturer, is not guaranteed or endorsed by the publisher.
References
Cao, Y., Zhou, B., Chung, C., Shuai, Z., Hua, Z., and Sun, Y. (2023). Dynamic modelling and mutual coordination of electricity and watershed networks for spatio-temporal operational flexibility enhancement under rainy climates. IEEE Trans. Smart Grid 14 (5), 3450–3464. doi:10.1109/tsg.2022.3223877
Cui, Y., Xiu, Z., Liu, C., Zhao, Y., Tang, Y., and Chai, X. (2021a). Double-layer optimal dispatch of power system considering demand response and fire-storage depth peak shaving pricing strategy. Proc. CSEE 41 (13), 4403–4415. doi:10.13334/j.0258-8013.pcsee.202105
Cui, Y., Zhou, H., Zhong, W., Zhao, Y., and Cui, C. (2021b). Optimal dispatch of power system with energy storage considering the initiative and demand response of thermal power peaking. High. Volt. Eng. 47 (5), 1674–1684. doi:10.13336/j.1003-6520.hve.20200440
Hou, H., Chen, Y., Liu, P., Xie, C., Huang, L., Zhang, R., et al. (2022c). Multisource energy storage system optimal dispatch among electricity hydrogen and heat networks from the energy storage operator prospect. IEEE Trans. Industry Appl. 58 (2), 2825–2835. doi:10.1109/tia.2021.3128499
Hou, H., Wang, Q., Xiao, Z., Xue, M., Wu, Y., Deng, X., et al. (2022a). Data-driven economic dispatch for islanded micro-grid considering uncertainty and demand response. Int. J. Electr. Power & Energy Syst. 136, 107623. doi:10.1016/j.ijepes.2021.107623
Hou, H., Wang, Q., Xue, M., Wu, X., Xie, C., and Zhang, Q. (2022b). Two-stage pre-day economic dispatch of off-grid microgrid considering source-load uncertainty and demand response. Power Syst. Prot. Control 50 (13), 73–85. doi:10.19783/j.cnki.pspc.211406
Huang, H., Li, Z., Sampath, L., Yang, J., Nguyen, H. D., Gooi, H. B., et al. (2023). Blockchain-enabled carbon and energy trading for network-constrained coal mines with uncertainties. IEEE Trans. Sustain. Energy 14 (3), 1634–1647. doi:10.1109/tste.2023.3240203
Jian, X., Zhang, L., Yang, L., Hang, X., and Wang, M. (2018). The deep peak shaving mechanism based on Kaldor's improved wind power under high proportion of wind power connection. Automation Electr. Power Syst. 42 (8), 110–118.
Jiang, Y., Wei, J., and Yang, S. G. (2022). Enhanced therapeutic potential of irreversible electroporation under combination with gold-doped mesoporous silica nanoparticles against EMT-6 breast cancer cells. Electr. Power Autom. Equip. 42 (4), 41–47. doi:10.3390/bios13010041
Ju, L., Zhou, Q., Lu, X., Yang, S., Fan, W., and Li, J. (2022). A multi-objective peak regulation transaction optimization and benefits coordination model for multi-sources coupling system considering flexible load response. Energy Rep. 8, 13083–13100. doi:10.1016/j.egyr.2022.10.013
Li, B., Yuan, X., Shi, J., Xu, H., and Luo, Z. (2022). Modeling and optimization of electrical thermal multi-energy flow in integrated energy system. J. Shanghai Jiao Tong Univ., 1–29. doi:10.16183/j.cnki.jsjtu.2022.494
Li, J., Zhang, J., Mu, G., Ge, Y., Yan, G., and Shi, T. (2019). Hierarchical optimization dispatch of deep peak shaving of energy storage assisted thermal power units. Power Syst. Technol. 43 (11), 3961–3970. doi:10.13335/j.1000-3673.pst.2019.1368
Li, T., Li, Z., Yang, J., Dettelbach, K. E., Jansonius, R. P., Sammis, G. M., et al. (2020). Photoelectrochemical decomposition of lignin model compound on a BiVO4 photoanode. Power Syst. Technol. 44 (10), 3622–3626. doi:10.1002/cssc.202001134
Li, Y., Deng, Y., Wang, Y., Jiang, L., and Shahidehpour, M. (2023a). Robust bidding strategy for multi-energy virtual power plant in peak-regulation ancillary service market considering uncertainties. Int. J. Electr. Power & Energy Syst. 151, 109101. doi:10.1016/j.ijepes.2023.109101
Li, Z., Wu, L., Xu, Y., Wang, L., and Yang, N. (2023b). Distributed tri-layer risk-averse stochastic game approach for energy trading among multi-energy microgrids. Appl. Energy 331, 120282. doi:10.1016/j.apenergy.2022.120282
Lin, L., and Tian, X. (2017). Economic dispatching and benefit analysis of power system based on graded deep peak regulation of thermal power units. Power Syst. Technol. 41 (7), 2255–2263. doi:10.13335/j.1000-3673.pst.2016.2720
National Development and Reform Commission, National Energy Administration (2022). Opinions on improving the system mechanism and policy Measures for energy green and low-carbon transformation. Available at: https://www.gov.cn/zhengce/zhengceku/2022-02/11/content_5673015.htm.
National Energy Administration (2023). Transcript of the online press conference for the third quarter of 2023. Available at: http://www.nea.gov.cn/2023-07/31/c_1310734825.htm.
National Energy Administration, Central China Regulatory Bureau (2022). Notice on issuing the "Hubei electric power peak regulation and ancillary service market operation rules (trial). Available at: http://hzj.nea.gov.cn/adminContent/initViewContent.do?pk=A79DB333C198B1E6E050A8C0C0C822D3.
Peng, F., Gao, Z., Hu, S., Zhou, W., Sun, H., and Wang, Z. (2020). Bilateral coordinated dispatch of multiple stakeholders in deep peak regulation. IEEE Access 8, 33151–33162. doi:10.1109/access.2020.2974050
Shi, Y., Li, Y., Zhou, Y., Xu, R., Feng, D., Yan, Z., et al. (2021). Optimal scheduling for power system peak load regulation considering short-time startup and shutdown operations of thermal power unit. Int. J. Electr. Power & Energy Syst. 131, 107012. doi:10.1016/j.ijepes.2021.107012
Song, X., Wang, P., Zhang, B., and Xing, T. (2022). A low-carbon peak-load regulation trading strategy for large-scale wind power integration using information gap decision theory. Energy Rep. 8, 9642–9661. doi:10.1016/j.egyr.2022.07.142
Tian, L., Xie, Y., Hu, B., Liu, X., Deng, T., Luo, H., et al. (2019). A deep peak regulation auxiliary service bidding strategy for CHP units based on a risk-averse model and district heating network energy storage. Energies 12 (17), 3314. doi:10.3390/en12173314
Wu, D., Cheng, H., Zhao, J., Geng, J., and Hou, W. (2019). Wind power segmentation and thermal power peak shaving compensation method based on balance cost. Automation Electr. Power Syst. 43 (3), 116–122.
Wu, W., Zhu, J., Chen, Y., Luo, T., Shi, P., Guo, W., et al. (2023b). Modified Shapley value-based profit allocation method for wind power accommodation and deep peak regulation of thermal power. IEEE Trans. Industry Appl. 59 (1), 276–288. doi:10.1109/tia.2022.3208866
Yang, L., Zhang, L., Wang, Y., Huo, W., and Wang, D. (2022). Integrated energy scheduling using wind-storage cascade control strategy in dynamic peak regulation right. Electr. Power Syst. Res. 212, 108644. doi:10.1016/j.epsr.2022.108644
Yang, X., Niu, D., Sun, L., Wang, K., and De, G. (2021). Participation of electric vehicles in auxiliary service market to promote renewable energy power consumption: case study on deep peak load regulation of auxiliary thermal power by electric vehicles. Energy Sci. Eng. 9 (9), 1465–1476. doi:10.1002/ese3.907
Ye, L., Yao, J., Yang, S., Ouyang, X., Yin, J., and Zhu, X. (2022). Quantification and apportionment model of peak shaving cost of power system with high proportion of renewable energy. Automation Electr. Power Syst. 46 (15), 20–28.
Yin, G., and Duan, M. (2022). Pricing the deep peak regulation service of coal-fired power plants to promote renewable energy integration. Appl. Energy 321, 119391. doi:10.1016/j.apenergy.2022.119391
Keywords: peak regulation ancillary service market, cost compensation, capacity-proportional allocation mechanism, peak regulation initiative, hybrid demand response, optimal scheduling
Citation: Hou T, Fang R, Wang Z, Huang B and Hou H (2023) Source-load cooperative multi-modal peak regulation and cost compensation mechanism in China’s ancillary service electricity market. Front. Energy Res. 11:1273354. doi: 10.3389/fenrg.2023.1273354
Received: 06 August 2023; Accepted: 04 September 2023;
Published: 19 September 2023.
Edited by:
Bin Zhou, Hunan University, ChinaCopyright © 2023 Hou, Fang, Wang, Huang and Hou. This is an open-access article distributed under the terms of the Creative Commons Attribution License (CC BY). The use, distribution or reproduction in other forums is permitted, provided the original author(s) and the copyright owner(s) are credited and that the original publication in this journal is cited, in accordance with accepted academic practice. No use, distribution or reproduction is permitted which does not comply with these terms.
*Correspondence: Hui Hou, aG91aHVpQHdodXQuZWR1LmNu