 Wei Yong
 Zhi-jie Wei1,2
 De-qiang Wang
95% of researchers rate our articles as excellent or good
Learn more about the work of our research integrity team to safeguard the quality of each article we publish.
Find out more
ORIGINAL RESEARCH article
Front. Energy Res. , 12 October 2023
Sec. Process and Energy Systems Engineering
Volume 11 - 2023 | https://doi.org/10.3389/fenrg.2023.1271359
This article is part of the Research Topic Mechanisms and Applications of Coupled Technologies in Unconventional Resources for Enhancing Oil/Gas Recovery View all 5 articles
Introduction: We perform molecular dynamics (MD) simulations of nanoscopic liquid water drops on a graphite substrate mimicking the carbon-rich pore surface in the presence of CH4/CO2 mixtures at temperatures in the range 300 K–473 K.
Methods: The surface tension in MD simulation is calculated via virial expression, and the water droplet contact angle is obtained through a cylindric binning procedure.
Results: Our results for the interfacial tension between water and methane as a function of pressure and for the interfacial tension between water and CH4/CO2 mixtures as a function of their composition agree well with the experimental and computational literature.
Discussion: The modified Young’s equation has been proven to bridge the macroscopic contact angle and microscopic contact with the experimental literature. The water droplet on both the artificially textured surface and randomly generated surface exhibits a transition between the Wenzel and Cassie–Baxter states with increased roughness height, indicating that surface roughness enhances the hydrophobicity of the solid surface.
Wettability, namely, interfacial tension and contact angle, is a mesoscale property of liquid–liquid–solid combination that depends on intermolecular forces. It is highly relevant to a wide range of industrial applications, such as designing water-resistant fabrics using wettability control in textile industries (Xue et al., 2014), contact lens evaluation and design in medical discipline (Menzies and Jones, 2010), enhanced oil/gas recovery, and carbon geo-sequestration (CGS) in petroleum industries (Zhou et al., 2016). For organic matter-rich unconventional formation, such as coal bed methane and shale formation, the interactions between (connate) water/methane and organic-rich matter (carbon) control multiphase transport that has direct impact on gas recovery.
Methane, as the main constituent of gas resources in unconventional reservoirs, is generally stored in nanoscale organic matter-rich pores (Curtis, 2002; Louk et al., 2017). The gas recovery of unconventional formation is much lower than that of other conventional formation. CO2 injection has proven to be an efficient conduction method to enhance the gas recovery (Busch et al., 2008; Edwards et al., 2015; Arif et al., 2017; Xu et al., 2017), which also helps reduce the CO2 atmosphere emission by storing CO2 in unconventional reservoirs. This is attributed to CO2 adsorption trapping (CO2 is adsorbed over the organic surface) (Eshkalak et al., 2014; Xu et al., 2017) and/or CO2 structural trapping (CO2 trapped beneath a tight/seal layer under non-CO2 wetting conditions) (Naylor et al., 2011) in reservoirs after injection. Both the gas recovery and CO2 geo-storage efficiency are affected by wettability as it controls the pore-scale fluid configuration (Zhou et al., 2016), trapping (Pentland et al., 2011; Roshan et al., 2016), and adsorption processes (Jho et al., 1978). As a result, a better understanding of interactions of the various components (water–carbon dioxide/methane–carbon) and associated transport process at the pore scale is of great importance.
It is well-known that CH4 and CO2 have different molecular properties, and thus, their interactions with water–rock are discrepant (Iglauer, 2017). Although the surface tension between water and CH4/CO2 mixture under a wide range of pressure–temperature conditions has been studied extensively through laboratory measurements (Jho et al., 1978; Sachs and Meyn, 1995; Ren et al., 2000; Kashefi et al., 2016), numerical simulation (Biscay et al., 2009; Sakamaki et al., 2011; Yang et al., 2017), and theoretical analysis (Schmidt et al., 2007; Miqueu et al., 2011), very limited effort has been put to analyze CO2/CH4/H2O interfacial phenomena from a molecular scale and how CO2/CH4 mixture influences the contact angle defined at the organic solid and water triple contact line.
It is challenging to realistically replicate the conditions in nanoscale organic matter-rich pores using experimental methodology. The nanoscopic length scales make direct visualization of pore-scale processes virtually impossible, specifically at the high temperatures and pressures. Given the length scales we are interested in, molecular dynamics (MD) simulations are an appropriate tool for nano pore-scale process investigation. There is extensive literature relevant to surface phenomena and wetting behavior. For example, the contact angle of a water–CO2–solid (quartz) system has been well-studied using MD simulation (Iglauer et al., 2012); Liu et al. (2010) studied the pressure dependence of the water contact angle over both hydrophobic and hydrophilic surfaces in the CO2/water/solid (quartz) system. These results show that the presence of CO2 changes the system wettability, leading to an increase in the water contact angle. The efficiency of CO2 displacing methane in carbon channels (Wu et al., 2015) and the methane adsorption mechanism in shale pores represented by graphite sheets (Mosher et al., 2013) have also been investigated through MD simulations. It is noteworthy that the solid surface in these CO2 and methane-related wetting studies has usually been treated as the smooth surface, while the effect of surface roughness on wetting behavior is still lacking.
The aim of this paper is first to simulate the surface tension of H2O/CH4 and H2O/CH4/CO2 under a wide range of temperatures and pressures. Then, we quantify wettability of water on graphite sheets, mimicking the carbon-rich reservoirs in the presence of methane and carbon dioxide. There is a vast literature relating to stacks of graphite sheets that accurately mimic actual organic-rich pores for a wide range of temperatures and pressures in MD simulations. For example, these studies on water contact angle simulation over organic surface (Werder et al., 2003) and methane flow transport in organic shale pores (Kazemi and Takbiri-Borujeni, 2016) treating the organic-rich pores as graphite sheets and their results show a good agreement with both simulation results and experimental data. The effect of artificial and random surface roughness on nano water wetting behavior has been discussed.
The remaining sections of this paper are organized in the following manner. In the next section, we summarize the simulation methodology and the force field parameters used. The model system, simulation methodology, and the force field models used in the MD simulations are described. We then explain the surface roughness creation approach and how simulation data have been collected and analyzed. The Results section consists of two main parts. In the first part, we study—through MD—the surface tension of water against methane and against methane/carbon dioxide mixtures, and we compare our results with the experimental and computational literature in order to build confidence in our simulation approach. In the second part, we report on simulations of the water contact angle on graphite in a CH4/CO2 environment over a range of droplet sizes. Then, we reveal the surface roughness effect on the water contact angle. The final section reiterates the main conclusions of our work.
Most of our simulation systems consist of a water droplet at the middle of a graphite surface in the presence of a CO2–CH4 mixture, as shown in Figure 1. The graphite substrate is represented by two graphene sheets at a distance of 3.35 Å. For surface tension simulation, the carbon atoms in graphite sheets have been removed and a typical symmetric system is shown in Figure 2.

FIGURE 1. Front view of configuration of a H2O–CH4–CO2–carbon system at T = 300 K and P = 5 MPa. Blue and green represent C and O in CO2, respectively, orange and olive represent C and H in methane, respectively, red and white represent O and H in water, respectively, and yellow represents C in graphite sheets.
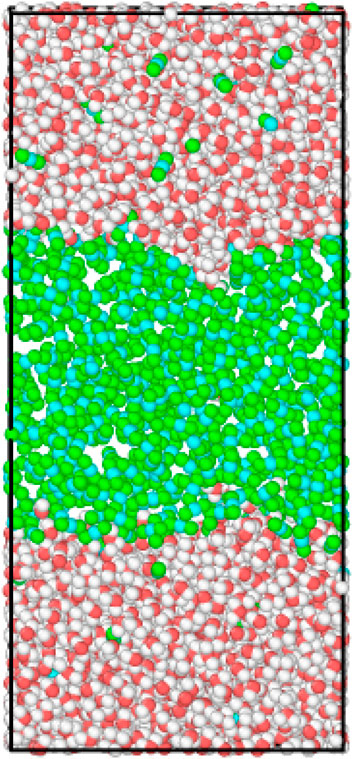
FIGURE 2. Snapshot of CO2−H2O molecular distribution at equilibrium (CO2 mole fraction XCO2 = 100%), at T = 311 K and at pressure that equals to 14.5 MPa.
The combination of the Lennard–Jones potential and the electrostatic (“Coulombic”) potential is used for pairwise interactions:
with
For the intramolecular interactions, we have been using the SPC/E model for water (Wu et al., 2006), Cygan model for CO2 (Cygan et al., 2012), and OPLS model for CH4 (Aimoli et al., 2014). The force field for graphene is taken as reported in Stuart et al. (2000). These force fields have been extensively used and validated in a wide body of MD studies. For example, their results about thermodynamic properties and flow transport characteristics have been reported with reasonable accuracy (Aimoli et al., 2014). The velocity Verlet algorithm (Swope et al., 1982) is performed to achieve position and velocity update, with a time step of 2 fs. The carbon atoms in graphite sheets have fixed locations (Yong et al., 2020), and all MD simulations were performed with the open-source molecular dynamic simulation code LAMMPS (Plimpton, 1995), under periodic boundary conditions.
A randomly rough surface is characterized by its roughness height and correlation length. The correlation length describes lateral dimensions and sometime is called surface spatial wavelengths or roughness length scale. The root-mean-squared (RMS) height
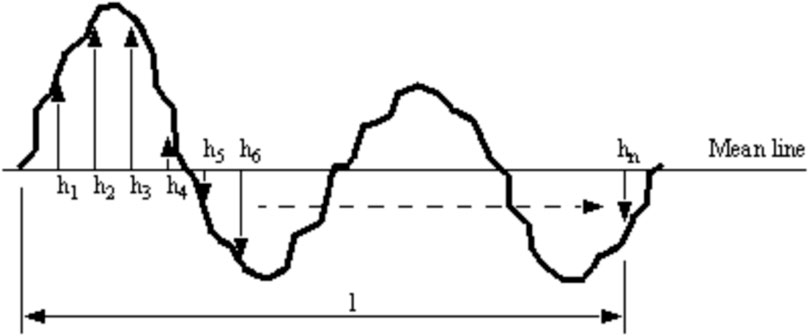
FIGURE 3. Schematic representation of a rough surface to determine its RMS height.
The random Gaussian surfaces are generated by a (N, M) matrix of rough amplitudes [Zij] having Gaussian distribution of heights and by a given (n, m) autocorrelation function (ACF) using linear transformations on the random matrix. For a simple method to generate surface roughness (Patir, 1978), a simple ACF is used, which will result in a constant coefficient matrix. This simple ACF does not require the solution of a system of non-linear equations.
Consider a family of ACFs of the form
where
where
The components of a (N + n, M + m) matrix [ηij] first generated are independent, and identically distributed Gaussian random numbers with a mean value equal to zero and unit standard deviation. The generation of a Gaussian surface having an ACF of form (4) is accomplished by the linear transformation
For determining surface tension, a planar interface with its normal in the Z-direction was created in a fully periodic domain. After equilibration, surface tension
where
with V being the volume of the simulation domain, N the total number of atoms,
For contact angle estimation, a water droplet is placed on a graphite substrate and allowed to equilibrate for 1 ns until it reaches a well-defined droplet shape. The sessile droplet is then used to estimate the contact angle. An example of extracting the contact angle is given in Figure 4. It presents a 2-ns time-averaged axisymmetric average concentration field obtained through a cylindric binning procedure (De Ruijter et al., 1999). Then, a best circular fit through the points of the field that have a water concentration of 0.02 (1/Å3), a half of bulk density, is extrapolated to the top graphite sheet where the contact angle θ is measured as 112.55° in this figure.
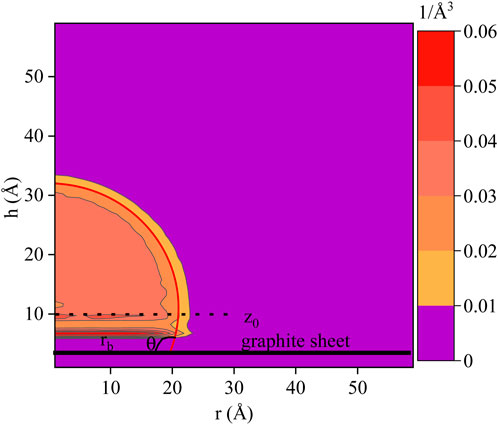
FIGURE 4. Example to extract the contact angle from a radial time-averaged water droplet concentration profile. The points above Z0 = 10 A are used in the circular fit process.
The dependence of the contact angle on the droplet size is studied through the modified Young’s equation (Pethica, 1997), which allows bridging the macroscopic and microscopic contact angle through the surface tension γ and the line tension τ:
where
Eq 9 can be used to determine
We first validate our simulation methodology by comparing the surface tension between CH4 and water with literature data from numerical simulations (Yang et al., 2017) and experiments (Jennings Jr and Newman, 1971; Tian et al., 1997; Shariat, 2014; Kashefi et al., 2016). The simulation domain is an orthogonal box with a size of 40 Å by 40 Å in X and Y directions and a size in the Z-direction that is used to control pressure under periodic boundary conditions. The domain contains 512 CH4 molecules and 2048 H2O molecules. Temperature has been fixed at 373 K. The pressure has been varied in the range 0–85 MPa by adjusting the domain length in the Z-direction. The simulations were run for 4 ns in the NPT ensemble to reach the desired pressure and then continued for 2 ns in the NVT ensemble to collect data for surface tension calculation. Surface tension has been calculated using Eq 6. We estimate uncertainties in surface tension and pressure by calculating their standard deviation based on the series of values obtained over 100 ps time intervals.
As shown in Figure 5, our results of surface tension versus pressure are compared to literature data. Our simulations follow the overall trend, as found in previous studies: a decrease in surface tension with increasing pressure until the pressure reaches a value of the order of 30 MPa where surface tension has reduced by approximately 30%. Beyond that pressure, surface tension only weakly depends on pressure. For the lower pressures—below 30 MPa—our results are within the range of variation in the experimental data. Beyond 30 MPa, our surface tension is generally on the high side compared to measured data. It is interesting to note that the same is true for the simulation data set provided in Yang et al. (2017). The results in Figure 5 provide a baseline data set and proper starting point for studying the effects of mixing CO2 with CH4 on surface tension.
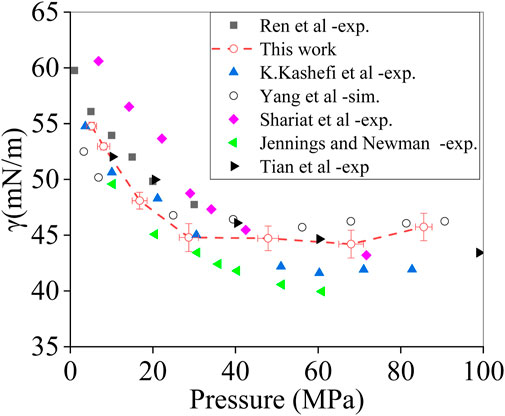
FIGURE 5. Surface tension of the methane–water interface as a function of pressure at T = 373 K. Our simulation data compared to experimental and computational data from the literature, as indicated.
The same procedure has been replicated by varying temperature at another three temperatures T = 311K, 423K, and 473 K. Figure 6 shows a decrease in CH4–H2O surface tension with increasing temperature. However, the surface tension versus pressure has a similar trend, as described in Figure 5 at T = 373 K.
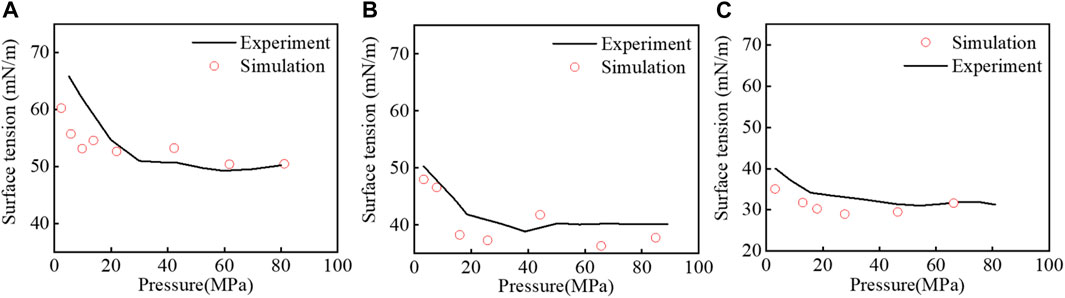
FIGURE 6. Pressure series of IFT for the CH4−H2O systems. The experimental data (black lines) correspond to Kashefi et al. (2016): (A) 311, (B) 423, and (C) 473 K.
We now turn to surface tension between water and CH4/CO2 mixtures. This is conducted at a constant pressure of 15 MPa and at three temperatures, viz., 311 K, 353 K, and 398 K, based on availability of literature data (Ren et al., 2000; Yang et al., 2017). As previously shown, we have 2048 water molecules. The total number of CH4 plus CO2 molecules is 512. The number fraction of CO2 molecules out of these 512 is denoted as
Figure 7 shows surface tension as a function of
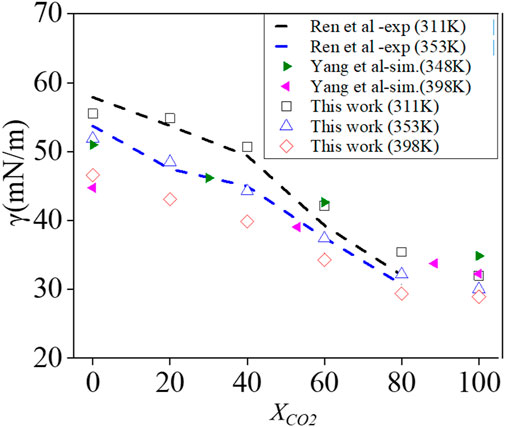
FIGURE 7. Influence of the CO2 mole fraction on the surface tension of a CH4/CO2 mixture against water at p = 15 MPa at three temperatures, as indicated. Comparison with literature data.
The simulation results illustrate that there is a reduction of surface tension when adding CO2 to a CH4–water system by adding XCO2 = 0–100%. This can be understood by the species concentration profiles over the interface that show a stronger interaction between CO2 and water than that between CH4 and water with CO2 partially dissolving in water in Figure 8. Such observations are in line with Miguez et al. (2014); Yang et al. (2017).
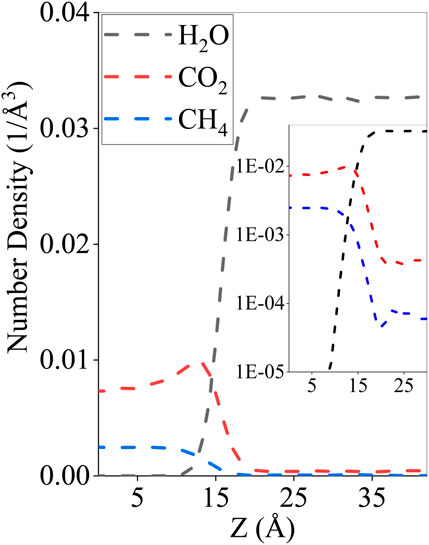
FIGURE 8. Equilibrium molecular number density profile of CO2, CH4, and H2O at T = 311 K and p = 15 MPa. Inset: an enlarged figure of CO2/CH4 number density across the water interface.
Given the modified Young’s equation Eq 9, the water droplets simulated in the current study (that are of nanoscopic size) can be related to the contact angle at the macroscale. The number of water molecules is given as 530, 995, 2015, 3981, and 5000 at fixed temperature 300 K for all three situations:(1) water-only system; (2) water droplet in a CH4 environment with 3249 CH4 molecules accounting to 3.0 MPa; (3) water droplet in a CO2 environment with 3249 CO2 molecules accounting to 3.5 MPa. The simulation domain has been set to 120 × 120 × 120Å3.
As shown in Figure 9, the macroscopic contact angles estimated from modified Young’s equation of the three systems are 79.54° ± 1.15°, 99.56° ± 1.86°, and 112.80° ± 2.14°. The extrapolated macroscopic θ of water sitting on graphite sheets is in line with that from the experimental measurements of 79.3° for the water contact angle on chemically pure graphene (Li et al., 2013). Our simulated
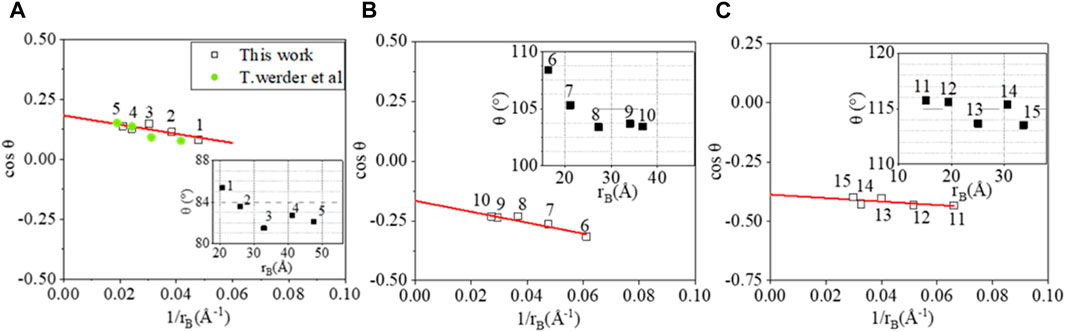
FIGURE 9. cosθ presented as a function of the droplet base curvature
We compare the contact angle results on artificially textured and randomly generated rough surfaces in this section. For the artificial surface, the near-square lattice pillar arrangement has been used with an example of schematic representation of one pillar layer surface shown in Figure 10. There are all five artificial surface-related water contact angle simulations that have been performed from the number of pillar layer(s) that equals to 1 to 5, representing the increased roughness height. For random roughness, four surfaces with random roughness have been generated by changing the standard deviation of the roughness height
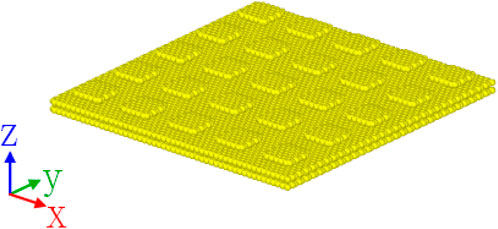
FIGURE 10. Perspective view of one-layer pillar substrates used in water contact angle simulations. Quadrangular pillars with a lateral size of 12.3 * 12.8 Å were arranged with a spacing of 12.3/12.8 Å between them in the X/Y direction. The rough layer is at 3.35 Å away from the top of the two-layer graphite sheets.
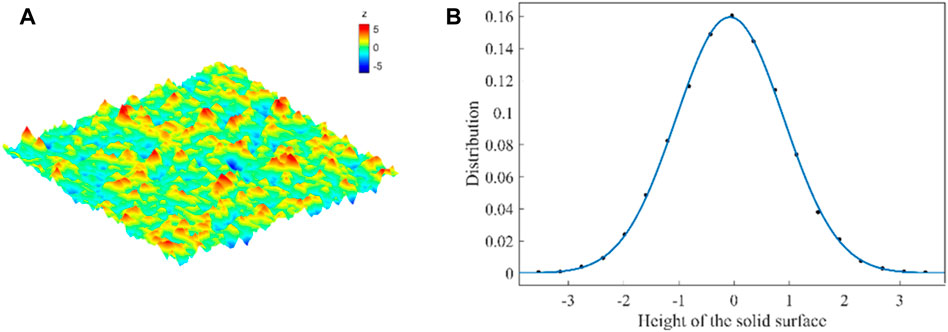
FIGURE 11. (A) Profile of a randomly generated surface with the standard deviation of the roughness height
Wenzel and Cassie–Baxter models (Koishi et al., 2009) are common among the theories that allow describing the water-wetting behaviors of rough substrates. For the Wenzel model, water molecules completely fill the grooves of the rough surface. In a Cassie–Baxter state, nanodroplets form on rough substrates and the water molecules do not fill the grooves completely. Figure 12 presents the water contact angle results with its interactions with two aforementioned surfaces. It shows that roughness enhances the hydrophobicity of the solid surface, for both artificial and random surfaces, leading a wetting transition between the Wenzel and Cassie–Baxter states with increased root-mean-squared (RMS) height of the surface. Our findings are in agreement with other studies (Park et al., 2011; Khan and Singh, 2014).
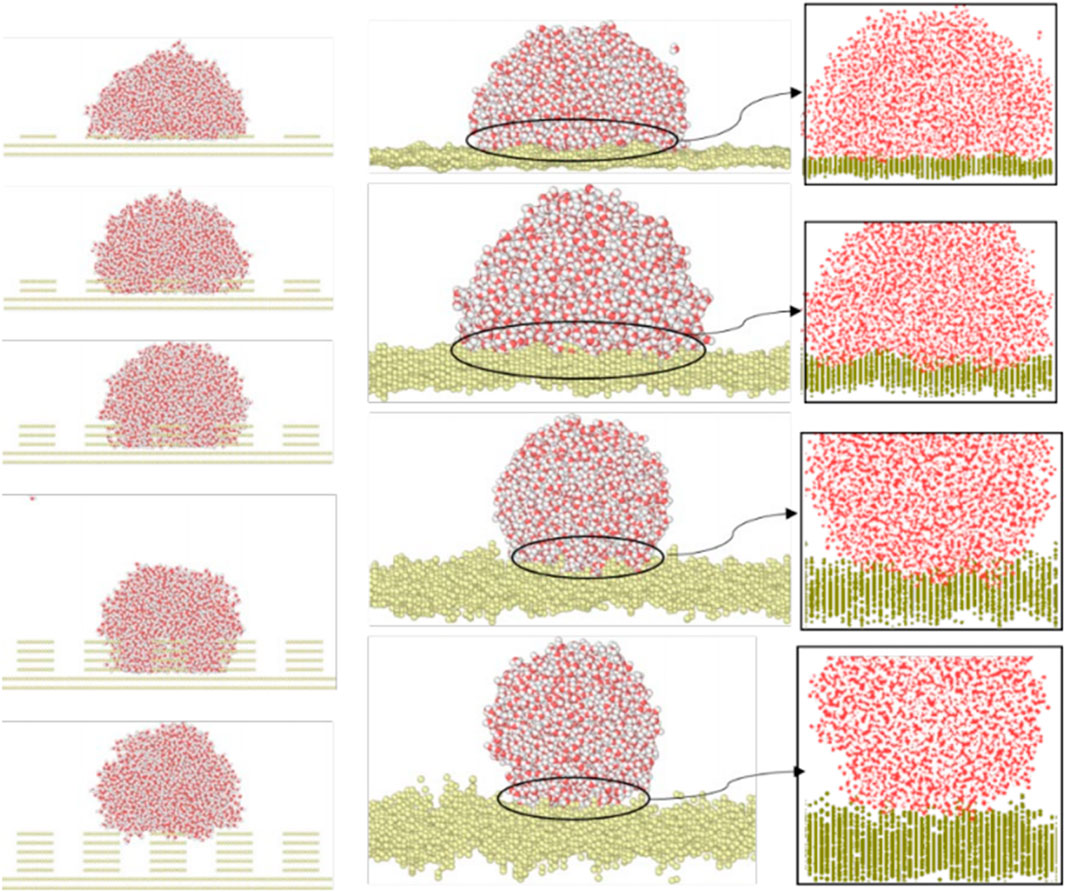
FIGURE 12. Effects of surface roughness on the contact angle. Left column: water droplet on the artificial quadrangular pillars with increased roughness height; right column: drop on the Gaussian random rough surface with RMS amplitude equals to 1, 2, 3, and 4 Å, respectively, together with their corresponding enlarged views.
In this work, we have presented a molecular-scale study of the CO2/CH4/H2O surface tension over a range of pressures, compositions, and temperatures and of the dependence of the water droplet contact angle on CH4 and CO2 with MD simulations based on a full-atom approach. The effect of surface roughness on the water contact angle is also considered in this study, and our results validate the hydrophobicity of the increasing surface roughness height on the water contact angle. The conclusions of our simulation are as follows:
• Consistent with available data from the literature, we find a decrease in CH4–H2O surface tension with increasing pressure until the pressure reaches a value of the order of 30 MPa where surface tension has reduced by approximately 30% at T = 373 K. Beyond that pressure, surface tension only weakly depends on pressure. The surface tension shows a decreasing trend with temperature.
• For CO2–CH4–H2O surface tension, it decreases with increasing temperature and with increasing CO2 fraction. Approximately 40% decrease was observed when adding CO2 to the CH4–water system by adding XCO2 = 0–100%. This is attributed to a stronger interaction between CO2 and water than that between CH4 and water with CO2 partially dissolving in water.
• The droplet size effect on the contact angle recovered from MD simulations has been analyzed. Our results justify the use of modified Young’s equation that can be used to extrapolate our findings at the nanoscale to macroscopic contact angles that are amenable to experimental validation.
• Roughness enhances the hydrophobicity of the solid surface, leading to a wetting transition between the Wenzel state and Cassie–Baxter state with an increased RMS height of the surface.
In this paper, we have been studying water static wettability in shale nanopores. In future, we will be working on water dynamics wettability under a constant pressure-driven environment to account for more complicated situation.
The raw data supporting the conclusion of this article will be made available by the authors, without undue reservation.
WY: writing–original draft, writing-review and editing. Z-jW: Supervision. Y-yL: Data curation. D-qW: software and writing–review and editing. Y-zC: Conceptualization and Investigation.
The author(s) declare financial support was received for the research, authorship, and/or publication of this article. This work was supported by the Independent Prospective Basic Project of State Key Laboratory of Offshore Oil Exploitation in 2023 and the National Natural Science Foundation of China (52074347).
Authors WY, Z-jW, Y-yL, D-qW, and Y-zC were employed by CNOOC Research Institute Co., Ltd.
All claims expressed in this article are solely those of the authors and do not necessarily represent those of their affiliated organizations, or those of the publisher, the editors, and the reviewers. Any product that may be evaluated in this article, or claim that may be made by its manufacturer, is not guaranteed or endorsed by the publisher.
Aimoli, C. G., Maginn, E. J., and Abreu, C. R. (2014). Transport properties of carbon dioxide and methane from molecular dynamics simulations. J. Chem. Phys. 141, 134101. doi:10.1063/1.4896538
Arif, M., Lebedev, M., Barifcani, A., and Iglauer, S. (2017). Influence of shale-total organic content on CO2 geo-storage potential. Geophys. Res. Lett. 44, 8769–8775. doi:10.1002/2017gl073532
Biscay, F., Ghoufi, A., Lachet, V., and Malfreyt, P. (2009). Monte Carlo calculation of the methane-water interfacial tension at high pressures. J. Chem. Phys. 131, 124707. doi:10.1063/1.3236390
Busch, A., Alles, S., Gensterblum, Y., Prinz, D., Dewhurst, D. N., Raven, M. D., et al. (2008). Carbon dioxide storage potential of shales. Int. J. Greenh. gas control 2, 297–308. doi:10.1016/j.ijggc.2008.03.003
Curtis, J. B. (2002). Fractured shale-gas systems. AAPG Bull. 86, 1921–1938. doi:10.1306/61EEDDBE-173E-11D7-8645000102C1865D
Cygan, R. T., Romanov, V. N., and Myshakin, E. M. (2012). Molecular simulation of carbon dioxide capture by montmorillonite using an accurate and flexible force field. J. Phys. Chem. C 116, 13079–13091. doi:10.1021/jp3007574
Darden, T., York, D., and Pedersen, L. (1993). Particle mesh Ewald: an N⋅ log (N) method for Ewald sums in large systems. J. Chem. Phys. 98, 10089–10092. doi:10.1063/1.464397
De Ruijter, M. J., Blake, T. D., and De Coninck, J. (1999). Dynamic wetting studied by molecular modeling simulations of droplet spreading. Langmuir 15, 7836–7847. doi:10.1021/la990171l
Edwards, R. W., Celia, M. A., Bandilla, K. W., Doster, F., and Kanno, C. M. (2015). A model to estimate carbon dioxide injectivity and storage capacity for geological sequestration in shale gas wells. Environ. Sci. Technol. 49, 9222–9229. doi:10.1021/acs.est.5b01982
Eshkalak, M. O., Al-shalabi, E. W., Sanaei, A., Aybar, U., and Sepehrnoori, K. (2014). Enhanced gas recovery by CO2 sequestration versus re-fracturing treatment in unconventional shale gas reservoirs.
Hudson, G. H., and McCoubrey, J. C. (1960). Intermolecular forces between unlike molecules. A more complete form of the combining rules. Trans. Faraday Soc. 56, 761–766. doi:10.1039/tf9605600761
Iglauer, S. (2017). CO2–water–rock wettability: variability, influencing factors, and implications for CO2 geostorage. Accounts Chem. Res. 50, 1134–1142. doi:10.1021/acs.accounts.6b00602
Iglauer, S., Mathew, M. S., and Bresme, F. (2012). Molecular dynamics computations of brine–CO2 interfacial tensions and brine–CO2–quartz contact angles and their effects on structural and residual trapping mechanisms in carbon geo-sequestration. J. colloid interface Sci. 386, 405–414. doi:10.1016/j.jcis.2012.06.052
Jennings, H. Y., and Newman, G. H. (1971). The effect of temperature and pressure on the interfacial tension of water against methane-normal decane mixtures. Soc. petroleum Eng. J. 11, 171–175. doi:10.2118/3071-pa
Jho, C., Nealon, D., Shogbola, S., and King, A. D. (1978). Effect of pressure on the surface tension of water: adsorption of hydrocarbon gases and carbon dioxide on water at temperatures between 0 and 50 C. J. colloid interface Sci. 65, 141–154. doi:10.1016/0021-9797(78)90266-7
Kashefi, K., Pereira, L. M., Chapoy, A., Burgass, R., and Tohidi, B. (2016). Measurement and modelling of interfacial tension in methane/water and methane/brine systems at reservoir conditions. Fluid Phase Equilibria 409, 301–311. doi:10.1016/j.fluid.2015.09.050
Kazemi, M., and Takbiri-Borujeni, A. (2016). Flow of gases in organic nanoscale channels: a boundary-driven molecular simulation study. Energy fuels. 30, 8156–8163. doi:10.1021/acs.energyfuels.6b01456
Khan, S., and Singh, J. K. (2014). Wetting transition of nanodroplets of water on textured surfaces: a molecular dynamics study. Mol. Simul. 40, 458–468. doi:10.1080/08927022.2013.819578
Koishi, T., Yasuoka, K., Fujikawa, S., Ebisuzaki, T., and Zeng, X. C. (2009). Coexistence and transition between Cassie and Wenzel state on pillared hydrophobic surface. PNAS 106, 8435–8440. doi:10.1073/pnas.0902027106
Li, Z., Wang, Y., Kozbial, A., Shenoy, G., Zhou, F., McGinley, R., et al. (2013). Effect of airborne contaminants on the wettability of supported graphene and graphite. Nat. Mater. 12, 925–931. doi:10.1038/nmat3709
Liu, S., Yang, X., and Qin, Y. (2010). Molecular dynamics simulation of wetting behavior at CO 2/water/solid interfaces. Chin. Sci. Bull. 55, 2252–2257. doi:10.1007/s11434-010-3287-0
Louk, K., Ripepi, N., Luxbacher, K., Gilliland, E., Tang, X., Keles, C., et al. (2017). Monitoring CO2 storage and enhanced gas recovery in unconventional shale reservoirs: results from the Morgan County, Tennessee injection test. J. Nat. Gas Sci. Eng. 45, 11–25. doi:10.1016/j.jngse.2017.03.025
Menzies, K. L., and Jones, L. (2010). The impact of contact angle on the biocompatibility of biomaterials. Optometry Vis. Sci. 87, 387–399. official publication of the American Academy of Optometry. doi:10.1097/opx.0b013e3181da863e
Miguez, J. M., Garrido, J. M., Blas, F. J., Segura, H., Mejía, A., and Pineiro, M. M. (2014). Comprehensive Characterization of Interfacial Behavior for the Mixture CO2 + H2O + CH4: comparison between Atomistic and Coarse Grained Molecular Simulation Models and Density Gradient Theory. J. Phys. Chem. C 118, 24504–24519. doi:10.1021/jp507107a
Miqueu, C., Míguez, J. M., Pineiro, M. M., Lafitte, T., and Mendiboure, B. (2011). Simultaneous application of the gradient theory and Monte Carlo molecular simulation for the investigation of methane/water interfacial properties. J. Phys. Chem. B 115, 9618–9625. doi:10.1021/jp202276k
Mosher, K., He, J., Liu, Y., Rupp, E., and Wilcox, J. (2013). Molecular simulation of methane adsorption in micro-and mesoporous carbons with applications to coal and gas shale systems. Int. J. Coal Geol. 109, 36–44. doi:10.1016/j.coal.2013.01.001
Naylor, M., Wilkinson, M., and Haszeldine, R. S. (2011). Calculation of CO2 column heights in depleted gas fields from known pre-production gas column heights. Mar. Petroleum Geol. 28, 1083–1093. doi:10.1016/j.marpetgeo.2010.10.005
Nielsen, L. C., Bourg, I. C., and Sposito, G. (2012). Predicting CO2–water interfacial tension under pressure and temperature conditions of geologic CO2 storage. Geochimica Cosmochimica Acta 81, 28–38. doi:10.1016/j.gca.2011.12.018
Park, J., Ha, M., Choi, H., Hong, S., and Yoon, H. (2011). A study on the contact angles of a water droplet on smooth and rough solid surfaces. J. Mech. Sci. Technol. 25, 323–332. doi:10.1007/s12206-010-1218-2
Patir, N. (1978). A numerical procedure for random generation of rough surfaces. Wear 47, 263–277. doi:10.1016/0043-1648(78)90157-6
Pentland, C. H., El-Maghraby, R., Iglauer, S., and Blunt, M. J. (2011). Measurements of the capillary trapping of super-critical carbon dioxide in Berea sandstone. Geophys. Res. Lett. 38. doi:10.1029/2011gl046683
Pethica, B. A. (1977). The contact angle equilibrium. J. Colloid Interface Sci. 62, 567–569. doi:10.1016/0021-9797(77)90110-2
Plimpton, S. (1995). Fast parallel algorithms for short-range molecular dynamics. J. Comput. Phys. 117, 1–19. doi:10.1006/jcph.1995.1039
Ren, Q., Chen, G., Yan, W., and Guo, T. (2000). Interfacial Tension of (CO2 + CH4) + Water from 298 K to 373 K and Pressures up to 30 MPa. J. Chem. Eng. Data 45, 610–612. doi:10.1021/je990301s
Roshan, H., Al-Yaseri, A. Z., Sarmadivaleh, M., and Iglauer, S. (2016). On wettability of shale rocks. J. colloid interface Sci. 475, 104–111. doi:10.1016/j.jcis.2016.04.041
Sachs, W., and Meyn, V. (1995). Pressure and temperature dependence of the surface tension in the system natural gas/water principles of investigation and the first precise experimental data for pure methane/water at 25 C up to 46.8 MPa. Colloids Surfaces A Physicochem. Eng. Aspects 94, 291–301. doi:10.1016/0927-7757(94)03008-1
Sakamaki, R., Sum, A. K., Narumi, T., Ohmura, R., and Yasuoka, K. (2011). Thermodynamic properties of methane/water interface predicted by molecular dynamics simulations. J. Chem. Phys. 134, 144702. doi:10.1063/1.3579480
Schmidt, K. A., Folas, G. K., and Kvamme, B. (2007). Calculation of the interfacial tension of the methane–water system with the linear gradient theory. Fluid Phase Equilibria 261, 230–237. doi:10.1016/j.fluid.2007.07.045
Shariat, A. (2014). Measurement and modeling gas-water interfacial tension at high pressure/high temperature conditions.
Siemons, N., Bruining, H., Castelijns, H., and Wolf, K. (2006). Pressure dependence of the contact angle in a CO2–H2O–coal system. J. colloid interface Sci. 297, 755–761. doi:10.1016/j.jcis.2005.11.047
Stuart, S. J., Tutein, A. B., and Harrison, J. A. (2000). A reactive potential for hydrocarbons with intermolecular interactions. J. Chem. Phys. 112, 6472–6486. doi:10.1063/1.481208
Swope, W. C., Andersen, H. C., Berens, P. H., and Wilson, K. R. (1982). A computer simulation method for the calculation of equilibrium constants for the formation of physical clusters of molecules: application to small water clusters. J. Chem. Phys. 76, 637–649. doi:10.1063/1.442716
Tian, Y., Xiao, Y., Zhu, H., Dong, X., Ren, X., and Zhang, F. (1997). Interfacial tensions between water and non-polar fluids at high pressures and high temperatures. Acta Physico-Chimica Sin. 13, 89–95. doi:10.3866/pku.whxb19970120
Werder, T., Walther, J. H., Jaffe, R. L., Halicioglu, T., and Koumoutsakos, P. (2003). On the water− carbon interaction for use in molecular dynamics simulations of graphite and carbon nanotubes. J. Phys. Chem. B 107, 1345–1352. doi:10.1021/jp0268112
Wu, H., Chen, J., and Liu, H. (2015). Molecular dynamics simulations about adsorption and displacement of methane in carbon nanochannels. J. Phys. Chem. C 119, 13652–13657. doi:10.1021/acs.jpcc.5b02436
Wu, Y., Tepper, H. L., and Voth, G. A. (2006). Flexible simple point-charge water model with improved liquid-state properties. J. Chem. Phys. 124, 024503. doi:10.1063/1.2136877
Xu, R., Zeng, K., Zhang, C., and Jiang, P. (2017). Assessing the feasibility and CO2 storage capacity of CO2 enhanced shale gas recovery using Triple-Porosity reservoir model. Appl. Therm. Eng. 115, 1306–1314. doi:10.1016/j.applthermaleng.2017.01.062
Xue, C., Li, Y., Zhang, P., Ma, J., and Jia, S. (2014). Washable and wear-resistant superhydrophobic surfaces with self-cleaning property by chemical etching of fibers and hydrophobization. ACS Appl. Mater. interfaces 6, 10153–10161. doi:10.1021/am501371b
Yang, Y., Narayanan Nair, A. K., and Sun, S. (2017). Molecular dynamics simulation study of carbon dioxide, methane, and their mixture in the presence of brine. J. Phys. Chem. B 121, 9688–9698. doi:10.1021/acs.jpcb.7b08118
Yong, W., Derksen, J., and Zhou, Y. (2020). The influence of CO2 and CH4 mixture on water wettability in organic rich shale nanopore. J. Nat. Gas. Sci. Eng. 87, 103746. doi:10.1016/j.jngse.2020.103746
Keywords: surface tension, contact angle, surface roughness, molecular dynamics, CO2/H2O/CH4 mixture
Citation: Yong W, Wei Z-j, Liu Y-y, Wang D-q and Cui Y-z (2023) A molecular dynamics investigation on CO2–H2O–CH4 surface tension and CO2–CH4–H2O–graphite sheet contact angles. Front. Energy Res. 11:1271359. doi: 10.3389/fenrg.2023.1271359
Received: 02 August 2023; Accepted: 27 September 2023;
Published: 12 October 2023.
Edited by:
Hao Xiong, Yale University, United StatesReviewed by:
Gang Lei, China University of Geosciences Wuhan, ChinaCopyright © 2023 Yong, Wei, Liu, Wang and Cui. This is an open-access article distributed under the terms of the Creative Commons Attribution License (CC BY). The use, distribution or reproduction in other forums is permitted, provided the original author(s) and the copyright owner(s) are credited and that the original publication in this journal is cited, in accordance with accepted academic practice. No use, distribution or reproduction is permitted which does not comply with these terms.
*Correspondence: Wei Yong, eW9uZ3dlaUBjbm9vYy5jb20uY24=
Disclaimer: All claims expressed in this article are solely those of the authors and do not necessarily represent those of their affiliated organizations, or those of the publisher, the editors and the reviewers. Any product that may be evaluated in this article or claim that may be made by its manufacturer is not guaranteed or endorsed by the publisher.
Research integrity at Frontiers
Learn more about the work of our research integrity team to safeguard the quality of each article we publish.