 Zheng-Chuang Wang1
 Jin-Cai Niu1,2*
- 1School of Electronic Engineering, Chaohu University, Hefei, China
- 2State Key Laboratory of Reliability and Intelligence of Electrical Equipment, Hebei University of Technology, Tianjin, China
This study aims to propose a wind power prediction method that achieves high accuracy in order to minimize the impact of wind power on the power system and reduce scheduling difficulties in systems incorporating wind power. The importance of developing renewable energy has been recognized by society due to the increasing severity of the energy crisis. Wind energy offers advantages such as efficiency, cleanliness, and ease of development. However, the random nature of wind energy poses challenges to power systems and complicates the scheduling process. Therefore, accurate wind power prediction is of utmost importance. A wind power prediction model was constructed based on an improved tunicate swarm algorithm–extreme learning machine (ITSA-ELM). The improved tunicate swarm algorithm (ITSA) optimizes the random parameters of extreme learning machine (ELM), resulting in the best prediction performance. ITSA is an enhancement of the tunicate swarm algorithm (TSA), which introduces a reverse learning mechanism, a non-linear self-learning factor, and a Cauchy mutation strategy to address the drawbacks of poor convergence and susceptibility to local optima in TSA. Two different scenarios were used to verify the effectiveness of ITSA-ELM. The results showed that ITSA-ELM has a decrease of 1.20% and 21.67% in MAPE, compared with TSA-ELM, in May and December, respectively. This study has significant implications for promoting the development of renewable energy and reducing scheduling difficulties in power systems.
1 Introduction
Fossil fuels are considered the most widely used energy source worldwide so far. Still, due to their limited reserves, they are prone to serious environmental pollution during use and cannot meet the current world’s demand for sustainable energy development (Liu S. et al., 2022; Zishan et al., 2023). Distributed power generation technology has emerged as an important way to alleviate energy shortages and environmental pollution issues (Ai et al., 2022; Mohale and Chelliah, 2022). Wind power generation, because of its pros of green, low-carbon, and sustainable development, has become a more promising energy generation method (Zhu et al., 2023). In recent years, nearly a hundred countries worldwide have built wind power projects, with the wind power industry being the most developed in Asia, Europe, and the Americas (Zuo et al., 2023). Moreover, the proportion of wind power in the industrial structure of world energy resources is increasing yearly, which has a broad development and application prospect (Liu X. F. et al., 2022; Jency and Judith, 2022; Zhuang et al., 2023). With the support of low-carbon and sustainable development strategies, new power systems dominated by new energy sources will achieve rapid and integrated development.
Against the backdrop of the existing energy structure, the wind power’s proportion of the power grid will continue to increase (Abdulrazaq and Vural, 2022; Xiong et al., 2022). Unlike traditional thermal power units, wind power output is influenced by external factors such as aging of internal devices, geographical environment, and meteorological conditions (Catalao et al., 2011). Moreover, wind power output has significant non-stationary, stochastic, and intermittent characteristics, which pose serious challenges to the safe and reliable operation of the power system (Jia et al., 2023). Therefore, the personnel of the system operation center will take “wind abandonment” measures to ensure the reliability and safety of the power system operation (Wei et al., 2022; Zhu et al., 2023). The measures can lead to energy waste, which is not conducive to improving new energy consumption and reducing the competitiveness of new power systems containing wind power (Liu et al., 2021a). Accurate wind power output prediction results can facilitate relevant departments to allocate electricity resources reasonably and improve the safety of the operation (Ying et al., 2023). Therefore, the power industry increasingly needs accurate wind power output prediction methods.
Wind power output prediction methods can be categorized based on the duration of the forecast into ultra-short-term, short-term, medium-term, and long-term predictions (Yakoub et al., 2023). Medium-term and long-term predictions can be used to formulate power grid maintenance plans and annual power generation plans for photovoltaic or wind farms, determine the location of new photovoltaic or wind farms, and evaluate photovoltaic or wind power resources (Ji et al., 2021). Ultra-short-term prediction is mainly used to solve real-time scheduling analysis of power grids (Hu et al., 2022). Short-term prediction is primarily used for formulating unit generation plans and solving peak shaving problems, which is also a key challenge in the prediction field that this research institute needs to address (Hong and Santos, 2023; Mohammadzadeh et al., 2023).
Extreme learning machine (ELM) is a fast, simple, and effective machine learning algorithm with low computational complexity and high prediction accuracy. The improved tunicate swarm algorithm (ITSA) was proposed to optimize the weights and thresholds of ELM and construct an ITSA-ELM wind power prediction model. The analysis of the example results shows that this model can achieve an accurate prediction of wind power.
This study aims to achieve an accurate wind power output prediction, and its main innovation points are given as follows:
(1) In response to the limitations to TSA, such as being prone to falling into local extremum solutions and weak global convergence performance, the reverse learning mechanism, non-linear self-learning factor, and Cauchy mutation strategy were introduced into TSA to propose ITSA.
(2) Aiming at solving the problem of ELM random parameters affecting performance and being difficult to be selected, ITSA is used to optimize ELM for improving its ability to characterize the wind power uncertainty.
(3) The optimization ability of the proposed ITSA was verified using different test functions, and its superiority in convergence accuracy and stability was proven.
(4) The wind power prediction ability of ITSA-ELM was verified by two numerical examples. This model has been proven to better characterize the volatility of wind power randomness compared to other models.
Next, Section 2 provides relevant literature analysis. Section 3 introduces the basic model. Section 4 proposes the ITSA algorithm. Section 5 establishes a wind power processing prediction model and explains the conducted simulation verification. Section 6 explains the conclusion and implication.
2 Literature review
In recent years, research has focused on wind power output prediction methods, which can be roughly divided into physical, statistical, and data-driven methods combined with computational intelligence (Tastu et al., 2011; Zhang et al., 2021). The physical method refers to using wind turbine mathematical models to calculate wind power output based on weather forecast data, combined with sufficient on-site conditions of the wind farm location (Yuan et al., 2021). Physical methods rely on accurate weather forecast data and need to consider the specific on-site conditions of wind farms, which increases the complexity of retesting (Yu et al., 2022). Statistical methods are used to predict wind power output by fitting the internal relationship between data through statistical models. The time series model is a traditional statistical model (Wang et al., 2021). Statistical methods require high data requirements and require a large amount of historical data for modeling and fitting. In some cases, historical data may be insufficient or incomplete, leading to a decrease in prediction accuracy. Data-driven methods have been applied in prediction research, and commonly used methods include deep learning and machine learning (Wang et al., 2021). The data-driven method learns complex relationships between data through training models, enabling the prediction of time series.
ELM has the characteristics of fast strong robustness and learning speed in regression prediction (Yang et al., 2021). Wan et al. (2016) suggested that the random generation of weights and thresholds influences the predictive performance of ELM. Detailed analysis was conducted using the standard ELM and the optimized ELM by Shi et al. (2021). Adnan et al. (2023) proposed to use the particle swarm optimization algorithm to optimize probability regular ELM, based on which a prediction model was constructed for piecewise prediction. Qi et al. (2020) used the cuckoo search algorithm to optimize ELM to achieve short-term wind power prediction. In conclusion, the combination of an intelligent evolutionary algorithm and ELM can improve the prediction performance of the original model and achieve an accurate prediction. Zhao et al. (2016) focused on short-term commercial load forecasting and a prediction method based on peak-valley features, and the TSA-ELM model was proposed.
The wind power output sequence has strong non-stationary characteristics, and there is an urgent need for accurate models to characterize the wind power output sequence. Therefore, developing an algorithm with strong convergence and high optimization accuracy is necessary to optimize ELM weights and thresholds. TSA proposed by Zhou et al. (2022) is a new swarm intelligence optimization algorithm (Kaur et al., 2020). TSA can be used to solve optimization problems. Considering extreme load growth, Kommula and Kota (2022) focused primarily on proposing a new method of TSA to optimize the integration of electrical distribution networks. Ganti et al. (2021) improved TSA to control the speed and torque errors of brushless DC motors. Gharehchopogh (2022) used TSA to optimize the radial basis function neural network to improve maximum system power tracking in a photovoltaic system. Considering the limitations of TSA, such as being prone to falling into local extreme solutions and weak global convergence performance, this study proposes an ITSA algorithm, improving the optimization ability through a reverse learning mechanism, non-linear self-learning factor, and Cauchy mutation strategy. ITSA is used to optimize the internal random parameters of ELM.
This study aims to improve the wind power output prediction accuracy. A precise prediction model based on ITSA-ELM is constructed. The feasibility and effectiveness of the proposed prediction model are verified through the wind farm’s actual wind power output data. This study can enhance the ability to characterize the uncertainty of wind power generation, thereby providing decision-makers with more scientific and accurate scheduling solutions.
3 Extreme learning machine
ELM is a fast, simple, and effective machine learning algorithm (Ding, 2015). The core idea of ELM is to randomly generate the connection weights between the input layer and the hidden layer, as well as the bias of the hidden layer, and then use regularization methods to solve the connection weights between the output layer and the hidden layer. Compared to traditional neural network algorithms, ELM has the advantages of fast training speed, low computational complexity, and high prediction accuracy (Zong et al., 2013).
ELM has a wide range of applications in wind power prediction. By using ELM, historical wind speed, direction, temperature, and other meteorological data can be used to predict the future wind power output. The fast training speed of ELM enables it to process large-scale wind power datasets, and its high prediction accuracy can improve the accuracy and reliability of wind power prediction (Wan et al., 2014). The structural diagram of ELM is shown in Figure 1.
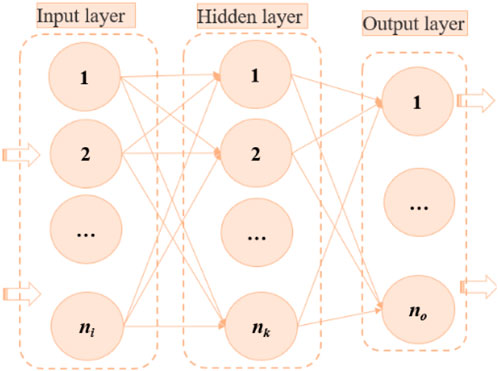
FIGURE 1. Structural diagram of ELM.
Since the thresholds and weights from the input layer to the hidden layer of the ELM are generated randomly, so its learning speed is fast.
The relationship between the input and output of ELM is expressed as follows:
where bi is the threshold from the input layer to the hidden layer for extreme learning machine. βi is the connection coefficient from the hidden layer to the output layer of the extreme learning machine. g is the activation function.
During training, ELM takes the minimum error between predicted and actual values as the objective function for training and learning, which is expressed as follows:
The smaller the result of the aforementioned equation is, the closer the absolute value of the difference between the expected output value and the true value is to 0. At this point, the problem can be transformed as follows:
where H is the hidden layer node value, and the expressions of H, β, and Z are as follows:
The expression of
where
4 Method for optimizing ELM
The key parameters of ELM affect its predictive performance. This paper uses an intelligent optimization algorithm to optimize the selection of key parameter values for ELM to achieve optimal performance.
4.1 Tunicate swarm algorithm
TSA mainly solves optimization problems by simulating the jet propulsion walking mode and swarm intelligent behavior of the swarm (Gharehchopogh, 2022). Tunicates are marine organisms that gather together in groups and form complex structures. They adjust their shape and position by adhering to or repelling each other, in order to adapt to changes in the environment. Within the group, there is self-organization and adaptability, allowing the group to achieve optimization and adaptation through cooperation and coordination. In TSA, the group adjusts its shape and position through the adhesion and repulsion behaviors between individuals, which can be used to solve the search and optimization processes in optimization problems.
TSA mainly considers the following three behaviors of individuals in the capsule group.
(1) Avoiding search conflicts between individuals
The gravity, deep-sea advection, and individual competitiveness were considered in the construction process of TSA to avoid search conflicts among individuals in the encapsulated group. The updated position of the individual in the obtained capsule group can be expressed as follows:
where
where smin (smin = 1) represents the initial velocity of individuals in the capsule group; smax (smax = 4) represents the speed at which other individuals follow the optimal individual (Gharehchopogh, 2022).
(2) Approaching the optimal individual
The equation of distance
where
(3) Convergence to the optimal individual
The individuals in the capsule group always converge toward the optimal individual direction, expressed as follows:
In order to save the current first two optimal solutions and update the positions of other search individuals based on the best search individual’s position, the group behavior of coated animals is expressed as follows:
4.2 Improved tunicate swarm algorithm
TSA can solve optimization problems through mathematical modeling. Its core idea is to achieve group optimization and adaptation through cooperation and coordination. This algorithm shows potential in solving complex optimization problems and can be applied in multiple fields, such as engineering optimization, machine learning, and data mining. However, the convergence performance of TSA needs to be improved, and it may also fall into local optima, making it difficult to find global optima. This study focuses on improving the TSA in the early, middle, and late stages. Furthermore, it is to improve the convergence ability and search performance of TSA.
Improvement 1: The reverse learning mechanism has been widely applied to population initialization, enabling the initial population to better approximate the current solution. For any solution
where
Improvement 2: The search method has been introduced in the iterative process of the non-linear self-learning factor balance algorithm (Hsu et al., 2011). Non-linear self-learning factors enable discoverers to search more comprehensively in the search space near the current location, promoting individuals to obtain better solutions.
The non-linear self-learning factor is expressed as follows:
where
At this point, the position update formula is expressed as follows:
Improvement 3: To increase the diversity of the individual space and address the issue of getting trapped in local optima during optimization, the Cauchy mutation operation is introduced in each iteration. The formula for updating the new location can be expressed as follows:
where
4.3 Optimization process of ITSA
The flowchart of ITSA is shown in Figure 2. The detailed steps for iterative optimization of ITSA are described as follows.
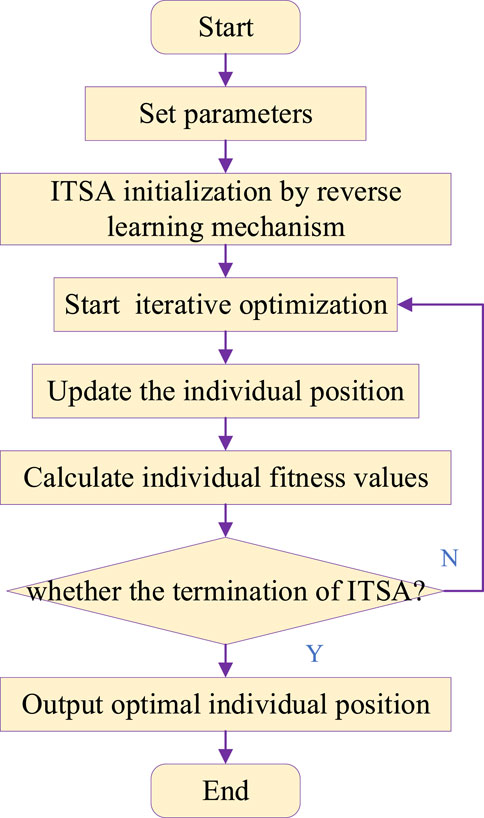
FIGURE 2. Flowchart of ITSA.
Step 1: Set parameters such as population size and iteration times.
Step 2: Use a reverse learning mechanism to obtain the position of the initial population and calculate individual fitness values.
Step 3: The ITSA algorithm starts iterative optimization, updating the optimal individual position and fitness value in ITSA.
Step 4: Calculate the distance between other individuals in the capsule group and the optimal individual according to Eq. 11.
Step 5: Calculate the non-linear self-learning factor and update the individual position according to Eq. 17.
Step 6: Use the Cauchy mutation strategy to adjust the position of individuals in the capsule group, calculate the individual fitness value after positional variation, and further update the optimal individual position and fitness value.
Step 7: Determine whether the termination conditions of ITSA (referring to meeting the set accuracy requirements) are met. If the termination conditions are met, terminate the algorithm operation; otherwise, return to Step 4.
4.4 Verification of ITSA
The benchmark testing functions are selected for feasibility verification of the algorithm, which are often used in feasibility analysis studies of algorithms. In addition, we selected representative comparative algorithms to achieve objective analysis of the algorithm. Particle swarm optimization (PSO) is the most classic intelligent optimization method and is often chosen as a comparison method (Khare and Rangnekar, 2013). The moth flame optimization (MFO) algorithm is a new type of swarm intelligence optimization algorithm proposed in recent years with certain representativeness (Mirjalili, 2015). The standard TSA algorithm was also used as a comparative algorithm to verify the effectiveness of improvement measures. Table 1 shows the benchmark test functions (Li and Wu, 2022). Table 2 shows the parameter settings of the algorithm (Catalao et al., 2011; Ai et al., 2022).
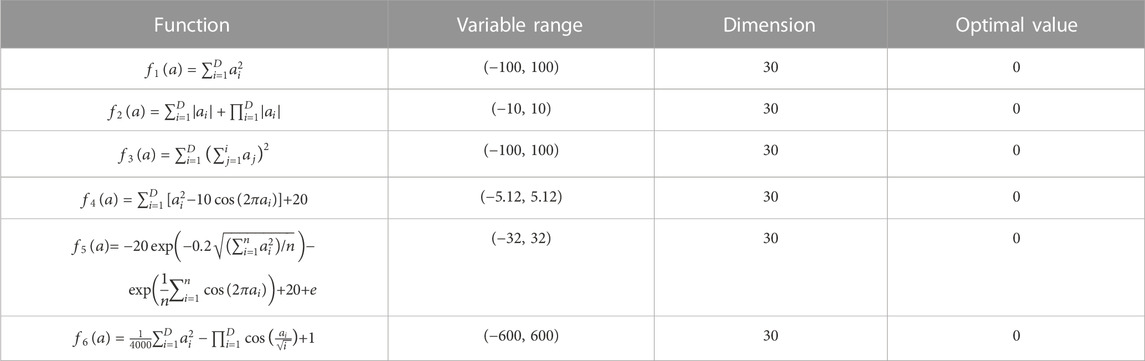
TABLE 1. Test function details.
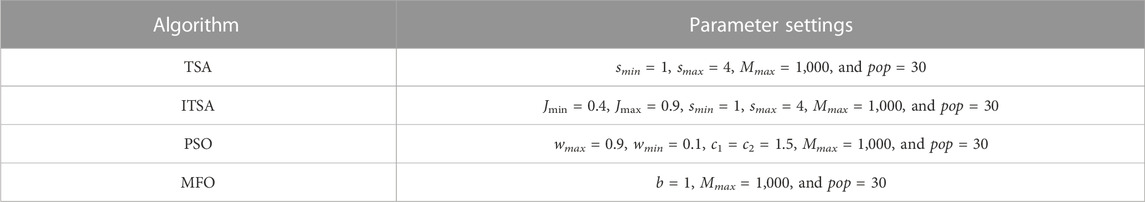
TABLE 2. Parameter settings.
The number of iterations and population size of each optimization algorithm remain consistent. Mmax is the maximum number of iterations. wmax and wmin are the upper and lower limits of the weight values, respectively; and c1 and c2 are self-cognition and social cognition coefficients in the PSO algorithm, respectively (Liu et al., 2021b). smin and smax are the initial velocity and adjoint velocity in the TSA algorithm, respectively. b is used to define the spiral scale in the MFO algorithm. Other parameters are default values.
The algorithms are tested on the same platform to ensure the fairness of the results. The experimental environment of this study is a Windows 10 operating system, 8GB memory, and Intel Core i7. All experiments are written and run based on MATLAB R2017a. Each optimization algorithm was independently run 50 times for each benchmark test function in this study to ensure the objectivity of the test results. Assuming p1, p2, … , pn as the convergence results obtained after the algorithm has been run 50 times, where n (n = 50) represents the number of times the algorithms have been run. The average running time of each algorithm is also calculated to reflect the complexity of algorithm operation. Based on the statistical results, the algorithm is evaluated using the optimal convergence value (Opt), mean convergence value (Mean), and standard deviation (Std), as follows:
Table 3 shows that the ITSA proposed in this study converged to the optimal value when solving F1 and F3 problems. Although ITSA did not converge to the optimal value when solving the F2 problem, it can be seen from the Std index that the ITSA algorithm has superior robustness. By comparing with the comparison algorithms, it can be seen that the optimal value of ITSA is significantly better. From the perspective of time indicators, the solving time of ITSA for F1, F2, and F3 is 0.274, 0.31, and 2.189 s, respectively. The optimization time of ITSA is longer than that of the comparison algorithms because the improved strategy increases the complexity of algorithm operation.
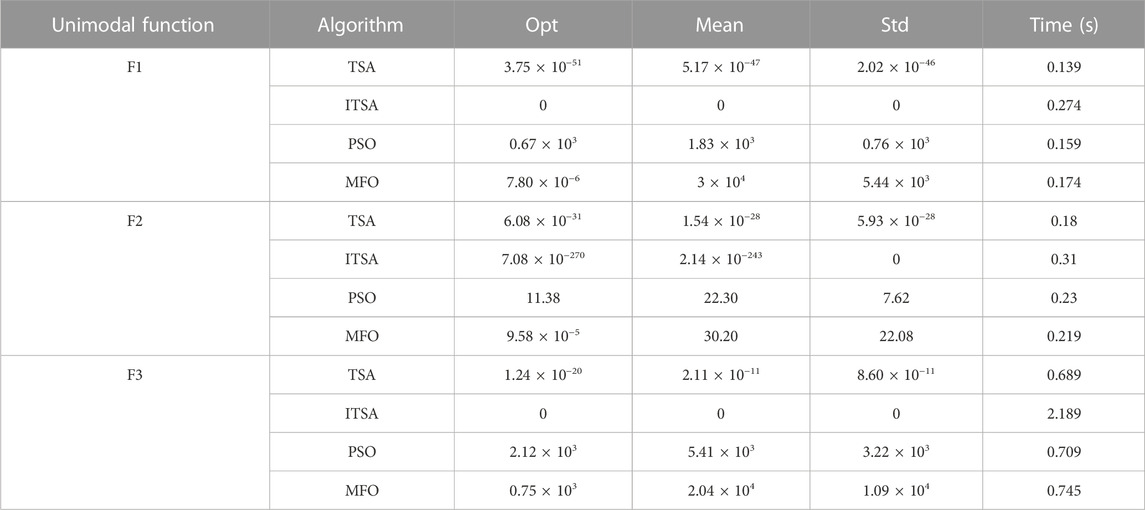
TABLE 3. Statistical results of unimodal function testing.
Table 4 shows that TSA and ITSA achieved an optimal global value when optimizing F6. ITSA can effectively avoid local extremum solutions and has significant advantages in solving multimodal optimization problems compared to existing algorithms. For F4 and F6, ITSA converges to the optimal solution 0 of the function under different test dimensions. For F5, ITSA did not converge to the global optimal value, but it converged to 8.88 × 10⁻¹⁶.
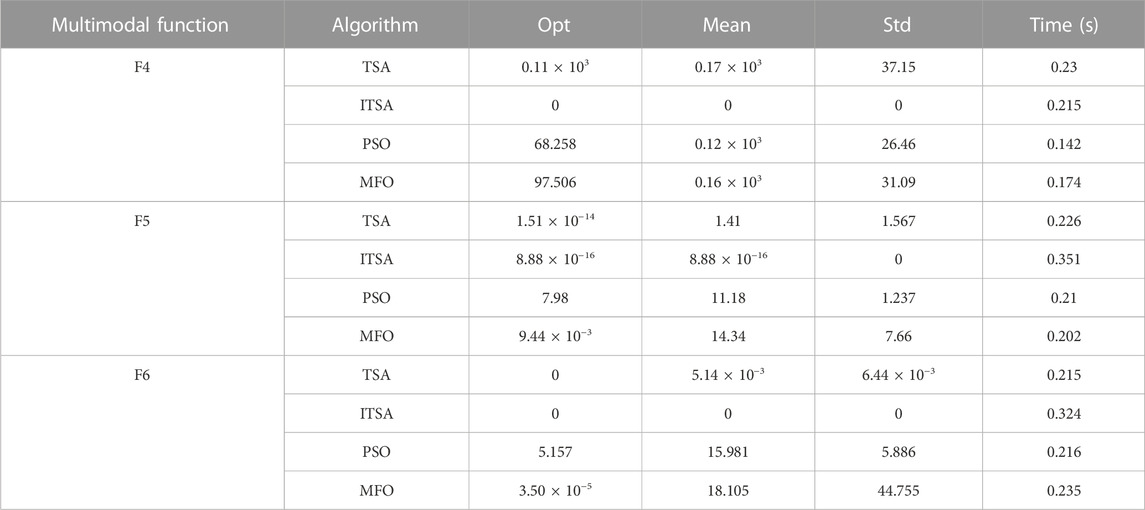
TABLE 4. Statistical results of multimodal function testing.
ITSA achieved the optimal statistical results for both unimodal and multimodal functions based on the aforementioned analysis. This is because the population position initialization method based on the reverse learning mechanism strategy enables the initial population to approximate the current solution better. The search method in the iterative process of the non-linear self-learning factor balance algorithm improves the global development and local mining abilities in the optimization process. Cauchy variation can increase the diversity of individual space and solve the problem of falling into local optima during optimization. Compared to comparative algorithms, ITSA has significant advantages in solving unimodal and multimodal optimization problems. The numerical test results prove the convergence performance of ITSA and its ability to avoid local extremum solutions and verify the effectiveness and progressiveness of the proposed algorithm.
5 Model establishment
5.1 Prediction model based on ITSA-ELM
Equation 20 is defined as the fitness function of ITSA and taken as the objective function of the ITSA-ELM wind power prediction model. The smaller the objective function value, the better the prediction result of the model.
where
The performance evaluation indexes of the prediction model adopted in this study are expressed as follows in equations 21–23 (Liu et al., 2020; Li et al., 2021):
where RMSE is the root mean squared error,
The steps for predicting wind power output based on ITSA-ELM are described as follows.
Step 1: Obtain a dataset related to wind power output.
Step 2: Due to the adverse effects caused by dimensional differences, it is necessary to normalize the preprocessing of output power data, as shown in Eq. 24 (Liu et al., 2021c):
where
Step 3: Divide the dataset into training dataset and prediction dataset according to a certain proportion.
Step 4: Import the training data into the ITSA-ELM model and conduct model training.
Step 5: Determine whether the ITSA-ELM model meets the training standards. If it meets the training standards, proceed to Step 7. If it does not meet the training standards, continue training.
Step 6: The trained ITSA-ELM model uses test data to predict wind power output.
Step 7: Output prediction results based on ITSA-ELM, and evaluate the predicted performance.
The detailed flowchart based on ITSA-ELM is shown in Figure 3.
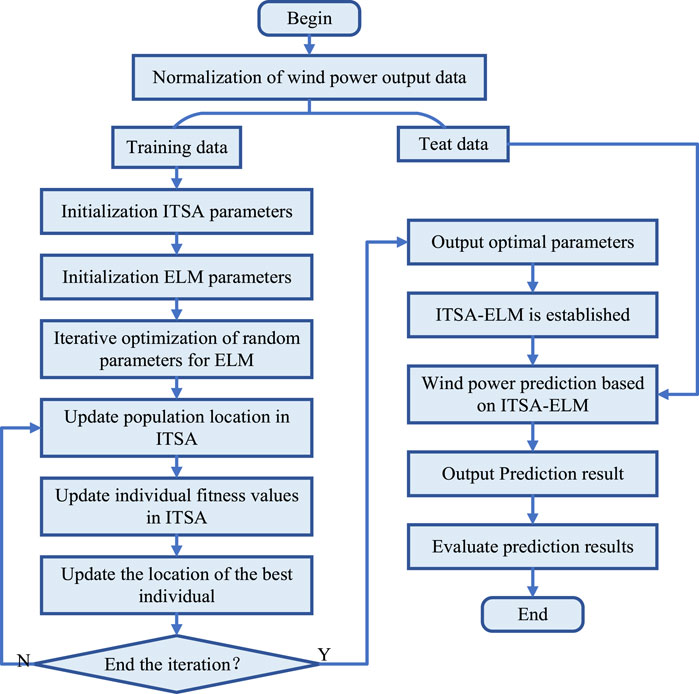
FIGURE 3. Prediction process based on ITSA-ELM.
5.2 Result analysis
This study conducted simulation validation to verify the effectiveness of ITSA-ELM in predicting wind power output. Researchers often use the open wind power dataset provided by the La Haute Borne wind farm in northeastern France to validate predictive models (Li et al., 2020). This study selected output power data from May and December of 2017 as the training and testing sample sets for the model, lasting 8 consecutive days. The data resolution of the power plant is 10 min, which means that the daily wind power dataset includes 144 data points, with a total of 1,152 data points in 8 days. Day 8 is designated as the day to be predicted, resulting in 144 sample points to be predicted.
The wind power actual value is set as the output of ITSA-ELM, and the wind direction and wind speed are the inputs of ITSA-ELM. The ELM (Liu et al., 2021a), kernel-based extreme learning machine (KELM) (Zhou et al., 2022), sparrow search algorithm–extreme learning machine (SSA-ELM) (Li et al., 2021), TSA-ELM, and ITSA-ELM models are selected to compare their prediction performance. The number of hidden layer nodes in ELM is 20. The wind power prediction results of different models in May and December are shown in Figures 4, 5, respectively.
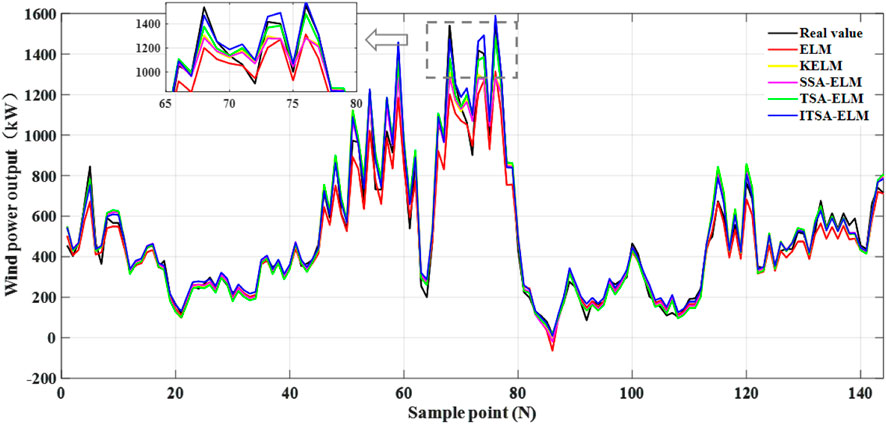
FIGURE 4. Prediction results of different models in May.
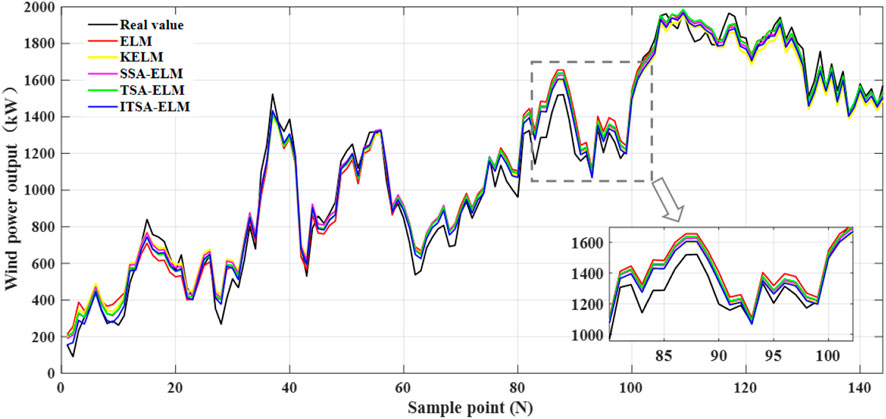
FIGURE 5. Prediction results of different models in December.
Figures 4, 5 show the wind power prediction results of different models. Figure 4 shows that the wind power output fluctuated significantly in May. The wind power output showed an overall upward trend in December in Figure 5. The prediction trends of different prediction models were generally good. By zooming in locally, ELM deviates significantly from the actual curve, indicating that its prediction results are the worst. The prediction curve of ITSA-ELM is closer to the actual output power of wind power and can accurately reflect the changes in the actual value of wind power, indicating that the model has the best prediction effect. Furthermore, Figures 6, 7 show the wind power prediction error curve.
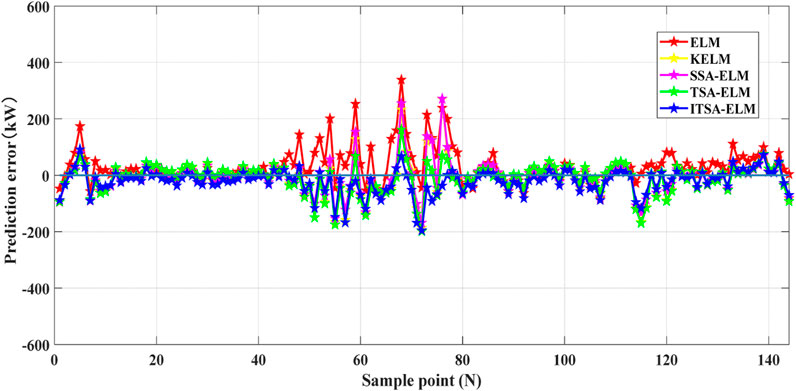
FIGURE 6. Power output prediction error curve in May.
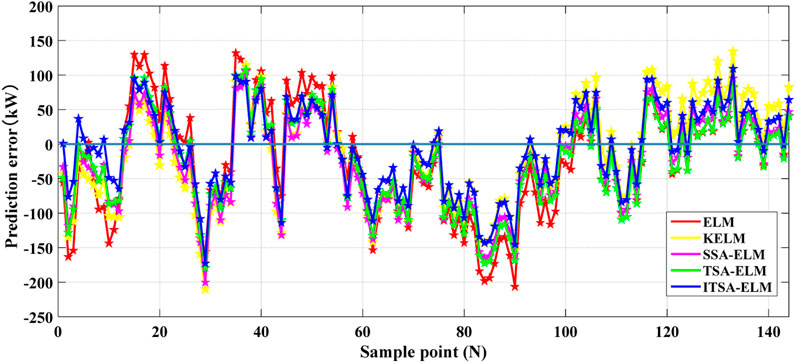
FIGURE 7. Power output prediction error curve in December.
In Figures 6, 7, each method has certain errors in predicting wind power. In May’s wind power prediction, the prediction errors of each method were relatively large at the beginning of sampling, and the error curves of each method had a certain deviation from the 0-error curve, which later became relatively stable. When the number of sampling points is between 45 and 80, the prediction error curves fluctuate significantly, and there is a significant deviation in the predicted results of each method. However, compared to other methods, the prediction error of ELM is greater. From the wind power prediction error figure for the entire month of May, it can be seen that the prediction error curve of the proposed ITSA-ELM is more stable, indicating that this method has a better predictive ability in wind power prediction in May. In the December wind power forecast, the fluctuation of the ELM and KELM prediction error curves is stronger, with the maximum error reaching over 200 kW. Although the prediction error of ITSA-ELM also has strong fluctuations, the fluctuation amplitude is smaller than other methods, indicating that the prediction error of this method is smaller and its ability to characterize wind power is stronger. Figures 8, 9 show the statistical results of the absolute errors of each method in wind power prediction in May and December, respectively.
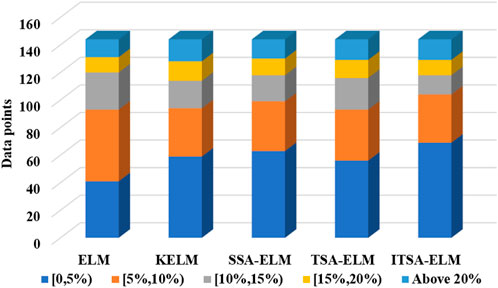
FIGURE 8. Absolute error percentage distribution of May.
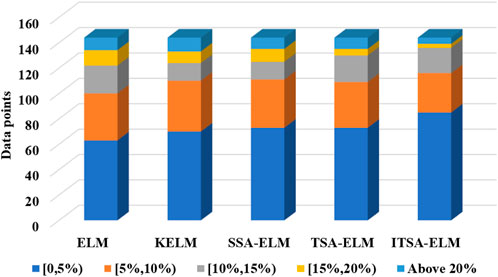
FIGURE 9. Absolute error percentage distribution of December.
From Figures 8, 9, it can be seen that the proposed ITSA-ELM model has more points in the low error range for wind power prediction in May and in December, and there are relatively fewer points with a prediction error above 20% in December. Therefore, compared to other models, ITSA-ELM has smaller prediction errors and a stronger ability to follow wind power changes.
Table 5 shows the evaluation results of each model under three evaluation indicators. The evaluation results of ELM under the three evaluation indicators are not ideal. From those mentioned previously, it can be seen that the wind power prediction error fluctuation of ITSA-ELM is relatively small. Moreover, the wind power prediction results of ITSA-ELM have the highest value of R2 and the lowest value of MAPE and RMSE. The MAPE value of ITSA-ELM showed a decrease of 1.20%, 13.73%, 6.89%, and 32.16%, respectively, compared with TSA-ELM, SSA-ELM, KELM, and ELM in May. The MAPE value of ITSA-ELM showed a decrease of 21.67%, 21.77%, 29.18%, and 36.21%, respectively, compared with TSA-ELM, SSA-ELM, KELM, and ELM in December. This indicates that ITSA-ELM has the smallest deviation in prediction error and the highest prediction accuracy.

TABLE 5. Evaluation of statistical results.
In addition, the RMSE value of ITSA-ELM decreased by 6.54, 10.36, 13.16, and 23.22 kW compared with TSA-ELM, SSA-ELM, KELM, and ELM, respectively, in May. The RMSE value of ITSA-ELM decreased by 9.2, 9.02, 12.8, and 21.05 kW compared with TSA-ELM, SSA-ELM, KELM, and ELM, respectively, in December. It indicates that the difference between the wind power predicted output data on ITSA-ELM and the actual value was the smallest. The prediction result of ITSA-ELM was the most ideal. Compared with other prediction models, ITSA-ELM has the highest value of
The prediction results show that ITSA-ELM established in this study can accurately predict wind power in different months and has strong adaptability to wind power with strong volatility and randomness characteristics.
6 Conclusion and implications
With the large-scale grid connection of renewable energy, the uncertainty and complexity of power system scheduling will significantly increase. Accurate wind power prediction is the most direct way to reduce scheduling uncertainty and complexity. This study proposes a method that can accurately predict wind power output in response to the practical problems the power system faces after wind power is connected to the grid. By combining an intelligent algorithm with a machine learning model, a prediction model based on ITSA-ELM was constructed to characterize the uncertainty of wind power output accurately. The main conclusions are given as follows:
(1) This study proposes ITSA in response to the limitations of TSA, such as being prone to falling into local extremum solutions and weak global convergence performance, which enhances the optimization ability of the algorithm through a reverse learning mechanism, non-linear self-learning factor, and Cauchy mutation strategy.
(2) Due to the ELM random parameters affecting the prediction performance and being difficult to be selected, ITSA was used to optimize ELM for improving its ability to characterize the wind power uncertainty.
(3) The optimization ability of the proposed ITSA was verified using unimodal and multimodal test functions, and the results showed that compared with existing algorithms, the convergence accuracy and stability of ITSA were better.
(4) Two numerical examples validated the ability based on the ITSA-ELM predicted model. The results showed that ITSA-ELM has a better ability to follow the actual wind power changes in different scenarios. Compared with TSA-ELM, SSA-ELM, KELM, and ELM, ITSA-ELM showed a decrease of 1.20%, 13.73%, 6.89%, 32.16%, and 21.67%, 21.77%, 29.18%, and 36.21% of the MAPE value in May and December, respectively.
This study conducted forward-looking and meaningful work. A prediction model that significantly improves the accuracy was proposed to solve the problem of wind power fluctuations and difficulty in prediction. However, it is important to note that this study has certain limitations. Future research can address these limitations by focusing on the following tasks: 1) combining the ITSA-ELM method with practical scheduling problems and conducting more case studies to further validate its effectiveness; and 2) according to the findings of this study, it is recommended to conduct further research on power system scheduling, taking into consideration the specific requirements and challenges of the power system.
However, this study still has limitations. Future research can focus on the following tasks: 1) combining with practical scheduling problems and adopting more case studies to verify ITSA-ELM; 2) based on this study, it is necessary to conduct scheduling research on the power system.
Data availability statement
Publicly available datasets were analyzed in this study. These data can be found at: https://opendata-renewables.engie.com/explore/?sort=modified.
Author contributions
Z-CW: conceptualization, methodology, and writing–original draft. J-CN: conceptualization, methodology, and writing–original draft.
Funding
The author(s) declare that no financial support was received for the research, authorship, and/or publication of this article.
Conflict of interest
The authors declare that the research was conducted in the absence of any commercial or financial relationships that could be construed as a potential conflict of interest.
Publisher’s note
All claims expressed in this article are solely those of the authors and do not necessarily represent those of their affiliated organizations, or those of the publisher, the editors, and the reviewers. Any product that may be evaluated in this article, or claim that may be made by its manufacturer, is not guaranteed or endorsed by the publisher.
References
Abdulrazaq, W. K. A., and Vural, A. M. (2022). Fuzzy fractional-order PID control for PMSG based wind energy conversion system with sparse matrix converter topology. Int. Trans. Electr. Energy Syst. 2022, 1–18. doi:10.1155/2022/3663237
Adnan, R. M., Dai, H. L., Mostafa, R. R., Islam, A. M. T., Kisi, O., Elbeltagi, A., et al. (2023). Application of novel binary optimized machine learning models for monthly streamflow prediction. Appl. Water Sci. 13 (5), 110. doi:10.1007/s13201-023-01913-6
Ai, X. Y., Li, S. J., and Xu, H. X. (2022). Short-term wind speed forecasting based on two-stage preprocessing method, sparrow search algorithm and long short-term memory neural network. Energy Rep. 8, 14997–15010. doi:10.1016/j.egyr.2022.11.051
Catalao, J. P. S., Pousinho, H. M. I., and Mendes, V. M. F. (2011). Hybrid wavelet-PSO-ANFIS approach for short-term wind power forecasting in Portugal. IEEE Trans. Sustain. Energy 2, 50–59. doi:10.1109/TSTE.2010.2076359
Ding, S. F., Zhao, H., Zhang, Y. N., Xu, X. Z., and Nie, R. (2015). Extreme learning machine: algorithm, theory and applications. Artif. Intell. Rev. 44 (1), 103–115. doi:10.1007/s10462-013-9405-z
Ganti, P. K., Naik, H., and Barada, M. K. (2021). Hybrid TSA-RBFNN based approach for MPPT of the solar PV panel under the effects of tilt angles variations and environmental effects. Int. J. Energy Res. 45, 20104–20131. doi:10.1002/er.7089
Gharehchopogh, F. S. (2022). An improved tunicate swarm algorithm with best-random mutation strategy for global optimi-zation problems. J. Bionic Eng. 19 (4), 1177–1202. doi:10.1007/s42235-022-00185-1
Hong, Y. Y., and Santos, J. B. D. (2023). Day-Ahead spatiotemporal wind speed forecasting based on a hybrid model of quantum and residual long short-term memory optimized by particle swarm algorithm. IEEE Syst. J., 1–12. doi:10.1109/JSYST.2023.3265982
Hsu, C. F., Tsai, J. Z., and Chiu, C. J. (2011). Chaos synchronization of nonlinear gyros using self-learning PID control approach. Appl. Soft Comput. 12 (1), 430–439. doi:10.1016/j.asoc.2011.08.027
Hu, C. J., Zhao, Y., Jiang, H., Jiang, M. K., You, F. C., and Liu, Q. (2022). Prediction of ultra-short-term wind power based on CEEMDAN-LSTM-TCN. Energy Rep. 8, 483–492. doi:10.1016/j.egyr.2022.09.171
Jency, W. G., and Judith, J. E. (2022). Homogenized point mutual information and deep quantum reinforced wind power prediction. Int. Trans. Energy Syst. 2022, 1–15. doi:10.1155/2022/3686786
Ji, Y., Dong, H. T., Xing, Z. X., Sun, M. X., Fu, Q., and Liu, D. (2021). Application of the decomposition-prediction-reconstruction framework to medium- and long-term runoff forecasting. Water Supply 21, 696–709. doi:10.2166/ws.2020.337
Jia, Y. B., Wan, C., Cui, W. K., Song, Y. H., and Ju, P. (2023). Peer-to-Peer energy trading using prediction intervals of renew-able energy generation. IEEE Trans. Smart Grid 14, 1454–1465. doi:10.1109/TSG.2022.3168150
Kaur, S., Awasthi, L. K., Sangal, A. L., and Dhiman, G. (2020). Tunicate Swarm Algorithm: a new bio-inspired based metaheu-ristic paradigm for global optimization. Eng. Appl. Artif. Intell. 90, 103541. doi:10.1016/j.engappai.2020.103541
Khare, A., and Rangnekar, S. (2013). A review of particle swarm optimization and its applications in solar photovoltaic system. Appl. Soft Comput. J. 13 (5), 2997–3006. doi:10.1016/j.asoc.2012.11.033
Kommula, B. N., and Kota, V. R. (2022). An integrated converter topology for torque ripple minimization in BLDC motor using an ITSA technique. J. Ambient Intell. Humaniz. Comput. 13, 2289–2308. doi:10.1007/s12652-021-02986-4
Li, J. J., and Wu, Y. H. (2022). Improved sparrow search algorithm with the extreme learning machine and its application for prediction. Neural Process. Lett. 54 (5), 4189–4209. doi:10.1007/s11063-022-10804-x
Li, L. L., Shen, Q., Tseng, M. L., and Luo, S. (2021). Power system hybrid dynamic economic emission dispatch with wind energy based on improved sailfish algorithm. J. Clean. Prod. 316, 128318. doi:10.1016/j.jclepro.2021.128318
Li, L. L., Zhao, X., Tseng, M. L., and Tan, R. R. (2020). Short-term wind power forecasting based on support vector machine with improved dragonfly algorithm. J. Clean. Prod. 242, 118447. doi:10.1016/j.jclepro.2019.118447
Liu, B. Y., Chen, G. L., Lin, H. C., Zhang, W., and Liu, J. (2021c). Prediction of IGBT junction temperature using improved cuckoo search-based extreme learning machine. Microelectron. Reliab. 124, 114267. doi:10.1016/j.microrel.2021.114267
Liu, S., Wang, L., Jiang, H. L., Liu, Y., and You, H. Y. (2022a). Wind farm energy storage system based on cat swarm optimiza-tion-backpropagation neural network wind power prediction. Front. Energy Res. 10, 850295. doi:10.3389/fenrg.2022.850295
Liu, X. F., Luo, H. Y., Yu, D. Y., Tan, J. Y., Yuan, J. F., and Li, H. (2022b). Synthetic biology promotes the capture of CO2 to pro-duce fatty acid derivatives in microbial cell factories. Bioresour. Bioprocess. 9, 124. doi:10.1186/s40643-022-00615-2
Liu, Z. F., Li, L. L., Liu, Y. W., Liu, J. Q., Li, H. Y., and Shen, Q. (2021a). Dynamic economic emission dispatch considering re-newable energy generation: a novel multi-objective optimization approach. Energy 235, 121407. doi:10.1016/j.energy.2021.121407
Liu, Z. F., Li, L. L., Tseng, M. L., and Lim, M. K. (2020). Prediction short-term photovoltaic power using improved chicken swarm optimizer - extreme learning machine model. J. Clean. Prod. 248, 119272. doi:10.1016/j.jclepro.2019.119272
Liu, Z. F., Luo, S. F., Tseng, M. L., Liu, H. M., and Hashan Md Mashud, A. (2021b). Short-term photovoltaic power prediction on modal reconstruction: a novel hybrid model approach. Sustain. Energy Technol. Assessments 45, 101048. doi:10.1016/j.seta.2021.101048
Madupu, H. S., Chinda, P. R., and Kotni, S., (2023). A novel tunicate swarm algorithm for optimal integration of renewable distribution generation in electrical distribution networks considering extreme load growth. J. Electr. Engi-neering Technol. 18, 2709, 2722. doi:10.1007/s42835-023-01388-0
Mirjalili, S. (2015). Moth-flame optimization algorithm: a novel nature-inspired heuristic paradigm. Knowledge-based Syst. 89, 228–249. doi:10.1016/j.knosys.2015.07.006
Mohale, V., and Chelliah, T. R. (2022). Impact of fixed/variable speed hydro, wind, and photovoltaic on sub-synchronous torsional oscillation-A review. Sustainability 15 (1), 113. doi:10.3390/su15010113
Mohammadzadeh, M., Choupani, A. A., and Afshar, F. (2023). The short-term prediction of daily traffic volume for rural roads using shallow and deep learning networks: ANN and LSTM. J. Supercomput. 79, 17475–17494. doi:10.1007/s11227-023-05333-w
Qi, M. H., Gao, H. J., Wang, L. F., Xiang, Y. M., Lv, L., and Liu, J. Y. (2020). Wind power interval forecasting based on adaptive decomposition and probabilistic regularised extreme learning machine. Iet Renew. Power Gener. 14, 3181–3191. doi:10.1049/iet-rpg.2020.0315
Shi, X., Kang, Q., Zhou, M., An, J., and Abusorrah, A. (2021). Novel l1 regularized extreme learning machine for soft-sensing of an industrial process. IEEE Trans. Industrial Inf. 18 (2), 1009–1017. doi:10.1109/TII.2021.3065377
Tastu, J., Pinson, P., Kotwa, E., Madsen, H., and Nielsen, H. A. (2011). Spatio-temporal analysis and modeling of short-term wind power forecast errors. Wind Energy 14, 43–60. doi:10.1002/we.401
Wan, C., Song, Y. H., Xu, Z., Yang, G. Y., and Nielsen, A. H. (2016). Probabilistic wind power forecasting with hybrid artifi-cial neural networks. Electr. Power Components Syst. 44, 1656–1668. doi:10.1080/15325008.2016.1198437
Wan, C., Xu, Z., Pinson, P., Dong, Z. Y., and Wong, K. P. (2014). Probabilistic forecasting of wind power generation using extreme learning machine. IEEE Trans. power Syst. 29 (3), 1033–1044. doi:10.1109/tpwrs.2013.2287871
Wang, J., Alshelahi, A., You, M., Byon, E., and Saigal, R. (2021). Integrative density forecast and uncertainty quantification of wind power generation. IEEE Trans. Sustain. Energy 12 (4), 1864–1875. doi:10.1109/TSTE.2021.3069111
Wei, D. X., Wang, J. Z., Li, Z. W., and Wang, R. (2022). Wind power curve modeling with hybrid copula and grey wolf op-timization. IEEE Trans. Sustain. Energy 13 (1), 265–276. doi:10.1109/TSTE.2021.3109044
Xiong, B. R., Fu, M. Q., Cai, Q. T., Li, X. Y., Lou, L., Ma, H., et al. (2022). Forecasting ultra-short-term wind power by multiview gated recurrent unit neural network. Energy Sci. Eng. 10 (10), 3972–3986. doi:10.1002/ese3.1263
Yakoub, G., Mathew, S., and Leal, J. (2023). Power production forecast for distributed wind energy systems using support vec-tor regression. Energy Sci. Eng. 10 (12), 4662–4673. doi:10.1002/ese3.1295
Yang, M., Dai, B. Z., Wang, J. X., Chen, X. X., Sun, Y., and Li, B. J. (2021). Day-ahead wind power combination forecasting based on corrected numerical weather prediction and entropy method. IET Renew. Power Gener. 15 (7), 1358–1368. doi:10.1049/rpg2.12053
Ying, C. T., Wang, W. Q., Yu, J., Li, Q., Yu, D. H., and Liu, J. H. (2023). Deep learning for renewable energy forecasting: a tax-onomy, and systematic literature review. J. Clean. Prod. 384, 135414. doi:10.1016/j.jclepro.2022.135414
Yu, G. Z., Liu, C. Q., Tang, B., Chen, R. S., Lu, L., Cui, C. Y., et al. (2022). Short term wind power prediction for regional wind farms based on spatial-temporal characteristic distribution. Renew. Energy 199, 599–612. doi:10.1016/j.renene.2022.08.142
Yuan, C., Tang, Y., Mei, R., Mo, F., and Wang, H. (2021). A pso-lstm model of offshore wind power forecast considering the variation of wind speed in second-level time scale. Math. Problems Eng. 2021, 1–9. doi:10.1155/2021/2009062
Zhang, J., Liu, D., Li, Z., Han, X., Xia, Y., Dong, C., et al. (2021). Power prediction of a wind farm cluster based on spatiotemporal correla-tions. Appl. Energy 302 (2), 117568. doi:10.1016/j.apenergy.2021.117568
Zhao, J., Wang, J. Z., and Liu, F., (2016). Multistep forecasting for short-term wind speed using an optimized extreme learn-ing machine network with decomposition-based signal filtering. J. Energy Eng., 142(3)0000291. doi:10.1061/(ASCE)EY.1943-7897.0000291
Zhou, M. R., Zhu, Z. W., Hu, F., Bian, K., Lai, W. H., and Hu, T. Y. (2022). Short-term commercial load forecasting based on peak-valley features with the TSA-ELM model. Energy Sci. Eng. 10 (8), 2622–2636. doi:10.1002/ese3.1203
Zhou, Q., Ma, Y. H., Lv, Q. Q., Zhang, R. X., Wang, W., and Yang, S. Y. (2022). Short-term interval prediction of wind power based on KELM and a universal tabu search algorithm. Sustainability 14 (7), 10779. doi:10.3390/su141710779
Zhu, W. Z., (2023). Synergetic scheduling energy and reserve of wind farms for power systems with high-share wind power. J. Energy Eng., 149(2). doi:10.1061/JLEED9.EYENG-4711
Zhu, Y., Zhang, Y. A., and Wei, Z. N. (2023). Hierarchical cluster coordination control strategy for large-scale wind power based on model predictive control and improved multi-time-scale active power dispatching. J. Mod. Power Syst. Clean Energy 11, 827–839. doi:10.35833/MPCE.2022.000010
Zhuang, W. N., Pan, G. S., Gu, W., Zhou, S. Y., Hu, Q. R., Gu, Z. F., et al. (2023). Hydrogen economy driven by offshore wind in regional comprehensive economic partnership members. Energy & Environ. Sci. 16, 2014–2029. doi:10.1039/D2EE02332F
Zishan, F., Mansouri, S., Abdollahpour, F., Grisales-Norena, L. F., and Montoya, O. D. (2023). Allocation of renewable energy resources in distribution systems while considering the uncertainty of wind and solar resources via the multi-objective salp swarm algorithm. Energies 16 (1), 474. doi:10.3390/en16010474
Zong, W. W., Huang, G. B., and Chen, Y. Q. (2013). Weighted extreme learning machine for imbalance learning. Neurocomputing 101, 229–242. doi:10.1016/j.neucom.2012.08.010
Keywords: wind power, accurate prediction, improved tunicate swarm algorithm, extreme learning machine, new energy power generation system
Citation: Wang Z-C and Niu J-C (2023) Wind power output prediction: a comparative study of extreme learning machine. Front. Energy Res. 11:1267275. doi: 10.3389/fenrg.2023.1267275
Received: 26 July 2023; Accepted: 09 November 2023;
Published: 30 November 2023.
Edited by:
Bilal Taghezouit, Renewable Energy Development Center, AlgeriaReviewed by:
Ling-Ling Li, Hebei University of Technology, ChinaElyes Garoudja, Center for Development of Advanced Technologies (CDTA), Algeria
Copyright © 2023 Wang and Niu. This is an open-access article distributed under the terms of the Creative Commons Attribution License (CC BY). The use, distribution or reproduction in other forums is permitted, provided the original author(s) and the copyright owner(s) are credited and that the original publication in this journal is cited, in accordance with accepted academic practice. No use, distribution or reproduction is permitted which does not comply with these terms.
*Correspondence: Jin-Cai Niu, bmpjMDcxMUAxNjMuY29t