 Lingyu Liang1
 Xiangyu Zhao
 Fengsheng Chen
- 1Digital Grid Research Institute of China Southern Power Grid, Guangzhou, China
- 2Guangzhou Shuimu Qinghua Technology Co., Ltd., Guangzhou, China
- 3College of Electric Power, South China University of Technology, Guangzhou, China
A microgrid is a promising small-scale power generation and distribution system. The selling prices of wind turbine equipment (WT), photovoltaic generation equipment (PV), and battery energy storage equipment (BES) have a significant impact on microgrid profits, which, in turn, affects the planning capacity of renewable energy. However, existing research has not yet conducted in-depth modeling and analysis for different kinds of energy generation electricity prices. This paper proposes an optimal capacity planning method for wind-photovoltaic-storage equipment, considering different energy selling incomes in microgrids. Stochastic characteristics of renewable energy (WT and PV), selling prices of different types of energy, and timing coupling characteristic are considered in the proposed model. In addition, the configuration capacities of WT, PV, and BES are modeled as discrete decision variables, according to the type of specific equipment. The comprehensive life cycle cost (LCC) is considered an objective function. It can be found that the proposed collaborative capacity planning model is a mathematical programming problem with complex nonlinear constraints and integer variables. To solve this problem, a cultural gray wolf optimization algorithm (CGWO) is applied in this paper. The proposed method’s efficiency, convergence, superiority, and effectiveness are verified through a case study. Moreover, the impact of different new energy sales prices on capacity planning results is also revealed in the article.
1 Introduction
1.1 Background
Global climate change has brought severe challenges to human survival. In the face of these challenges, China has put forward the “carbon emissions peak” and “carbon neutrality” policies (Wang Jiayu et al., 2022). The proposed policies insist on green and low-carbon development, tackling climate change actively. In this context, a novel power system with renewable energy is proposed as the main body of future power systems. Nowadays, Chinese clean energies mainly contain wind and photovoltaic power generation, which are the most practical approaches and show great development potential.
In rural areas, industrial parks, or islands, there are often many distributed photovoltaic (PV) panels, wind turbines (WTs), and battery energy storage equipment (BES), which constitute a “microgrid” (Wei et al., 2014). In areas with abundant wind energy and light resources, how to optimize the capacity of different energy equipment in the microgrid, improving the economic profits, enhancing the reliability of the designed microgrid, and increasing the accommodation rate of clean energy, is a crucial but complicated problem (Wang et al., 2022b; Singh and Sharma, 2017).
1.2 Related work
Scholars around the world conducted research on the location and capacity of distributed generation (DG) in microgrids from different perspectives. Recent research studies can be summarized from model formulation and algorithms, as shown in Table 1.
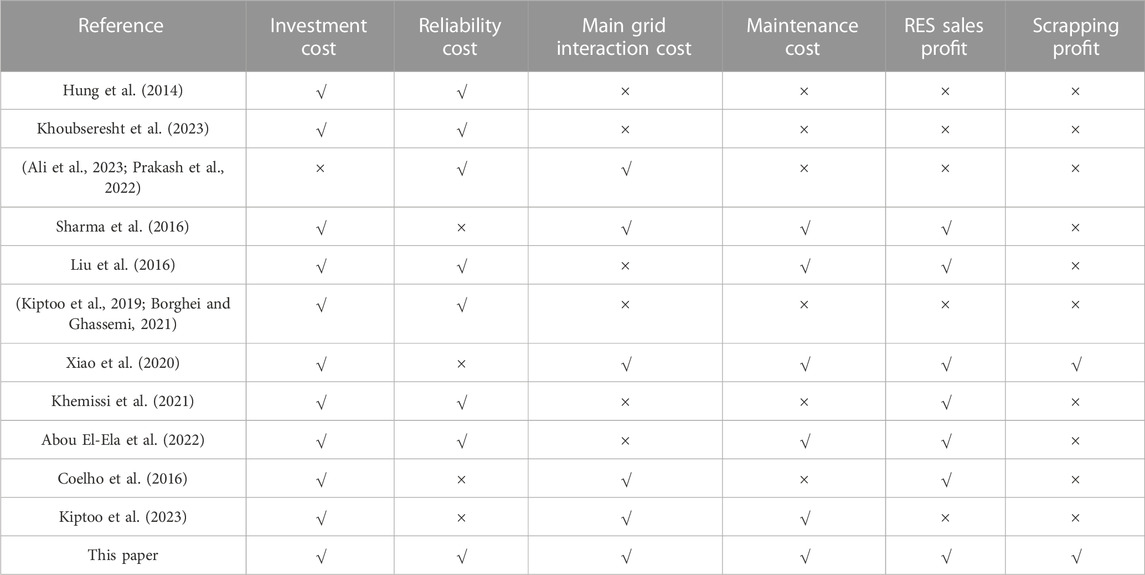
TABLE 1. Summary of distributed generator planning models.
1.2.1 Model formulation
The objective of a microgrid capacity planning model needs to consider economy, reliability, and environment protection (Kiptoo et al., 2023). Economic objectives mainly include costs (annual investment cost, maintenance cost, main grid electricity purchase cost, equipment operation cost, etc.) and profits (main grid electricity selling profits, environmental subsidies, etc.) (Yang et al., 2020a). Reliability objectives include time-based indicators (SAIDI and CAIDI), frequency-based indicators (SAIFI and CAIFI), and energy loss-based indicators (EENS). Environment objectives are related to emissions of greenhouse gases, which depend on the output of traditional thermal power and renewable energy accommodation (Wang et al., 2022c). The constraints of a microgrid capacity planning model should consider the power flow equation and operation mode. It can be found that the capacity configuration of a microgrid is a nonlinear, multi-objective problem with complicated constraints (Singh and Sharma, 2017).
A cost-based formulation was performed to determine the optimal size of BES in the operation cost minimization problem of a MG under various constraints, such as the power capacity of distributed generators (DGs), power and energy capacity of BES, charge/discharge efficiency of BES, operating reserve, and load demand satisfaction (Sharma et al., 2016; Liu et al., 2016), focused on optimization of the power source capacity in the microgrid. In addition, a coordinated planning strategy is proposed with an integrated consideration of the characteristics of DG, ES, and load. Kiptoo et al. (2019) investigated the prospects of interlinking a short-term flexibility value into long-term capacity planning toward achieving a microgrid with a high renewable energy fraction. A pumped storage power station capacity planning method based on the full life cycle cost was proposed to describe a new sizing optimization methodology of a stand-alone hybrid photovoltaic/wind/battery system, minimizing the levelized cost of energy (LCOE), the loss of power supply probability (LPSP), and the equivalent carbon dioxide (CO2-eq) life cycle emission (Xiao et al., 2020). However, few studies have analyzed the impact of price (cost and profit) on the capacity allocation of a microgrid and carried out in-depth sensitivity analysis based on the proposed model, providing effective guidance for microgrid planners.
1.2.2 Algorithm
Existing solving algorithms of capacity configuration in a microgrid mainly include traditional analytical mathematical algorithms and heuristic optimization algorithms (Abou El-Ela et al., 2022). Some researchers tried to reformulate the original problem into a typical mixed-integer linear programming (MILP) with some approximate techniques (Borghei and Ghassemi, 2021; Kiptoo et al., 2023). Although these kinds of methods can obtain the optimal solution to the transformed problem, the obtained solution may have large deviations from practical solutions due to the approximation. Furthermore, these algorithms cannot accommodate to various scenarios, hindering their application in practical engineering. On the other hand, heuristic optimization algorithms can solve these complicated planning problems effectively. However, the selection and improvement of heuristic algorithms based on the variable form and constraint space of the specific problem is an urgent and promising research area (Coelho et al., 2016; Yang et al., 2020b).
1.3 Main purpose
From the aforementioned literature review, it can be found that existing research has not yet conducted in-depth modeling and analysis for different kinds of energy generation electricity prices, given that a significant portion of the revenue from microgrid operators comes from the selling income of renewable energy. In addition, the selling prices of different types of renewable energy are different, while existing research studies have not yet modeled, solved, and analyzed the differences in selling prices of different types of new energy. Microgrid planners or electricity market price setters also require corresponding theoretical basis and guidance when carrying out microgrid planning or setting electricity prices. Thus, it is necessary to model the differences in the selling prices of different types of renewable energy and integrate them into the microgrid planning model.
1.4 Main contribution
To tackle the aforementioned issues, this paper proposes a novel microgrid capacity planning model and an improved cultural gray wolf optimization algorithm. The major contributions of this paper can be summarized as follows:
(1) Novel microgrid capacity planning model. A novel wind-photovoltaic-storage microgrid capacity planning model considering comprehensive cost and profits is put forward. The different selling prices of WT, PV, and BES are considered in the paper, which is essential for the planning model.
(2) Improved cultural gray wolf optimization (CGWO) algorithm. An improved cultural gray wolf optimization algorithm (CGWO) is proposed to solve this problem efficiently. Compared with other heuristic optimization methods, the proposed method outperforms in convergence and calculation time when solving the proposed model.
(3) Impact of different energy sale prices and investment costs. The influence of different selling prices of WT, PV, and BES, and the investment cost of BES on the microgrid planning scheme is analyzed. The proposed model mainly focuses on the impact of the change in the electricity selling price on the planning results, which is conducive to microgrid planners to analyze the feasibility of the planning scheme from a new perspective.
1.5 Structure
The remainder of this paper is organized as follows: In Section 2, the overall architecture of collaborative capacity planning in a microgrid is presented. In Section 3, a capacity planning model of WT, PV, and BES in the microgrid is established. In Section 4, the solution algorithm CGWO is introduced. Subsequently, the testing of the proposed methods and the sensitivity study are presented in Section 5. Finally, conclusions and practical suggestions are summarized in Section 6.
2 Optimal capacity planning model of wind-photovoltaic-storage equipment in a microgrid
2.1 Architecture of collaborative capacity planning in a microgrid
Future smart DS will include various types of novel loads and DGs, including wind WT, PV, BES, and user load. From the perspective of optimal planning, DS planners should coordinate reliability and DS costs through an optimal design of the equipment capacity to accommodate these loads and DGs. Figure 1 shows the planning task of capacity planning in a microgrid.
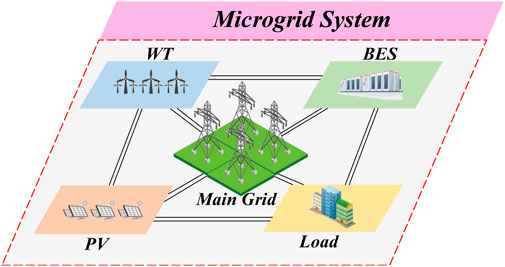
FIGURE 1. Framework of collaborative capacity planning in a microgrid.
The total objective function F of capacity planning of wind and solar storage equipment in the microgrid is formulated as follows.
where F represents the comprehensive cost of the designed microgrid system. The objective function of this paper is to minimize the comprehensive cost of wind-photovoltaic-storage equipment in the microgrid system, which contains cost and profits. The cost of the capacity planning model includes the cost of equipment investment in the microgrid (WT, PV, and BES) CInv, cost of expected energy not supplied (EENS) CEENS, cost of electricity purchased from the main grid CBuy, and cost of equipment maintenance CMain. In addition, the profits of the designed microgrid system are composed of the profits obtained from selling electricity ISell and the scrapping of equipment IDrop.
2.2 Annualized cost of investment
In the process of microgrid planning, the investment and construction cost of each piece of equipment (WT, PV, and BES in this paper) occupies an important part, which is shown as follows:
where
2.3 Annual cost of outage compensation
If a power outage occurs due to insufficient power supply, the microgrid operator needs to compensate the corresponding users. In the planning and design of a high-reliability microgrid, it is necessary to consider the annual outage compensation cost of the microgrid, which can be written as follows:
where the annual outage compensation cost of planned equipment CEENS is related to the annual shortage of power supply EENS and power outage cost coefficient kEENS. Based on the power balance equation, the unbalanced power
2.4 Annual cost of electricity purchased from the main grid
If the wind and solar storage resources are insufficient, the microgrid needs to purchase electricity from the main network to meet the load demand of the whole microgrid. The annual cost calculation formula of purchasing electricity from the main network is as follows:
where the annual cost of power purchase of the main grid CBuy is related to the power obtained through the tie line/main grid
2.5 Annual cost of equipment maintenance
The equipment invested and built by the microgrid needs to be operated and maintained in its life cycle. The specific calculation formula of the cost required for this part is as follows:
where
2.6 Annual profit of electricity sales
The microgrid can exchange energy with the main grid through the main grid bus, which can gain profits if the microgrid has extra power. The calculation formula of annual electricity sales income ISell of the microgrid, including the wind-photovoltaic-storage, is mainly composed of electricity sales income of wind power, photovoltaic, and battery energy storage.
where
To calculate the wind selling power at each time, it is necessary to calculate the wind power PW t.
where
The calculation of solar power PS t is formulated as follows:
where
The renewable energy modeling in this paper considers the wind speed and irradiance in the planning area, establishes a mathematical relationship between wind or solar resources and power output under a given new energy installation capacity, and combines typical power output curves of wind and solar energy to construct a scenario-based modeling method.
This paper assumes that renewable energy is preferentially consumed in the system. Therefore, the power shortage at the current time ΔPt can be expressed as follows.
It can be found that if ΔPt is greater than or equal to 0, indicating that the current wind power generation power
SOCt is the remaining capacity of the energy storage equipment at the current time, which is related to the capacity of the energy storage equipment. The minimum value of SOCt is 30% of the planned capacity of BES. The maximum value of SOCt is the value corresponding to the planned capacity of BES. In particular, the remaining capacity of the energy storage device needs to be limited between the maximum and minimum values of the remaining capacity.
where SOCt at the current time is the SOC at the previous time t-1 plus the charge/discharge power at the previous time. Then, the charge/discharge power of battery energy storage is expressed by the following formula.
If the SOC at the current moment is larger than the SOC at the previous moment, the BES in the microgrid is in discharge and sells power to the main grid. Conversely, if the SOC at the current moment is larger than the SOC at the previous moment, the BES in the microgrid is in charge.
where
Combined with the power margin and the maximum consumable power calculated previously, the actual sales power of WT and PV can be calculated, which are shown as follows:
Therefore, when the residual power margin is less than 0, WT and PV power are the actual output power. If the power margin is greater than 0, WT and PV power can only be consumed proportionally.
2.7 Annual profit of equipment scrapping
Another part of the income of the wind-photovoltaic-storage microgrid comes from the scrapping income of wind-photovoltaic-storage equipment, and the specific calculation formula is as follows:
where the annual scrapping income of planned equipment consists of the scrapping income of WT
3 Improvement in the cultural gray wolf optimization algorithm
The aforementioned problem is a planning model with complicated constraints and variables. It contains a large number of logical judgment constraints, which is intractable to most mathematical solvers. Furthermore, the traditional optimization algorithm has slow convergence speed. In addition, traditional mathematical optimization methods, such as branching-and-cut or cutting plane methods, need to approximate the non-convex and nonlinear parts, transforming the model into a tractable form of MILP. Although the precise solution of the model can be obtained, there is still some deviation between the transformed model and the original model. In this situation, the advantages of the heuristic optimization algorithm are more prominent.
This paper improves the GWO algorithm (Mirjalili and Seyed Mohammad Mirjalilib, 2014) and proposes an improved CGWO algorithm, which is suitable for the capacity planning model of wind-photovoltaic-storage equipment in the microgrid. The proposed CGWO algorithm enhances the gray wolf optimization method to effectively solve the capacity planning problem and optimize the performance of wind-photovoltaic-storage equipment in microgrids.
A traditional GWO algorithm is based on the classification of wolves. The weight of wolves with a high level is higher, and the weight of wolves with a low level is lower. The search range and target of different wolves are different. Finally, the search information on different wolves is summarized and synthesized, and the optimal search mode of the whole wolves is given. The framework of this algorithm is presented in Figure 2. With the iteration, the search range is continuously narrowed to achieve the optimal position. However, the iterative update mode of the traditional gray wolf optimization algorithm in the evolution process adopts the linear decreasing strategy to shrink, and the convergence factor calculation formula of the traditional gray wolf algorithm is as follows:
where a is the convergence factor, l is the current iterative algebra, and T is the total number of evolutionary iterations.
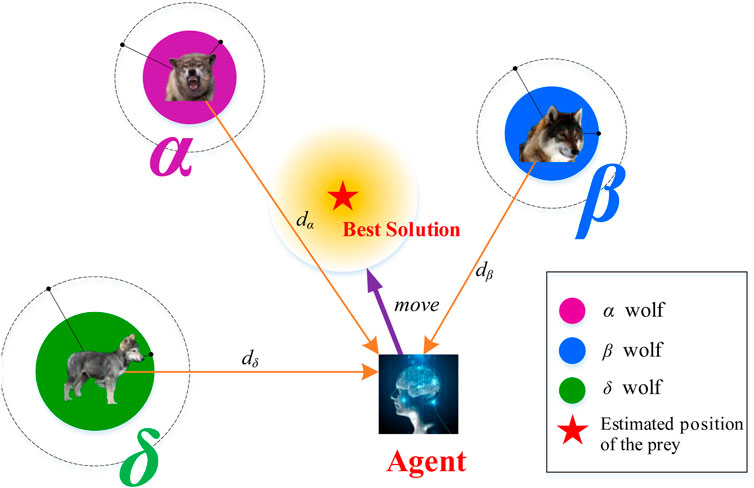
FIGURE 2. Framework of gray wolf optimization (GWO).
Inspired by particle swarm optimization, slowing down the convergence rate of the convergence factor can enhance its global search ability and prevent the algorithm from falling into the local optimal solution. Therefore, to improve the global performance of algorithm contraction, this paper proposes a new convergence factor updating method based on exponential law change:
The convergence factor a will decrease in the form of a negative exponent, and its decreasing speed is lower than that of the linear decreasing strategy.
Second, to better carry out the global search and consider the performance of local utilization (the basic idea of the greedy algorithm), this paper proposes an adaptive search strategy, which makes the algorithm still attach importance to the role of the first wolf (α wolf), but at the same time, it does not take the average value of the positions of the three wolves. The specific expression is as follows:
where X1 is the position of the α wolf, X2 is the position of the β wolf, and X3 is the position of γ wolf, which indicates the central position of the population after evolving from the previous generation to the next generation.
In addition, a better initial solution can significantly improve the initial search performance. Therefore, this paper is inspired by the cultural gene optimization algorithm to give full play to the global search performance of the genetic algorithm (GA). Before starting iteration, the initial solution is generated blindly and randomly. First, the high-quality initial solution is obtained based on GA, and then, the evolutionary iteration is carried out based on the gray wolf optimization algorithm.
The steps of the improved gray wolf optimization algorithm are summarized, as shown in Figure 3.
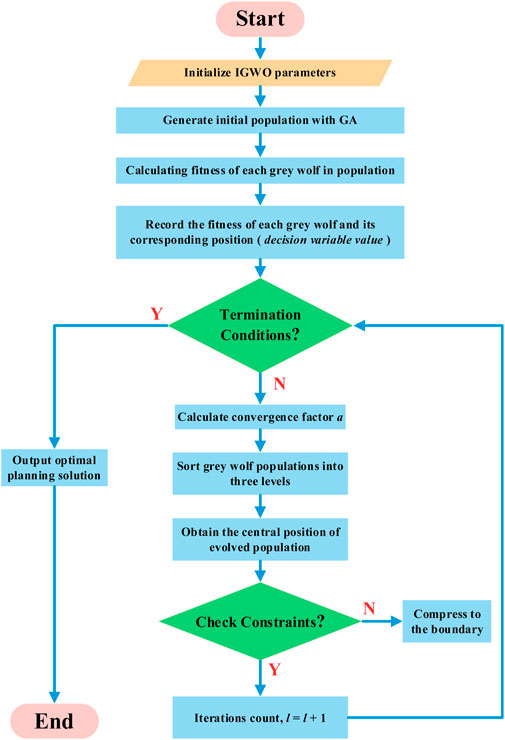
FIGURE 3. Framework of cultural gray wolf optimization (CGWO). (i) Initializing CGWO parameters, including the population number N and total iteration times T. (ii) Giving full play to the global optimization ability of GA, the initial solution is obtained by a genetic principle, and the initial gray wolf population is generated. (iii) Calculating the fitness function of each level of gray wolf in the population. For the calculation of fitness function in this paper, refer to the objective function of the optimal capacity planning model of wind and solar storage equipment in the microgrid, which is presented in Eq. 1. After the calculation, the fitness function of different gray wolves and its corresponding position (the value of decision variables) were recorded. (iv) Judging whether the condition of algorithm termination is met. For example, whether the algebra of convergence iteration is reached or not, the optimal solution does not change in K iterations. If the termination condition is satisfied, the optimal solution of the cycle output is proposed, and the optimal capacity planning scheme of wind-photovoltaic-storage equipment in the microgrid is obtained; otherwise, step (v) is performed. (v) The convergence factor a is calculated according to Eq. 24. (vi) The gray wolf population was sorted, and the gray wolf level was divided into three levels. (vii) The center position of the evolved population is obtained based on Formula 25, and it is checked whether the center position of the new population violates the relevant constraints of the model. If the constraint is violated, it is compressed to the boundary. (viii) The number of iterations plus 1, that is, l = l+1, return to step (iv).
4 Case study
The following will be combined with the actual solution example for analysis, based on MatlabR 2020a. The processor parameter of the computer is Intel(R) Core(TM) i7-8565U CPU @ 1.80 GHz, 1.99 GHz.
4.1 Model parameter description
This paper takes a microgrid as a simulation example. Then, 8,760 h of the actual load demand in the microgrid, the wind speed, and the light intensity of the microgrid in a year for this area are collected and uploaded in Liang et al. (2023).
4.2 Algorithm parameter setting
Before solving the model based on the heuristic/meta-heuristic optimization algorithm, it is necessary to set the memory of each parameter involved in each algorithm. In order to ensure the comparability of the algorithms, each heuristic optimization algorithm sets the same parameters in the population number and iteration times, and other algorithms determine the optimal parameter settings according to the grid search method (Bergh and Engelbrecht, 2003; Baker and Ayechew, 2003). The specific parameter settings of each algorithm are shown in Table 2; Table 3; Table 4; Table 5; Table 6.
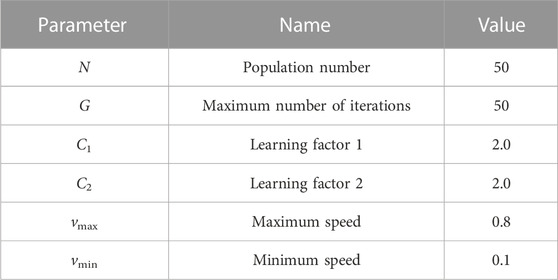
TABLE 2. Parameter setting of particle swarm optimization (PSO).

TABLE 3. Parameter setting of the genetic algorithm (GA).
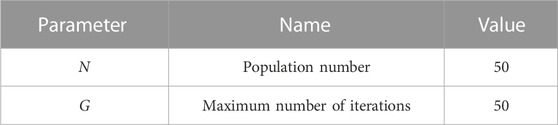
TABLE 4. Parameter setting of the whale optimization algorithm (WOA).

TABLE 5. Parameter setting of the gray wolf optimization algorithm (GWO).
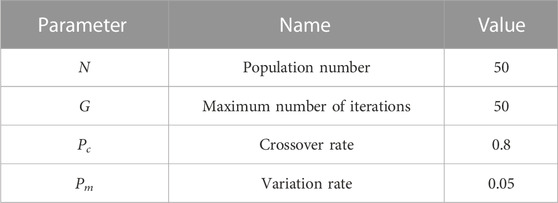
TABLE 6. Parameter setting of the improved cultural gray wolf optimization algorithm (CGWO).
4.3 Comparison of different optimization algorithms
To verify the convergence and convergence speed of the improved CGWO algorithm proposed in this paper, it is compared with PSO (Prakash et al., 2022), GA (Wang et al., 2022c, WOA (Singh and Sharma, 2017), and GWO algorithms (Ali et al., 2023). The convergence curves and convergence times of different algorithms are shown in Figure 4; Figure 5.

FIGURE 4. Convergence curves of different optimization algorithms.
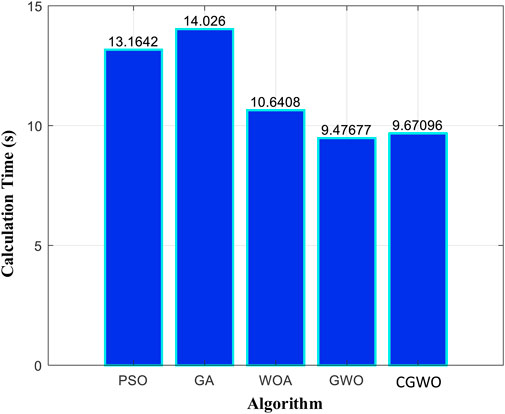
FIGURE 5. Calculation time of different algorithms.
By using MATLAB, CGWO can converge to the optimal value of -1.1908 * 106 yuan at a faster speed. To verify the optimality of the convergence objective, this paper increases the number of population searches and iterations of other heuristic optimization algorithms and finally converges to the same objective function value. Therefore, it can be considered that the convergence value is the optimal objective function value of the wind-photovoltaic-storage microgrid planning model, and the specific decision variables obtained by the convergence of different algorithms are 395.8956, 397.6725, and 864.0066. The calculation time of different algorithms can be completed within 15 s, the solution efficiency can meet the requirements of planners for planning and design, and the efficiency is much higher than that of the manual scheme design and index comparison.
In this case study, the performance of several optimization algorithms to solve the planning model is compared. The key findings are as follows:
(1) PSO produced average initial solutions, eventually converging to a local optimal solution. PSO’s optimization time was moderate, but its performance was sensitive to parameter settings, making it less adaptable and robust.
(2) GA had poor initial solutions and convergence speed, but its diverse and global solutions made it a valuable component of the improved GWO, which combined GA with the stable and powerful optimization performance of GWO.
(3) WOA had better convergence and shorter calculation times compared to PSO. It is a meta-heuristic algorithm that is easier to apply and understand than PSO.
(4) CGWO outperformed all other algorithms in convergence speed and actual calculation time. Its combination of cultural genes enabled high-quality solutions to evolve and converge quickly.
To further verify the convergence of the algorithm, different optimization algorithms were repeated 20 times, and the curves were plotted in a boxplot, as shown in Figure 6. It can be found that CGWO has the best convergence, both in terms of the fluctuation of the boxplot (length of the boxplot) and the mean value of the boxplot, which are superior to other algorithms. Therefore, it can be concluded that the algorithm proposed in this paper has better convergence compared to other optimization algorithms.
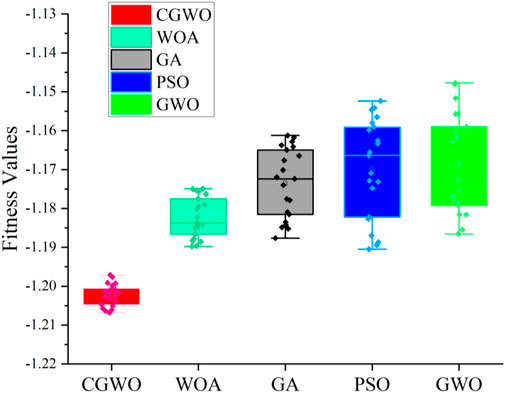
FIGURE 6. Box diagram of convergence values for different optimization algorithms.
4.4 Sensitivity analysis of the model
4.4.1 Electricity price sensitivity analysis of different types of generators
4.4.1.1 Sensitivity analysis of wind power selling prices
The sensitivity analysis of different wind power sales prices is performed and shown in Figure 7. A sensitivity analysis was conducted on wind power sales prices by multiplying the reference price with corresponding electricity price coefficients ranging from 0.5 to 1.5 in increments of 0.05.
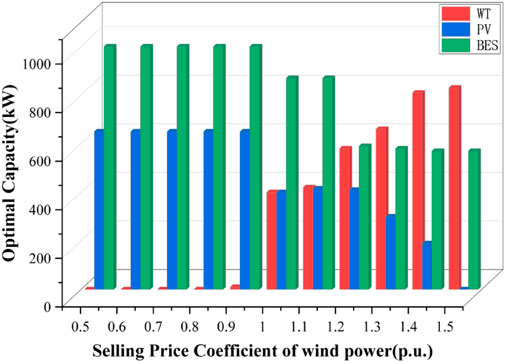
FIGURE 7. Optimal equipment capacity for different wind power selling prices.
Based on the findings presented in Figure 7, it can be inferred that an increase in the selling price of wind power will lead to an increase in the planned capacity of wind power equipment. When the electricity price coefficient exceeds 1 p. u., the planned capacity of wind power equipment increases, while the planned capacity of photovoltaic and energy storage equipment decreases. However, due to the ability of energy storage to smooth fluctuations, a certain capacity of energy storage equipment is still necessary.
4.4.1.2 Sensitivity analysis of solar power selling prices
The sensitivity analysis of different selling prices of photovoltaic power generation is performed, and the results are shown in Figure 8.
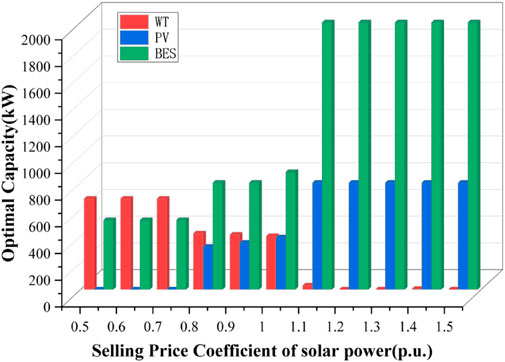
FIGURE 8. Optimal equipment capacity for different solar power sale prices.
When revenue from photovoltaic electricity sales increases, it often leads to an increase in the construction of photovoltaic equipment. However, if the revenue from photovoltaic electricity sales continues to remain high, it may result in a decrease in the construction of wind power equipment and an increase in the construction of energy storage equipment. This is because high revenue from photovoltaic electricity sales may make wind power projects less financially attractive, and energy storage equipment becomes more important to balance the intermittency of renewable energy sources, such as wind and solar energy. Therefore, it is important to consider the overall energy mix and the balance between different renewable energy sources and energy storage technologies to ensure a sustainable and reliable energy system.
4.4.1.3 Sensitivity analysis of storage power selling prices
The sensitivity analysis is conducted on the selling price of different energy storage power generation, and the results are shown in Figure 9.
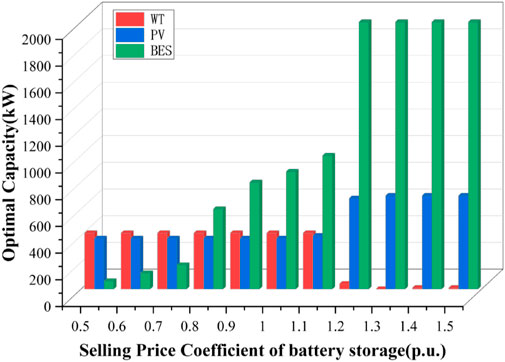
FIGURE 9. Optimal equipment capacity for different battery storage power selling prices.
When the revenue generated by selling electricity from energy storage equipment increases, it incentivizes the expansion of the energy storage construction capacity. However, as the cost of selling electricity from energy storage equipment increases to a certain level, it may become more expensive to rely solely on energy storage to meet the load power demand. At this point, there may be an increased incentive to expand the construction capacity of photovoltaic equipment to help supplement the energy supply and lower costs.
4.4.2 Sensitivity analysis of the BES investment cost
The sensitivity analysis of investment and construction costs of different energy storage equipment is performed, and the results are shown in Figure 10.
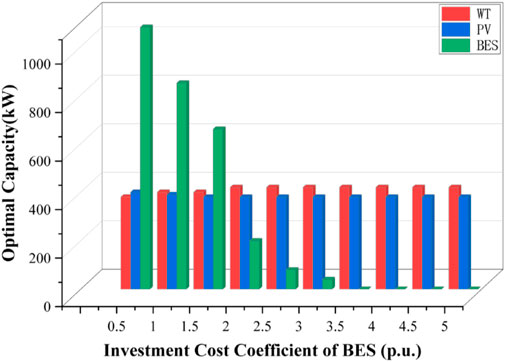
FIGURE 10. Optimal equipment capacity of different energy storage equipment investment construction cost.
Figure 10 demonstrates that a decrease in the investment cost of energy storage equipment results in a significant increase in its optimal planning capacity. This is because energy storage plays a vital role in stabilizing power fluctuations within a microgrid. As such, a reduction in the construction cost of energy storage equipment incentivizes its greater utilization and expansion within the system.
4.4.3 Discussion on the costs and benefits
Through sensitivity analysis, the costs and benefits of different types of renewable energy on the planning results can be summarized as follows:
① With the increase in the WT selling price, the WT installation capacity increases. In comparison to PV selling prices, the advantage of WT will squeeze out some of the PV installation capacity. However, due to the greater uncertainty of WT fluctuations compared to PV, the WT installation capacity rapidly decreases when the selling price is below 1 p. u.
② With the increase in the PV selling price, the PV capacity increases to a certain extent, but after reaching a certain point, PV also needs some energy storage support and will not increase further. In comparison to WT selling prices, the advantage of PV will squeeze out some of the WT installation capacity. Since the output of PV is relatively regular (high radiation intensity at noon and low radiation intensity at other times), the PV installation capacity is replaced by the WT installation capacity only when the price is below 0.8 p. u.
③ BES plays an important role in suppressing the volatility and uncertainty of wind and solar energy. Therefore, when the electricity price for energy storage and sales decreases, it is necessary to retain a certain degree of installed energy storage capacity to promote the consumption of wind and solar resources. When the electricity price for energy storage and sales increases, the efficient combination of energy storage and photovoltaic will show “bundled growth.”
5 Discussion and limitations
5.1 Advantages and disadvantages of the proposed method
The advantages of the proposed method for considering the selling income of renewable energy in microgrid capacity planning are summarized as follows:
(1) One of the key advantages of the proposed approach is its ability to capture the impact of varying electricity prices on microgrid capacity. By incorporating dynamic pricing models, different scenarios and the capacity planning solution can be obtained and analyzed. This allows microgrid operators to make more informed decisions and maximize their revenue potential.
(2) Another advantage is that the proposed method considers distributed power generation, which aligns with the growing trend of renewable energy integration in microgrids. By incorporating the revenue from selling excess power back to the grid, the deployment of DGs is incentivized.
(3) The proposed optimization algorithm is stable and has good convergence effect. Compared with traditional mathematical methods, such as branch-and-cut or cutting plane methods, the proposed algorithm can be applied easily to provide several satisfactory solutions for planners to select.
However, certain limitations are summarized as follows.
(1) Real-time volatility of electricity prices has not been considered. The uncertainties associated with price forecasting can indicate potential risks in the process of microgrid capacity planning. In future research, the uncertainty of prices can be accurately characterized through distributionally robust optimization (DRO) and integrated with the optimization model, fully considering the impact of price volatility on capacity planning (Zhou et al., 2021).
(2) Although feasible solutions can be provided, the optimal solution of the model cannot be guaranteed. Due to the non-convex and nonlinear nature of the proposed model, it can only be solved with the meta-heuristic optimization algorithm.
5.2 The potential impact of the communication mechanism
The intensity of communication among components has a significant impact on the microgrid system structure (Górski, 2022; Menniti et al., 2022). It is crucial to consider the area of information exchange, messaging patterns, and technologies employed. The use of messaging patterns in microgrid systems has gained significant attention due to their ability to facilitate efficient communication and coordination among various components. Górski (2022) provided valuable insights into the use of messaging patterns in different domains. By leveraging messaging patterns, microgrid components can exchange information in a standardized and reliable manner, enabling effective coordination and control. Menniti et al. (2022) presented experimental use cases that highlight the potential of enabling technologies in energy communities. These technologies can be leveraged in microgrids to enhance information exchange, such as advanced metering infrastructure, smart sensors, and real-time data analytics.
Therefore, if the communication between different microgrids and the communication range constraints between different types of devices are considered, it may influence the planning result of the microgrid equipment capacity.
6 Conclusion
This paper proposes a capacity planning model for wind-photovoltaic-storage equipment in microgrids and solves the model using the CGWO algorithm. The paper presents the following conclusions.
(1) This paper analyzes the whole life cycle costs and profits that need to be considered in the planning of wind-photovoltaic-storage equipment in a microgrid. Then, a capacity planning model of wind, photovoltaic, and storage equipment considering LCC and profits in the microgrid is established. In terms of life cycle cost, annualized investment cost, annual power outage compensation cost, annualized main grid purchase cost, and annualized equipment operation and maintenance cost are considered. In terms of profits of the system, the electricity sales income and scrapping income are considered.
(2) CGWO is applied to solve the proposed model efficiently. From the simulation results, it can be seen that CGWO improves the solution efficiency and convergence characteristics without increasing too much computational complexity. In addition, the robustness and adaptability of the algorithm are obviously improved compared with the traditional heuristic optimization algorithms.
(3) Sensitivity analysis on electricity selling price and energy storage investment and construction cost in the model are conducted to analyze the influence of electricity selling price and energy storage construction cost on the planning scheme. Case studies reveal the impact of the planned capacity of WT, PV, and BES increases in varying degrees when the selling price of different equipment decreases. In addition, microgrid planners will rapidly increase the proportion of BES investment when the investment cost of BES decreases.
Future research can investigate the integration of multiple energy resources, dynamic demand response, multiple microgrid interaction, and digital techniques and their impact on the capacity planning of microgrid equipment. Additionally, uncertainty optimization algorithms that can accurately depict load, renewable energy, and electricity price fluctuations will be further studied and applied in depth (MirjaliliSeyedaliLewis, 2016).
Data availability statement
The original contributions presented in the study are included in the article/Supplementary Material; further inquiries can be directed to the corresponding author.
Author contributions
LL: conceptualization, software, writing–original draft, and writing–review and editing. XZ: writing–original draft. WH: writing–original draft. LS: writing–original draft. ZW: writing–original draft. FC: writing–original draft.
Funding
The author(s) declare financial support was received for the research, authorship, and/or publication of this article. This work was jointly supported by the National Natural Science Foundation of China (52207105). The authors gratefully acknowledge their support.
Conflict of interest
LL, XZ, and WH are employed by the Digital Grid Research Institute of China Southern Power Grid. LS is employed by Guangzhou Shuimu Qinghua Technology Co., Ltd.
The remaining authors declare that the research was conducted in the absence of any commercial or financial relationships that could be construed as a potential conflict of interest.
Publisher’s note
All claims expressed in this article are solely those of the authors and do not necessarily represent those of their affiliated organizations, or those of the publisher, the editors, and the reviewers. Any product that may be evaluated in this article, or claim that may be made by its manufacturer, is not guaranteed or endorsed by the publisher.
References
Abou El-Ela, Adel A., Ragab, A. El-Sehiemy, and Shaheen, Abdullah M. (2022). A multi-objective equilibrium optimization for optimal allocation of batteries in distribution systems with lifetime maximization. J. Energy Storage 55, 2022. doi:10.1016/j.est.2022.105795
Ali, Selim, Kamel, Salah, Mohamed, Amal A., and Yu, J. (2023). Placement and sizing of distributed generations and shunt capacitors in radial distribution systems using hybrid optimization technique. Electr. Power Components Syst. 51, 421–437. doi:10.1080/15325008.2023.2173827
Baker, B. M., and Ayechew, M. A. (2003). A genetic algorithm for the vehicle routing problem. Comput. Operations Res. 30 (5), 787–800. doi:10.1016/S0305-0548(02)00051-5
Bergh, Fvd, and Engelbrecht, A. P. (2003). “A new locally convergent particle swarm optimiser,” in IEEE International Conference on Systems, Man and Cybernetics IEEE, Prague, Czech Republic, October 1–4, 2023.
Borghei, M., and Ghassemi, M. (2021). Optimal planning of microgrids for resilient distribution networks. Int. J. Electr. Power and Energy Syst. 128, 106682. doi:10.1016/j.ijepes.2020.106682
Coelho, V. N., Coelho, I. M., Coelho, B. N., de Oliveira, G. C., Barbosa, A. C., Pereira, L., et al. (2016). A communitarian microgrid storage planning system inside the scope of a smart city. Appl. Energy 201, 371–381. sep.1. doi:10.1016/j.apenergy.2016.12.043
Górski, Tomasz (2022). UML profile for messaging patterns in service-oriented architecture, microservices, and internet of things. Appl. Sci. 12 (24), 12790. doi:10.3390/app122412790
Hung, D. Q., Mithulananthan, N., and Lee, K. Y. (2014). Optimal placement of dispatchable and nondispatchable renewable DG units in distribution networks for minimizing energy loss. Int. J. Electr. Power and Energy Syst. 55, 179–186. doi:10.1016/j.ijepes.2013.09.007
Khemissi, L., Khiari, B., and Sellami, A. (2021). A novel optimal planning methodology of an autonomous Photovoltaic/Wind/Battery hybrid power system by minimizing economic, energetic and environmental objectives. Int. J. Green Energy 18 (10), 1064–1080. doi:10.1080/15435075.2021.1891906
Khoubseresht, Omid, and Rajabinezhad, MohamadaminSeyyed Yousef Mousazadeh Mousavi (2023). An analytical optimum method for simultaneous integration of PV, wind turbine and BESS to maximize technical benefits. IET Generation, Transm. Distribution. doi:10.1049/gtd2.12801
Kiptoo, Mark Kipngetich, Elsayed Lotfy, M., Senjyu, T., Mandal, P., and Abdel-Akher, M.Oludamilare Bode Adewuyi (2019). Multi-objective optimal capacity planning for 100% renewable energy-based microgrid incorporating cost of demand-side flexibility management. Appl. Sci. 9 (18), 3855. doi:10.3390/app9183855
Kiptoo, Mark Kipngetich, Nakadomari, Akito, and Senjyu, TomonobuOludamilare Bode AdewuyiHarun Or Rashid Howlader (2023). Optimal capacity and operational planning for renewable energy-based microgrid considering different demand-side management strategies. Energies 16, 4147. doi:10.3390/en16104147
Liang, Lingyu, Zhao, Xiangyu, and Huang, Wenqi (2023). Collaborative capacity planning method of wind-photovoltaic-storage equipment in microgrid based on improved cultural gray wolf optimization algorithm. Available at: https://drive.google.com/file/d/1WLDIC2-GerpFXQ6ngzzSC1lmFvKTS2hV/view?usp=sharing.
Liu, Z., Chen, Y., Luo, Y., Zhao, G., and Jin, X. (2016). Optimized planning of power source capacity in microgrid, considering combinations of energy storage devices. Appl. Sci. 6 (12), 416. doi:10.3390/app6120416
Menniti, D., Pinnarelli, A., Sorrentino, N., Vizza, P., Barone, G., Brusco, G., et al. (2022). Enabling technologies for energy communities: some experimental use cases. Energies 15 (17), 6374. doi:10.3390/en15176374
Mirjalili, SeyedaliSeyed Mohammad Mirjalilib (2014). Grey wolf optimizer. Adv. Eng. Softw. 69, 46–61. doi:10.1016/j.advengsoft.2013.12.007
MirjaliliSeyedaliLewis (2016). Grey wolf optimizer. Adv. Eng. Softw. 69, 46–61. doi:10.1016/j.advengsoft.2013.12.007
Prakash, P., Meena, D. C., Malik, H., Alotaibi, M. A., and Khan, I. A. (2022). A novel analytical approach for optimal integration of renewable energy sources in distribution systems. Energies 15, 1341. doi:10.3390/en15041341
Sharma, S., Bhattacharjee, S., and Bhattacharya, A. (2016). Grey wolf optimisation for optimal sizing of battery energy storage device to minimise operation cost of microgrid. IET Generation Transm. Distribution 10 (3), 625–637. doi:10.1049/iet-gtd.2015.0429
Singh, Bindeshwar, and Sharma, Janmejay (2017). A review on distributed generation planning. Renew. Sustain. Energy Rev. 76, 529–544. doi:10.1016/j.rser.2017.03.034
Wang, Jiayu, Han, Ding, Hu, Xiao, Liang, Hua, Xu, Zhongping, Zhang, Chengping, et al. (2022a). Research on application of “double-carbon power index” system based on delphi method. MATEC Web Conf. 356, 01006. doi:10.1051/matecconf/202235601006
Wang, Ziyao, Lin, Dan, Tao, Yu, Zeng, Guangxuan, and Pan, Zhenning (2022b). Explicit reliability incorporated switches planning of smart distribution system with high flexibility. Int. J. Power Energy Syst. doi:10.1016/j.ijepes.2022.108629
Wang, Ziyao, Zhong, Lipeng, Pan, Zhenning, Tao, Yu, and Qiu, Xingyu (2022c). Optimal double Q AC-DC hybrid distribution system planning with explicit topology-variable-based reliability assessment. Appl. Energy 322, 119438. doi:10.1016/j.apenergy.2022.119438
Wei, G., Zhi, W., Rui, B., Liu, W., Zhou, G., Chen, W., et al. (2014). Modeling, planning and optimal energy management of combined cooling, heating and power microgrid: A review. Int. J. Electr. Power and Energy Syst. 54, 26–37. jan. doi:10.1016/j.ijepes.2013.06.028
Xiao, B., Xing, S., Wang, T., Yang, Y., Dong, L., Yang, H., et al. (2020). Capacity planning of pumped storage power station based on the life cycle cost. Electr. Power Components Syst. 48 (3), 1263–1271. doi:10.1080/15325008.2020.1854383
Yang, B., Wang, J., Chen, Y., Li, D., Zeng, C., Chen, Y., et al. (2020b). Optimal sizing and placement of energy storage system in power grids: A state-of-the-art one-stop handbook. J. energy storage 32, 101814. doi:10.1016/j.est.2020.101814
Yang, B., Wang, J., Chen, Y., and Zeng, C. (2020a). Optimal sizing and placement of energy storage system in power grids: A state-of-the-art one-stop handbook. J. Energy Storage 32 (4), 101814. doi:10.1016/j.est.2020.101814
Zhou, Y., Zhai, Q., and Wu, L. (2021). Multistage transmission-constrained unit commitment with renewable energy and energy storage: implicit and explicit decision methods. IEEE Trans. Sustain. Energy 12 (2), 1032–1043. doi:10.1109/TSTE.2020.3031054
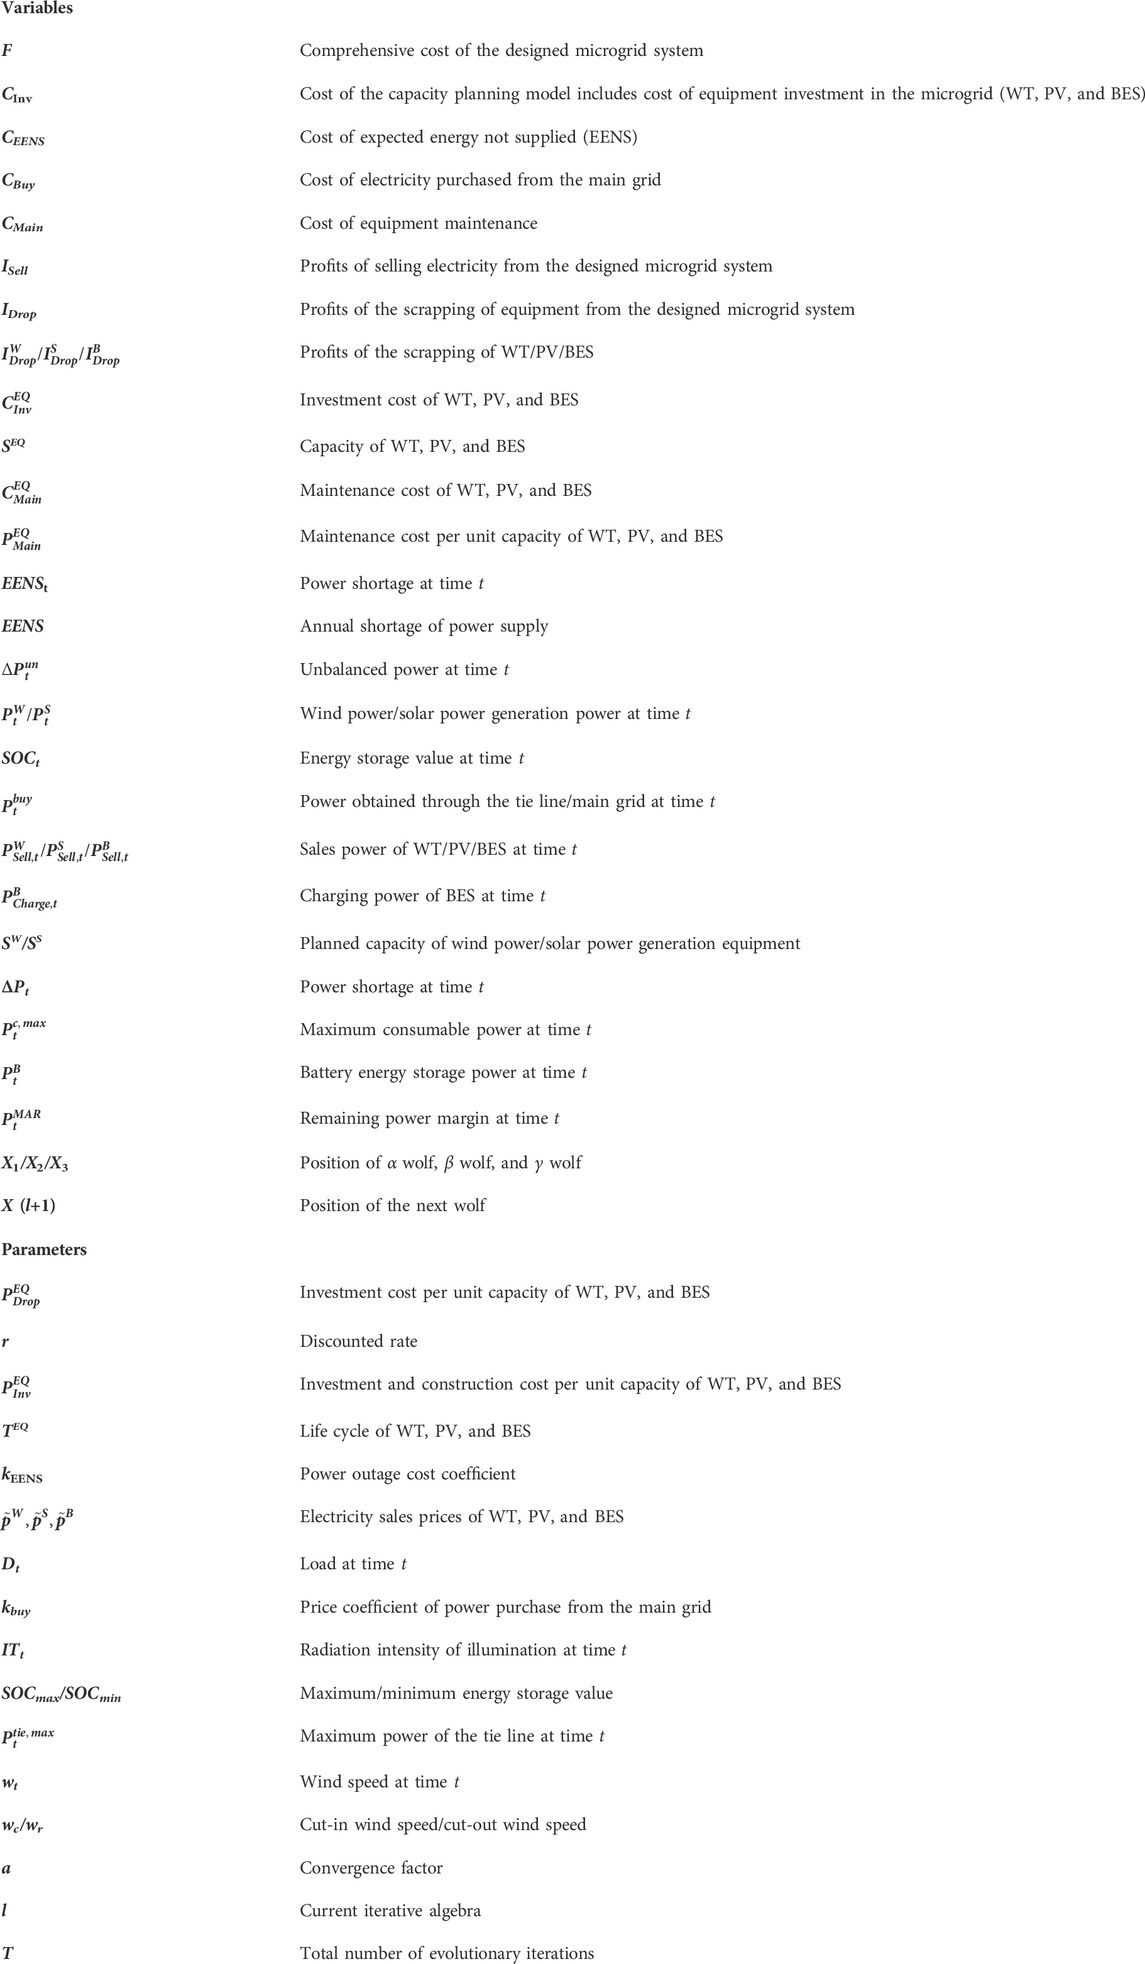
Nomenclature
Keywords: microgrid, wind-photovoltaic-storage capacity planning, collaborative planning, cultural gray wolf optimization algorithm, life cycle cost, selling price
Citation: Liang L, Zhao X, Huang W, Sun L, Wang Z and Chen F (2023) Collaborative capacity planning method of wind-photovoltaic-storage equipment in microgrids considering different energy selling incomes. Front. Energy Res. 11:1264986. doi: 10.3389/fenrg.2023.1264986
Received: 21 July 2023; Accepted: 10 August 2023;
Published: 24 August 2023.
Edited by:
Shiwei Xie, Fuzhou University, ChinaReviewed by:
Lv Chaoxian, China University of Mining and Technology, ChinaYuwei Chen, Power China Huadong Engineering Corporation Limited, China
Copyright © 2023 Liang, Zhao, Huang, Sun, Wang and Chen. This is an open-access article distributed under the terms of the Creative Commons Attribution License (CC BY). The use, distribution or reproduction in other forums is permitted, provided the original author(s) and the copyright owner(s) are credited and that the original publication in this journal is cited, in accordance with accepted academic practice. No use, distribution or reproduction is permitted which does not comply with these terms.
*Correspondence: Xiangyu Zhao, MTAwNjU5NzA4MEBxcS5jb20=