 Zonghua Zheng1
 Xudong Wu
 Feng Zheng
- 1College of Electrical Engineering and Automation, Fuzhou University, Fuzhou, China
- 2Electric Power Engineering, Kunming University of Science and Technology, Kunming, China
As a complex dynamically strongly coupled system, DC distribution system often suffers from voltage collapse due to system resonance. In order to suppress distribution network resonance and bus voltage fluctuation, this paper proposes a hybrid control algorithm to suppress DC distribution system resonance to further enhance DC system stability. In this paper, the output voltage of the line regulation converter (LRC) is the target of the study. A current prediction model is introduced in the inner loop of the converter control, which can enhance the dynamic responsiveness of the system and eliminate the PWM modulator and parameter tuning, achieve the unitization of the inner loop of the current. By constructing the inverse model of the controlled object, the outer voltage loop is unitized under the control of two-degree-of-freedom. The hybrid control enables the bus voltage to follow the reference voltage exactly, which suppresses resonance peaks in the voltage transfer function and reduces bus voltage fluctuations. Finally, the proposed hybrid control algorithm is simulated and verified in MATLAB/Simulink platform. The results show that the control strategy can effectively suppress the resonance and bus voltage fluctuation of the DC distribution system and enhance the dynamic characteristics and anti-interference capability of the distribution network.
1 Introduction
In recent years, low-voltage DC power distribution technology (Pan et al., 2020; Prabhakaran and Agarwal, 2020; Zhao et al., 2021) has gradually developed with the wide application of high-voltage DC transmission technology in power systems. Compared with AC distribution systems, DC distribution systems have no problems of system synchronization, frequency regulation and reactive power control, and they also have the advantages of high transmission efficiency and low construction cost (Zhang and Ruan, 2019; Jiang et al., 2020). However, there are various technical challenges to the further utilization of the DC power distribution system, among which the resonance problem is particularly prominent, which may lead to bus voltage collapse and affect the normal operation of the distribution system.
1.1 Previous and related work
The DC power distribution system usually rely on various power electronic converters to access distributed power sources such as photovoltaic cells, fuel cells, and wind turbines (Su et al., 2018). These distributed power sources are influenced by environmental and climatic factors, while the power electronic converters have nonlinear characteristics and the constant power load (CPL) in the system have negative impedance properties (Li et al., 2021), which make the DC distribution system prone to instability. The existing research on the analysis of DC distribution system instability mechanism is mainly divided into two kinds of analysis: small signal stability analysis and large signal stability analysis. Small signal stability analysis includes impedance matching analysis based on frequency domain (Shafiee et al., 2014; Gao et al., 2017) and eigenvalue analysis (Su et al., 2018; Cheng et al., 2020) and uses a linearization method to determine the stability of the system when it is subjected to small disturbances near the operating equilibrium point. The large-signal stability analysis (Martínez-Treviño et al., 2021; Kowsari et al., 2021) focuses on the effects of large disturbances such as sudden load changes and load dumping on system stability, and estimates the asymptotic stability region of the system by combining model construction with stability theorems. According to the study, constant power load (Hamzeh et al., 2016; Kim et al., 2016; Xu et al., 2019) has a large impact on the DC distribution system, and its negative impedance nature amplifies the disturbance signal, which leads to the system instability by failing to satisfy the stability criterion (Tabari and Yazdani, 2014). To address the impact of constant power load, a distributed nonlinear controller based on event-triggered communication is proposed in the literature (Han et al., 2018), which enhances the damping performance of the system while achieving accurate equalization and voltage regulation in the DC distribution system. In addition, using time-stamp technique and network delay compensator to calculate and compensate the time delay can enhance the effectiveness and robustness of the system (Vafamand et al., 2019) and enhance the effect of constant power load effects.
The main concern of the current research on DC distribution system is the overall stability of the system, while the resonance problem of the stability problem, which is the focus of the research on AC system, is often neglected in DC system, so a comprehensive and in-depth study of the resonance problem in the DC area is needed. At this stage, the research methods for DC resonance suppression are mainly active damping methods that do not generate additional losses. Literature (Zhang et al., 2022; He et al., 2020) used the stability enhancement method of virtual impedance to improve the resonance suppression capability of DC system, but this kind of method is easy to cause the output power of the converter to exceed the limit. Literature (Wu et al, 2017) simulates the rotational inertia and damping capacity of a virtual synchronous generator in a DC system to suppress resonance. This kind of method does not require precise acquisition of system parameters, but it tends to lead to uneven power distribution because it needs to be coupled with sag control. Another part of the study found that for the second harmonic on the DC bus and the bandwidth limitation of the voltage control loop, the resonance effects can be eliminated by enhanced trap filters and resonance regulators (Liu et al., 2020), but this method requires the establishment of a high-order system impedance transfer function, which complicates the analysis process. The literature (Ye et al., 2017) modifies the DC converter output terminal characteristics from the perspective of system impedance to eliminate the system resonance path, thus suppress resonance. Although this method uses a reduced-order impedance model, which does not require the establishment of complex impedance transfer function expressions, there are still some errors in the actual model. Based on the existing research on DC distribution system resonance, the reasons for DC distribution system resonance can be summarized into two aspects: the converter itself and the interaction between different converters. The converter itself causes include.
1) The existence of nonlinear switch makes the system often run nonlinear phenomenon.
2) The high order system composed of filter unit and line impedance makes the transfer function prone to resonance peaks.
Reasons for different converter interactions include.
1) The filtering devices and line impedances of different converters interact.
2) The interaction between the power supply and the constant power load generates resonance.
At the same time, micro source output change, load mutation and working mode change are easy to increase the resonant risk, resulting in bus voltage fluctuation.
1.2 Contributions
In view of the above research, this paper proposes a resonance suppression strategy for DC distribution systems based on a hybrid control algorithm. This strategy takes the LRC, which causes the resonance of the DC distribution system, as the research object, and combines two-degree-of-freedom control and current model prediction control to accurately suppress the resonance of the DC bus voltage with known distribution system structure and parameters. According to the author’s knowledge, the innovations of this paper compared with other studies are as follows: 1) The reduced order hybrid control algorithm is proposed in the LRC for the first time. Compared with the conventional voltage-current double closed-loop control and single two-degree-of-freedom control, the completely reduced order hybrid algorithm has great advantages in dynamic response speed, flexibility of processing system constraints, etc. At the same time, it also eliminates the PWM modulator and tuning of control system parameters, which improves the closed-loop characteristics of the system. 2) The proposed method eliminates the resonant peak in the transfer function of the LRC output voltage and the dynamic interaction between converter units, effectively suppressing the resonant problem of the DC distribution system and the bus voltage fluctuation phenomenon, and maintaining the bus voltage stability of the distribution network. 3) The method in this paper realizes the unitization of voltage and current transfer function. The influence of line parameters and distributed capacitance is eliminated in the outer loop, and the prediction of current in the inner loop enhances the robustness of the system and improves the power supply quality of the distribution network.
The rest of this work is structured as follows: Section 2 describes the DC distribution system modeling process including various types of power supplies and loads. Section 3 analyzes the resonant characteristics of the DC distribution system under the conventional voltage and current double closed-loop control. In Section 4, the reduced order hybrid control algorithm is proposed and the resonant characteristics of the distribution network are analyzed. In Section 5, MATLAB/Simulink is used to build the DC distribution system topology, which verifies the superiority of the new control strategy for the resonant suppression of the DC distribution system and the reduction of bus voltage fluctuation. Section 6 summarizes this work and looks forward to future work.
2 DC distribution system modeling
Figure 1 shows the typical structure of a DC distribution system, which consists of an AC power grid, distributed power supply, energy storage device and various loads. For a DC/DC converter where the load is purely resistive, the output power of the converter remains constant as long as the output voltage of the converter is strictly regulated to be constant, and in turn the input power is almost constant, so this converter can simulate a realistic constant power load (Hassan et al., 2019). Both the grid and the distributed power sources are connected to the DC bus through power electronic converters to inject energy into the system and support the stable operation of various loads.
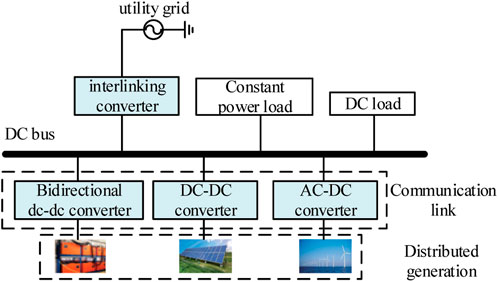
FIGURE 1. Architecture of the DC distribution system.
Because there are many kinds of power electronic devices involved in the operation process of DC distribution system, it is easy to produce complex interactions. In order to verify the accuracy of the proposed algorithm, a simple DC distribution system model as shown in Figure 2 is built according to the LRC, constant power load model and multiple photovoltaic cell models. The model consists of two LRCs and two CPLs. Due to the instability of the photovoltaic system output, it is used as a constant power micro source to add light at 2 s and cut off light at 4 s, so as to simulate the influence of photovoltaic on the whole system in light and dark conditions. Ceq is the bus support capacitance, Cxi, Rxi is the line distribution capacitance. The specific values of various system parameters in the figure are shown in Table 1, and the control parameters are shown in Table 2. The values of parameters listed in the table are the optimal parameters verified by seveal simulations.
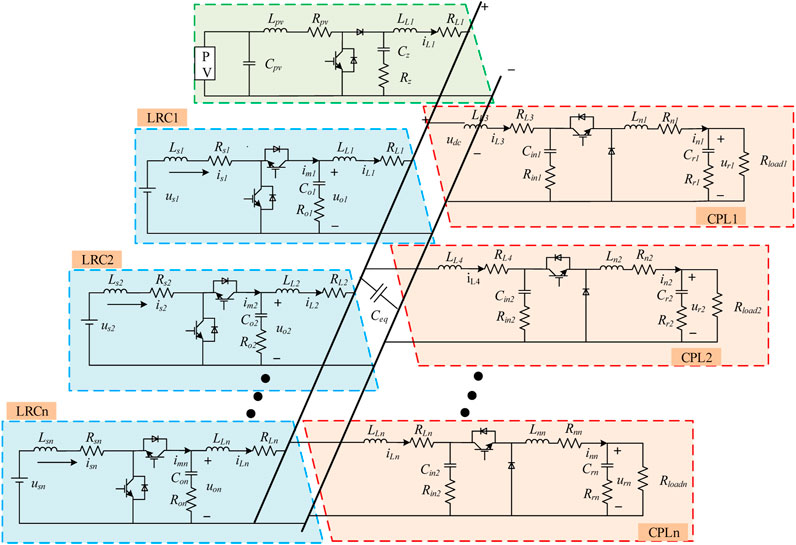
FIGURE 2. Simple model of DC distribution system.
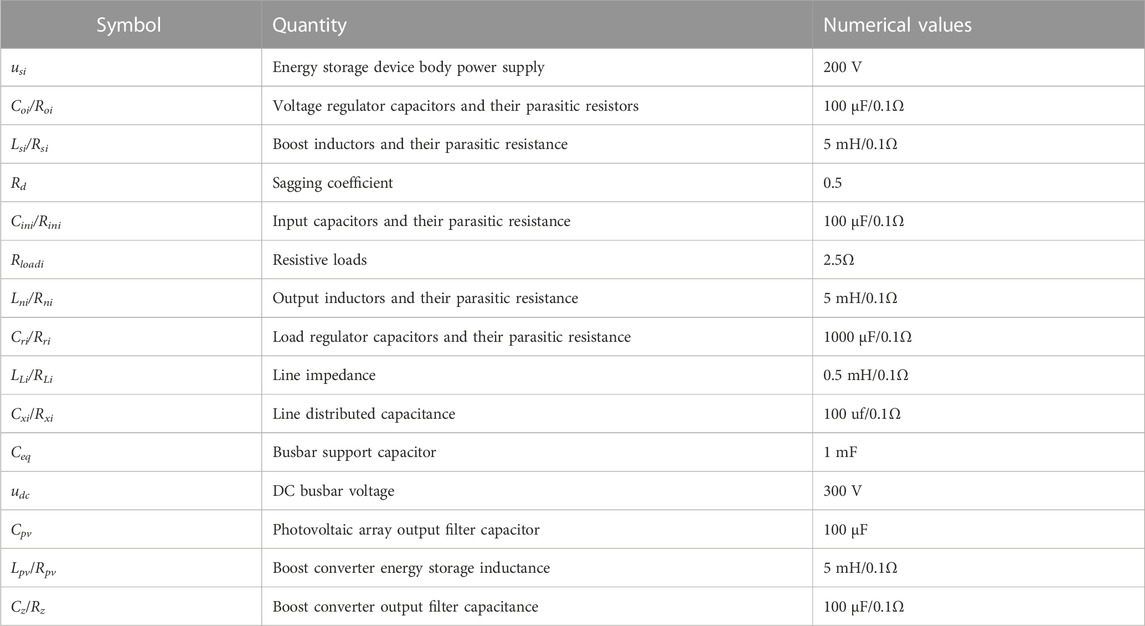
TABLE 1. Parameter of DC distribution system.
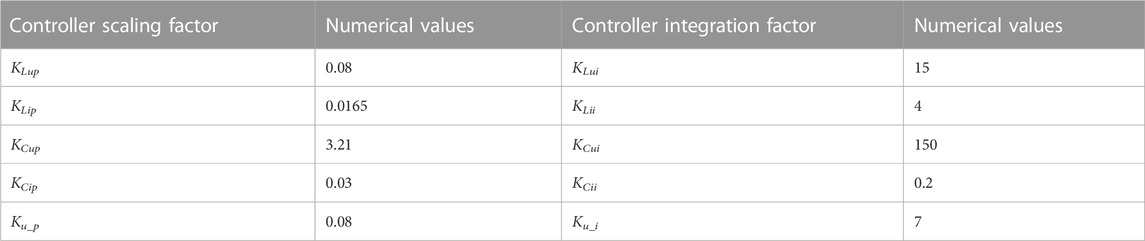
TABLE 2. Control parameters.
3 Analysis of DC distribution system resonance under conventional control
For DC distribution system, the most important thing is to control bus voltage fluctuation and suppress system resonance. The equivalent impedance analysis can effectively determine the resonance of the system. By studying the LRC output voltage transfer function, we can obtain the bus voltage fluctuation of the DC distribution system, which provides a theoretical basis for suppressing resonance and bus voltage fluctuation.
In this paper, the photovoltaic system controlled by MPPT is connected to the power grid as a micro-source disturbance. Therefore, during the resonance analysis, the small-signal equivalent circuit of the DC distribution system, as shown in Figure 3, is established only according to the small-signal models of LRC and CPL. Where, ZLRCi is the equivalent impedance of LRC.

FIGURE 3. DC distribution system small signal equivalence model.
ZLRC and ZCPL can be expressed by Eq. 1, where
The expression of DC bus voltage can be calculated as follows:
According to the established distribution network equivalent model, the frequency responses of the LRC equivalent impedance ZLRC and the CPL equivalent impedance ZCPL = 1/YCPL are shown in Figure 4. Literature (He et al., 2013) points out that when the equivalent impedance of the power supply and the equivalent impedance of the load cross, the two subsystems may interact. Therefore, at the frequency of 17.9 and 1030 Hz in Figure 4, the amplitude characteristic curves of ZLRC and ZCPL have intersection points A and B, respectively, and the phase difference between ZLRC and ZCPL at point A is much less than 180°, so there is no interaction between them. At point B, the phase difference between the two is close to 180°, which means that the power subsystem interacts with the load subsystem at this frequency point. And at the intersection B, LRC appears capacitive and CPL appears inductive, which forms a resonant loop for the whole system. Observe the DC bus voltage expression of Eq. 2 so that the denominator part is zero, which can be approximated as shown in Eq. 3, which is similar to the second-order system expression 4). Therefore, the damping coefficient of the micromesh at the resonant frequency can be obtained according to the characteristics of the second-order system, as shown in Eq. 5.
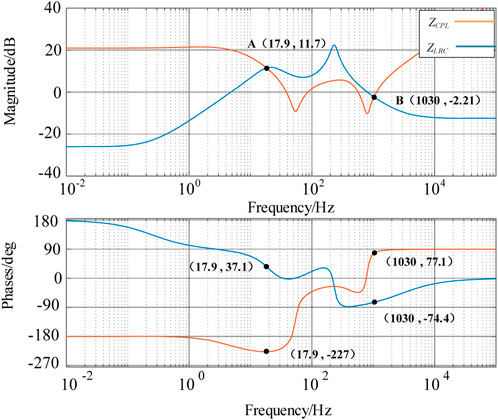
FIGURE 4. Bode chart for ZLRC and ZCPL.
By substituting
Take LRC1 in simple DC distribution system model as an example. The conventional control of LRC adopts voltage and current double-loop control, and the droop control (Sharma et al., 2023) is adopted between different LRC to ensure power distribution. The control block diagram is shown in Figure 5. Where Rd is the sag coefficient; GLu is the conventional voltage outer-loop transfer function; GLi is the conventional voltage inner-loop transfer function. Gdc is the transfer function expression of duty cycle dL to im obtained from the dynamic mathematical model of the LRC after small signal processing; GCo denotes the frequency domain model of the voltage regulator capacitor and its parasitic resistance; GLL denotes the frequency domain model of the line conductance; GCx represents the frequency domain model of line distributed capacitance.

FIGURE 5. Conventional control block diagram of simulated energy storage devices.
According to Figure 5, the following control system output voltage transfer function can be found:
Here,
The output voltage transfer function udc/udc_ref shown in Eq. 6 of the control system has complex high order. In MATLAB, the above formula is used to calculate the highest order term of the numerator to the 29th power and the highest order term of the denominator to the 31st power. Based on the analysis of the system structure, it can be seen that the parallel operation of multiple power supply system makes the voltage fluctuation of the distribution network more severe, and the CPL of constant power load has the negative impedance characteristic, which further affects the complexity of the voltage fluctuation of the DC distribution system. According to Eq. 6, the Bode diagram of the LRC output voltage under conventional voltage and current double-loop control can be drawn, as shown in Figure 6. In the figure, the amplitude-frequency characteristic curve of the system appears a resonant peak at a frequency of about 767Hz, with a peak value of −25dB, and the phase-frequency characteristic curve of the system also plummets at this frequency. Therefore, it can be seen that the output voltage of the system is easily affected by interference, which will cause fluctuations and affect the stability of the bus voltage.
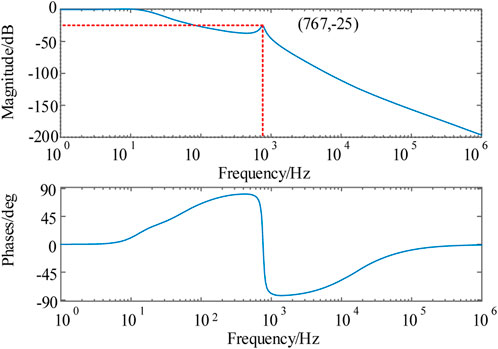
FIGURE 6. Conventional control of the Bode diagram.
4 Reduced-order hybrid control algorithm
In literature (Xiong et al., 2020), the two-degree-of-freedom control of double-loop is adopted to simplify the transfer function and suppress the resonant peak of the multi-inverter system. However, the differential link is introduced into the inner current loop of the control, which is easy to magnify the error. In view of this, a fully reduced-order hybrid control algorithm is proposed in this paper. The algorithm improves the current inner loop of the controller by introducing a current prediction algorithm. And it is used in the DC system to control the output voltage of the LRC. That makes the DC bus voltage follow the reference voltage, enhances the robustness of the system and suppresses resonance and bus voltage fluctuations in the DC distribution system.
4.1 Current prediction model control
Compared to conventional PI control, predictive current control (Cheng et al., 2018; Shan et al., 2019; Restrepo et al., 2020) has great advantages in dynamic responsiveness and the accuracy of processing system constraints. It also eliminates the need for PWM modulators and control system parameter tuning, resulting in enhanced closed-loop characteristics and robust performance of the device (Nguyen and Jung, 2018).
According to the dynamic mathematical model of the LRC established above, we discretize the inductance current of the boost inductor Ls by the first-order Euler method to obtain:
Here, Ts is the sampling period; i1s (k+1) and i2s (k+1) are the boost inductor current values predicted in the second step at different switching states. To ensure that the control system can follow the output signal ins (k+1) accurately, the following value function is defined:
Figure 7 shows the current in-loop predictive control framework of the LRC. Firstly, parameters such as is and udc are collected as the current quantity inputs, and the current predictive model is used to calculate the current values of the boost inductor under different switching states, and finally the optimal group is selected by the objective function to control the on/off of the switching tubes, thus realizing fast current regulation. Figure 8 shows the flowchart of the optimization search. We consider the existence of control delays in digital control systems, the suitable switching signal calculated at time k does not act directly on the system at time k+1, but waits until time k+2 to make the switching tube act. Therefore, a two-step prediction is used to compensate for the delay. The actual current value at time k is sampled to calculate the current value at time k+1, and the predicted current value at time k+2 of the switching tube is obtained from the calculated current value. Finally, the control objective is achieved by seeking the objective function and applying the switching sequence to the switching tube.
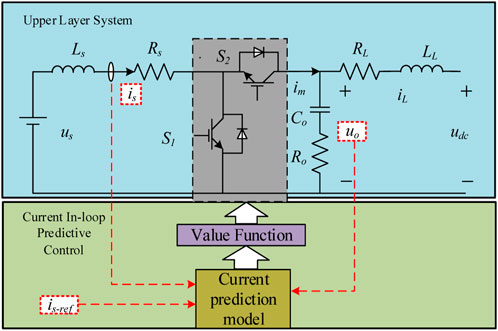
FIGURE 7. Current in-loop predictive control framework.
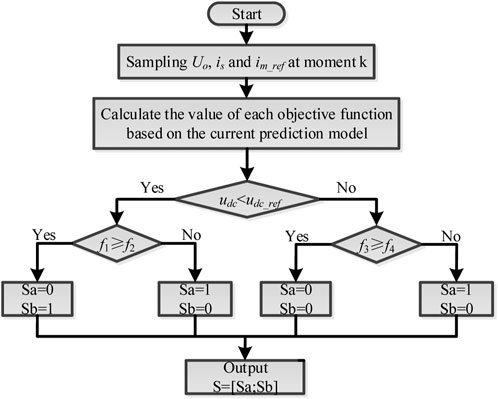
FIGURE 8. Evaluation process flow chart.
4.2 Two-degree-of-freedom control
Figure 9 shows the block diagram of the two-degree-of-freedom control. Where M(s) and H(s) are the input and output signals, respectively; J(s) and T(s) are the feedback link and the target object, respectively; B(s) is the feedforward controller; and E(s) is the input and output errors.
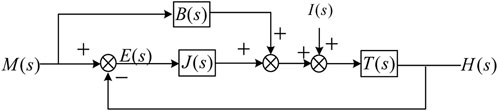
FIGURE 9. Two-degree-of-freedom control block diagram.
According to Figure 9, if B(s) = 1/T(s) is controlled, the following transfer functions between H(s) and M(s), E(s) and M(s) can be obtained:
From Eq. 10, there is a term in the expression of H(s) and E(s) with respect to the perturbation signal I(s). In order to make the error E(s) equal to 0 and H(s) track M(s) completely, the part of the whole block diagram containing the disturbance signal I(s) is adjusted in the control system by adjusting J(s) to minimise the effect on the system. When this part is small enough then H(s) is realised to track M(s) completely and the error E(s) is eliminated. With a single gain from M(s) to H(s) at all frequencies, the system bandwidth limitation is eliminated.
The overall control framework of the reduced order hybrid control algorithm is shown in Figure 10. Among them, the current inner loop part of the algorithm is the current model predictive control with Ls as the control object. The predicted current under different switching states is calculated by using Eq. 8, and the switching sequence of the control switch tubes S1 and S2 is obtained by value function Eq. 9 to ensure that LRC has good dynamic and static performance. At the same time, the PWM modulator and the tuning of the control system parameters are omitted. The converter switching frequency is reduced and no longer fixed, reducing the likelihood of resonance. Since the current prediction model is used as the current inner loop strategy of the control system, the transfer function of the input reference current signal im_ref and the output current im are also unitized (Changliang et al., 2014), that is, im/im_ref = 1. As the control object of the voltage outer loop, in order to achieve the bus voltage udc and its reference value udc_ref equal, that is, udc/udc_ref = 1. According to the two-degree-of-freedom control principle, T(s) is constructed as the inverse model of the controlled object to eliminate the influence of the line impedance in the output voltage transfer function of the converter. Meanwhile, manual adjustment is combined with Matlab automatic adjustment tool to input small step signals into the system to observe the output voltage changes and determine the optimal parameters of PI controller in J(s). Finally, the order of the system can be completely reduced. By combining Figure 9 and Eq. 10, the voltage outer loop unitization is realized.
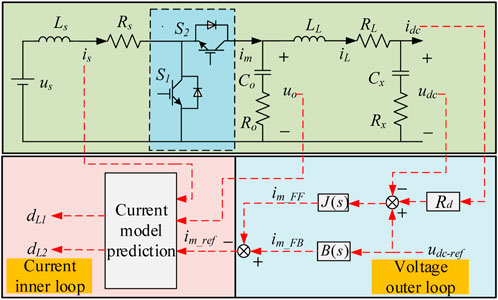
FIGURE 10. General control framework of hybrid control algorithm.
J(s), B(s), im_FF and im_FB in Figure 10 are shown in Eq. 11.
4.3 Hybrid control algorithm resonance analysis
In order to analyze the resonance of the DC distribution system under the new control algorithm, the equivalent model of the DC distribution system under the reduced order hybrid control algorithm is established again. At this time, the Bode diagram of ZLRC and ZCPL is shown in Figure 11. According to the overall framework of the reduced order hybrid control algorithm, the overall flow block diagram van be drawn as shown in Figure 12. MPC is the prediction current model, and the other parameters are consistent with the above parameters.
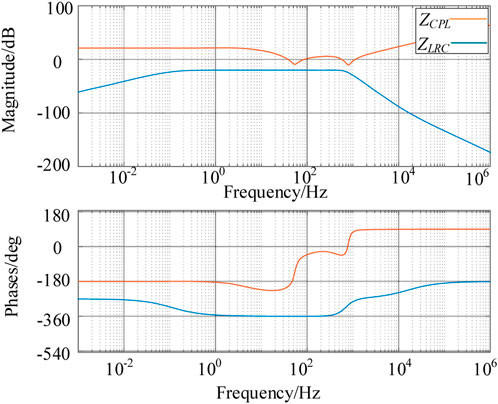
FIGURE 11. Bode chart for ZLRC and ZCPL under new control.
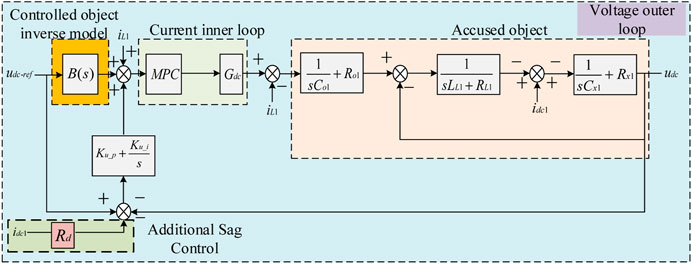
FIGURE 12. Block diagram of the overall flow of the hybrid algorithm.
In the Bode diagram under the new control, the amplitude-frequency characteristic curves of ZLRC and ZCPL have no intersection, and there is no interaction between the two, and no resonant path is generated. The resonant risk of the DC distribution system under the conventional control is eliminated.
The presence of the signal iL1 in the external system of Figure 12 and the introduction of an opposite iL1 in the control system causes the two to cancel each other out in the two-degree-of-freedom block diagram. Sag control acts as an additional operation to balance the power distribution between different converters and its effect is negligible in steady state. The current inner loop and voltage outer loop realize the unitization of the LRC transfer function with udc/udc_ref = 1. Comparing the unitized transfer function with the output voltage transfer function under the conventional control of Eq. 6 and the Porter diagram drawn according to Eq. 6, it can be seen that the LRC output voltage transfer function is greatly simplified under the control of the hybrid control algorithm, and the numerator denominator order no longer has a higher order, realizing the transfer function is completely reduced in order. And since udc/udc_ref is always 1 in the full frequency band and the Bode plot gain is a straight line, it can be seen by comparison that the resonant spikes appearing in the conventional control are damped and the system output follows the reference voltage completely and remains in the full frequency band. Therefore, the proposed control strategy can suppress the resonance phenomenon in the DC distribution system and keep the bus voltage stable well.
4.4 Analysis of the effect of inductance mismatch on the stability of DC distribution system
Literature (Kwak et al., 2014; Parvez Akter et al., 2016; Makhamreh et al., 2019) uses Lyapunov stability theorem to analyze the model predictive control in the consistency algorithm proposed by Lyapunov, and proves the stability of the algorithm. However, for the inductor model, the theoretical and actual values may cause some errors, and the parameters usually vary within ±20%. When the inductor model is mismatched, the current prediction effect and switching frequency will be affected. Therefore, the stability of the current prediction model control algorithm needs to be further studied.
Since RsTs/Ls<<1 and the inductor parasitic resistance Rs can be neglected, the inductor current prediction model shown in Eq. 8 is simplified as follows.
When the actual inductance Lsreal does not match the model inductance Ls, the actual current value becomes:
Taking the inductive current when the switch tube is off as an example, the inductive current error can be obtained by calculating the difference between the reference value and the actual value at the time k+1:
Here, e(k) is the current error at time k. Because of the high sampling frequency of the converter, e(k) can be approximately equal to [is_ref (k+1)-is(k)]. δ(k) is the voltage error. φ is the upper bound of the voltage error.
The current prediction control system is considered stable if the predicted current error can converge to the closed set Ω (Cheng et al., 2018).
When Ls < Lsreal, according to Eqs 14, 16 can be obtained:
Combining Eqs 14, 16, it can be seen that the predicted current error decays continuously with time and eventually converges to the closed set Ω1. The system can remain stable, and the current error size can be guaranteed to be within a given range because Ω1 is contained in Ω.
When Lsreal < Ls < 2Lsreal, according to Eqs 14, 18 is obtained:
Similarly, combining Eqs 14, 18, it can be seen that the predicted current error still decays continuously with time, and the final current error also converges to the closed set Ω1. The system still remains stable. In summary, the algorithm proposed in this paper can meet the system stability requirements because the variation of inductance parameters is ±20%.
5 Simulation analysis
In order to verify the effectiveness of the reduced order hybrid control algorithm for resonant suppression of DC distribution system, the DC distribution system modelshown in Figure 2 was built in MATLAB/Simulink. It consists of two analog energy storage units with an output voltage of 200 V, several photovoltaic cells, and two constant power loads with a power of 4 kW. The photovoltaic cell temperature is 25°C, the solar irradiance is 1000 W/m2, the power of a single battery is 352 W, and the photovoltaic array composed of 25 cells is divided into 5 groups, each group of 5 cells in series and 5 groups in parallel. The switching frequency used for the simulation model is 10 kHz. In the control part, the conventional voltage-current double closed loop, single two-degree-of-freedom algorithm and fully reduced order hybrid algorithm are used respectively. The outer loop of the single two-degree-of-freedom algorithm is two-degree-of-freedom control, and the inner loop is PI control. The effectiveness of the new control algorithm is verified by comparison. The device parameters and control parameters of the system are consistent with those in Supplementary Tables S1, S2.
5.1 Simulation of resonance characteristics of DC distribution system
In this paper, the FFT tool in simulink is used to perform Fourier decomposition on the DC distribution system bus voltage udc under three kinds of control, analyze the voltage resonance of the distribution network bus, and obtain the spectrum diagram as shown in Figure 13. Figure 13B is the spectrum diagram of the bus voltage under conventional control. It can be seen from the figure that the amplitude is 185,600% when the frequency is 768.7Hz, indicating that there is a resonance peak of 768.7 Hz in the DC bus voltage, and the amplitude of the resonance is much larger than that generated by other frequencies. Meanwhile, for the frequency band near this frequency, due to the influence of the resonant frequency, a higher resonant amplitude is generated correspondingly, which is consistent with the resonant condition shown in the comprehensive analysis of the bus voltage amplitude-frequency and phase-frequency characteristic curves under conventional control. Figures 13D, F show the bus voltage spectrum under single two-degree-of-freedom control and new control, respectively. As can be seen from the figure, the voltage spectrum under the single two-degree-of-freedom control has been reduced to a certain extent compared with the conventional control, and the maximum amplitude at 763 Hz is only 43,010%, but it still cannot reach the suppression effect of the new control algorithm. After adopting the new control mode, the resonance amplitude of the bus voltage is greatly reduced in the full frequency domain. After magnifying the figure, it can be seen that the amplitude is the largest at 777Hz, which is 18,330%, nearly one-10th of the amplitude under the conventional control, and the resonance phenomenon is well suppressed.
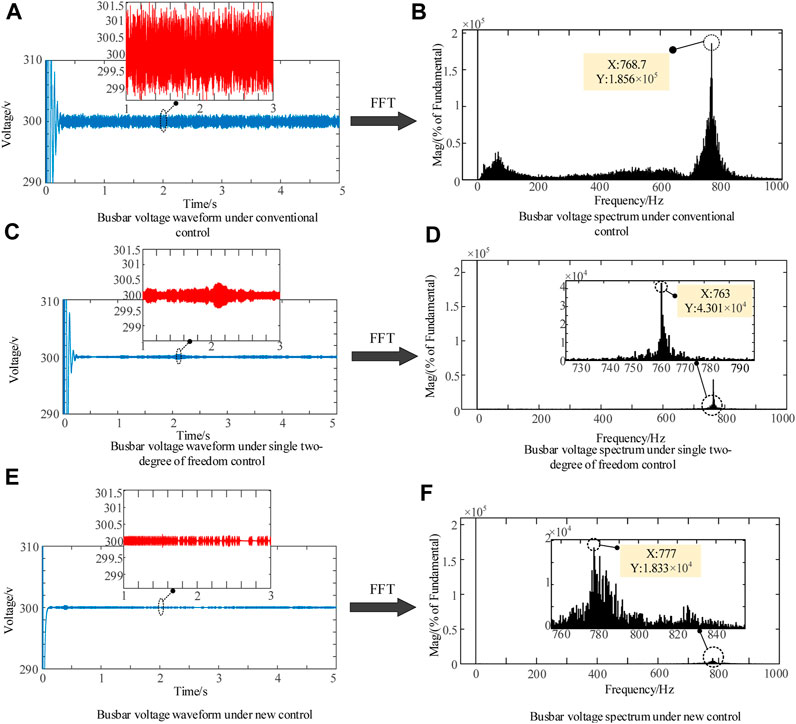
FIGURE 13. Bus voltage resonance simulation results.
5.2 DC distribution system steady state characterization
Figures 13A, C, E show the steady state waveforms of the bus voltage under the conventional control, single two-degree-of-freedom control and the new control, respectively. During the first 0.2s of operation of the DC distribution system, the closed-loop dynamic quality is sensitive to changes in gain, as the conventional PI control has little margin for dynamic quality. And because the distribution network model built takes into account the influence of line impedance as well as distributed capacitance, the bus voltage overshoot of the conventional control is large and violent oscillations occur. In contrast, the single two-degree-of-freedom control with the new control constructs an inverse model of the line parameters eliminating the influence of the line. As can be seen in Figure 13C, the bus voltage under single two-degree-of-freedom control eliminates the influence of the line, but the overshoot is reduced but not eliminated because the inner loop is still PI controlled, and the oscillations are only slightly reduced. The new control in Figure 13E is robust and not only achieves voltage stabilisation in 0.07s, but also has no overshoot. Looking at the voltage fluctuations under the three controls, it can be seen that the bus voltage fluctuates around 1.5 V under the conventional control, around 0.4 V under the single two-degree-of-freedom control, and around 0.2 V under the new control. From the comparison of the fluctuations in the same coordinate scale, it is clear that the new control has a better control effect.
In addition, in order to further reflect the superiority of the new control strategy, a model with n = 3 was built for simulation experiments and the results are shown in Figure 14. As the power supply and the constant power load increase, the voltage oscillation time of the DC bus voltage under the conventional control increases from 0.2 s to 1.6s due to the influence of the PI link, while for the bus voltage under the new control, it still maintains a good voltage stabilization effect and is able to reach the desired voltage and maintain stability within 0.1 s.
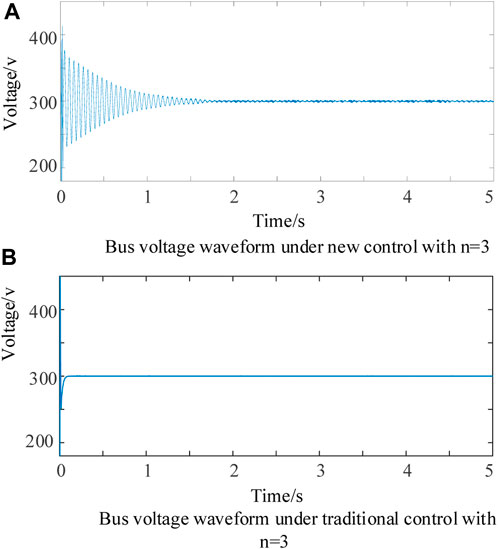
FIGURE 14. n = 3, DC bus voltage waveform.
In a real distribution network, line parameters are often prone to change due to changes in operating conditions and weather. As can be seen from Figures 13C, E, the difference in voltage fluctuations between the single two-degree-of-freedom and the new control at steady state is not significant, and the corresponding current variations are relatively similar. This paper simulates the effect of the change in line parameters of LRC2 on the input currents of the two LRCs under conventional, single two-degree-of-freedom and new control, as shown in Figure 15. As can be seen from the figure, the current ripple under the single two-degree-of-freedom control and the new control are comparable. When the LRC2 line parameters change, the idc1 current fluctuation is small under all three control strategies. However, the current ripple under the new control and the single two-degree-of-freedom control are still much smaller than under the conventional control. For idc2, as the line impedance and line distribution capacitance decrease, the conventional control current ripple gradually increases, the loss increases. The currents under new control and the single two-degree-of-freedom control can always maintain a small ripple, with high stability and resistance to impedance changes. To verify the effectiveness of the inner-loop predictive current control in the new control, the size of the controlled inductor Ls2 is changed to 4, 5 and 6 mH, respectively, and observe the is2 current as shown in Supplementary Figure S1. a) The current waveform of is2 when Ls2 is 4 mH; b) the current waveform of is2 when Ls2 is 5 mH; c) the current waveform of is2 when Ls2 is 5 mH. From the graphs, it can be seen that the new control is able to maintain good control current capability despite inductance changes due to the robustness of the system enhanced by the inner-loop predicted current; the single two-degree-of-freedom control is also able to achieve stable current control, but with a large current ripple; while the conventional control completely shuts down when the inductance changes to 6 mH and the system collapses without achieving stable control, hence not shown in the graphs below. In summary, the correctness of the new control to achieve unitised output voltage is verified from both the outer and inner loops.
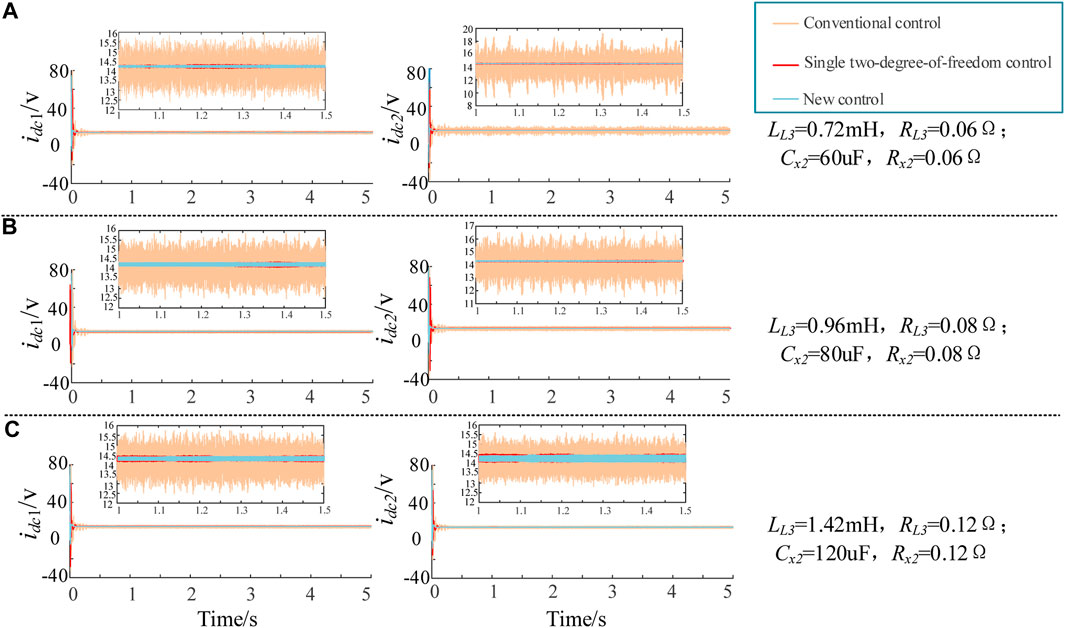
FIGURE 15. LRC output current comparison when line parameters change.
5.3 DC distribution system dynamic characterization
Supplementary Figures 2A–C show the bus voltage dynamics during load variations under conventional control, single two-degree-of-freedom control and the new control, respectively. Load disturbances of 2, 1 and 0.4 kW are injected into the system at 0.5 s. In the conventional control, when the load changes abruptly, the DC bus undergoes violent voltage resonance, and as the load disturbance increases, the bus voltage oscillations become progressively larger in amplitude and longer in duration. The single two-degree-of-freedom control improves the degree of voltage resonance during sudden load changes and shortens the voltage stabilisation time. The oscillations caused by sudden load changes are well suppressed in the new control, and the time for voltage stabilisation is significantly reduced, maintaining good dynamic characteristics even with a 2 kW load disturbance. The three control voltage waveforms are compared under the same coordinate system for a load variation of 2 kW. As shown in Supplementary Figure S2D, the superiority of the new control in terms of fluctuation suppression and the speed of voltage recovery can be clearly seen.
The two constant power loads are injected and removed respectively, as shown in Supplementary Figure S3. a) is about voltage variation and b) is about power variation. 2kW load disturbance is injected into CPL1 at 0.5 s and removed at 3 s; 2 kW load disturbance is also injected into CPL2 at 1.5 s and removed at 4 s. In the conventional control, due to the unbalanced load, the bus voltage fluctuates with the increase of different CPL load disturbances, and the fluctuation time and amplitude increase. The single two-degree-of-freedom control and the new control always maintain a good voltage recovery performance and do not increase the fluctuation time due to load imbalance. The maximum value of voltage change for the new control is always smaller than the maximum value of fluctuation for the conventional control and the single two-degree-of-freedom control, regardless of whether the load disturbance is injected or removed.
5.4 Analysis of the impact of PV system joining on bus voltage
Unlike LRC modules, photovoltaic systems, which act as a power source with current-source characteristics, are prone to bus voltage fluctuations when connected via DC-DC converters. And due to the uncertainty of PV power generation, it is prone to sudden power failure or sudden turn-on. Supplementary Figure S4 shows the fluctuation of the bus voltage when light is added to the PV system and disappears. 2 s when the PV system is exposed to light and starts to output energy, the power is 8.8 kw and in 4 s when the PV system is exposed to light disappears. As can be seen from the graph, the bus voltage under conventional control fluctuates dramatically due to the addition of the PV system, and after stabilisation the voltage ripple increases; when the light disappears the bus voltage also fluctuates dramatically, and after stabilisation the voltage ripple returns to the situation before the PV is added. With the single two-degree-of-freedom control, the addition of the PV still produces oscillations, but the voltage spikes are reduced and the voltage oscillations are smaller than with the conventional control. Under the new control, the bus voltage rises to around 320 v due to the energy injection, but does not fluctuate dramatically and the bus voltage regains stability around 0.3 s. Although the steady-state voltage ripple increases after the addition of PV, the bus voltage distortion is greatly reduced compared to the conventional control, and the new control algorithm also has good control effect after the light disappears. The bus voltage waveforms for the PV system joining the distribution network in the case of sudden power changes are shown in Supplementary Figure S5. 2 kW of power is injected into the system at 2 s and removed at 3 s. From the figure, it can be seen that the presence of the PV system makes the bus voltage fluctuate as much as 25 V under conventional control when the power changes, which clearly exceeds the permissible range of voltage fluctuation. Whereas, both the single two-degree-of-freedom and the new control are able to keep the steady state voltage fluctuation around 0.5 V. The superiority of the new control over the single two-degree-of-freedom control is that the bus voltage is smaller and the recovery time is faster during sudden power changes. Therefore, it can be seen that the conventional control of PV systems can lead to drastic fluctuations in the bus voltage during sudden power changes, and even destabilization occurs. The new control can improve the system stability in both transient and steady state and suppress the increase of resonance.
From the above analysis of the steady-state and dynamic characteristics of DC bus voltage, it can be concluded that the reduced-order hybrid control algorithm can better suppress the DC distribution system resonance and reduce bus voltage fluctuation, which is consistent with the previous theoretical analysis.
6 Conclusion
The DC distribution system is a complex dynamic strongly coupled system and resonance can seriously affect the stable operation of the distribution system. This paper proposes a DC distribution system resonance suppression strategy with a reduced-order hybrid control algorithm, which combines current model predictive control with two-degree-of-freedom algorithm to suppress DC distribution system resonance and bus voltage fluctuations. Through theoretical analysis and simulation experiments, the effectiveness of the reduced order hybrid control algorithm in suppressing resonance and bus voltage fluctuation is verified. Due to the current weak grid situation in the power system, the following work considers applying the hybrid algorithm to the working conditions where the distribution network is connected to the weak grid, so as to improve the power quality of the DC distribution system under the weak current network and improve the system stability.
Data availability statement
The original contributions presented in the study are included in the article/Supplementary Material, further inquiries can be directed to the corresponding author.
Author contributions
ZZ: Writing–review and editing. XW: Conceptualization, Data curation, Methodology, Writing–original draft. FZ: Writing–review and editing. BL: Writing–review and editing. NL: Writing–review and editing.
Funding
The authors declare that this study received funding from Natural Science Foudation of China (52167010). The funder was not involved in the study design, collection, analysis, interpretation of data, the writing of this article, or the decision to submit it for publication.
Conflict of interest
The authors declare that the research was conducted in the absence of any commercial or financial relationships that could be construed as a potential conflict of interest.
Publisher’s note
All claims expressed in this article are solely those of the authors and do not necessarily represent those of their affiliated organizations, or those of the publisher, the editors and the reviewers. Any product that may be evaluated in this article, or claim that may be made by its manufacturer, is not guaranteed or endorsed by the publisher.
Supplementary material
The Supplementary Material for this article can be found online at: https://www.frontiersin.org/articles/10.3389/fenrg.2023.1260678/full#supplementary-material
References
Changliang, X., Tao, L., Tingna, S., and Zhanfeng, S. (2014). A simplified finite-control-set model-predictive control for power converters. IEEE Trans. Ind. Inf. 10 (2), 991–1002. doi:10.1109/tii.2013.2284558
Cheng, C., Li, W., Zhou, Z., Deng, Z., and Mi, C. (2020). A load-independent wireless power transfer system with multiple constant voltage outputs. IEEE Trans. Power Electron. 35 (4), 3328–3331. doi:10.1109/tpel.2019.2940091
Cheng, L., Acuna, P., Aguilera, R. P., Jiang, J., Wei, S., Fletcher, J. E., et al. (2018). Model predictive control for DC–DC boost converters with reduced-prediction horizon and constant switching frequency. IEEE Trans. Power Electron. 33 (10), 9064–9075. doi:10.1109/tpel.2017.2785255
Kowsari, E., Zarei, J., Razavi-Far, R., and Saif, M., 2021 "Rapid stabilization of dc microgrids with cpls: nonlinear model predictive control," Proccedings of the IECON 2021 – 47th Annual Conference of the IEEE Industrial Electronics Society, June 2021. Toronto, ON, Canada.
Gao, F., Bozhko, S., Costabeber, A., Patel, C., Wheeler, P., Hill, C. I., et al. (2017). Comparative stability analysis of droop control approaches in voltage-source-converter-based DC microgrids. IEEE Trans. Power Electron. 32 (3), 2395–2415. doi:10.1109/tpel.2016.2567780
Hamzeh, M., Ghafouri, M., Karimi, H., Sheshyekani, K., and Guerrero, J. M. (2016). Power oscillations damping in DC microgrids. IEEE Trans. Energy Convers. 31 (3), 970–980. doi:10.1109/tec.2016.2542266
Han, R., Meng, L., Guerrero, J. M., and Vasquez, J. C. (2018). Distributed nonlinear control with event-triggered communication to achieve current-sharing and voltage regulation in DC microgrids. IEEE Trans. Power Electron. 33 (7), 6416–6433. doi:10.1109/tpel.2017.2749518
Hassan, M. A., Li, E. -p., Li, X., Li, T., Duan, C., and Chi, S. (2019). Adaptive passivity-based control of dc–dc buck power converter with constant power load in DC microgrid systems. IEEE J. Emerg. Sel. Top. Power Electron. 7 (3), 2029–2040. doi:10.1109/jestpe.2018.2874449
He, J., Liu, X., Lei, M., and Wang, C. (2020). A broad frequency range harmonic reduction for cascaded-power-cell-based islanded microgrid with lumped PCC filter. IEEE Trans. Power Electron. 35 (9), 9251–9266. doi:10.1109/tpel.2020.2970462
Jiang, W., Zhang, X., Guo, F., Chen, J., Wang, P., and Koh, L. H. (2020). Large-signal stability of interleave boost converter system with constant power load using sliding-mode control. IEEE Trans. Industrial Electron. 67 (11), 9450–9459. doi:10.1109/tie.2019.2955401
Kim, H., Kang, S., Seo, G., Jang, P., and Cho, B. (2016). Large-signal stability analysis of DC power system with shunt active damper. IEEE Trans. Industrial Electron. 63 (10), 6270–6280. doi:10.1109/tie.2016.2581150
Kwak, S., Yoo, S., and Park, J. (2014). Finite control set predictive control based on Lyapunov function for three-phase voltage source inverters. IET Power Electron. 7 (11), 2726–2732. doi:10.1049/iet-pel.2014.0044
Li, X., Jiang, W., Wang, J., Wang, P., and Wu, X. (2021). An autonomous control scheme of global smooth transitions for bidirectional DC-DC converter in DC microgrid. IEEE Trans. Energy Convers. 36 (2), 950–960. doi:10.1109/tec.2020.3020127
Liu, G., Caldognetto, T., Mattavelli, P., and Magnone, P. (2020). Suppression of second-order harmonic current for droop-controlled distributed energy resource converters in DC microgrids. IEEE Trans. Industrial Electron. 67 (1), 358–368. doi:10.1109/tie.2019.2896071
Makhamreh, H., Sleiman, M., Kükrer, O., and Al-Haddad, K. (2019). Lyapunov-based model predictive control of a PUC7 grid-connected multilevel inverter. IEEE Trans. Industrial Electron. 66 (9), 7012–7021. doi:10.1109/tie.2018.2879282
Martínez-Treviño, B. A., Aroudi, A. E., Valderrama-Blavi, H., Cid-Pastor, A., Vidal-Idiarte, E., and Martinez-Salamero, L. (2021). PWM nonlinear control with load power estimation for output voltage regulation of a boost converter with constant power load. IEEE Trans. Power Electron. 36 (2), 2143–2153. doi:10.1109/tpel.2020.3008013
Nguyen, H. T., and Jung, J. (2018). Finite control set model predictive control to guarantee stability and robustness for surface-mounted PM synchronous motors. IEEE Trans. Industrial Electron. 65 (11), 8510–8519. doi:10.1109/tie.2018.2814006
Pan, P., Chen, W., Shu, L., Mu, H., Zhang, K., Zhu, M., et al. (2020). An impedance-based stability assessment methodology for DC distribution power system with multivoltage levels. IEEE Trans. Power Electron. 35 (4), 4033–4047. doi:10.1109/tpel.2019.2936527
Parvez Akter, M., Mekhilef, S., Mei Lin Tan, N., and Akagi, H. (2016). Modified model predictive control of a bidirectional AC–DC converter based on Lyapunov function for energy storage systems. IEEE Trans. Industrial Electron. 63 (2), 704–715. doi:10.1109/tie.2015.2478752
Prabhakaran, P., and Agarwal, V. (2020). Novel boost-SEPIC type interleaved DC–DC converter for mitigation of voltage imbalance in a low-voltage bipolar DC microgrid. IEEE Trans. Industrial Electron. 67 (8), 6494–6504. doi:10.1109/tie.2019.2939991
Restrepo, C., Garcia, G., Flores-Bahamonde, F., Murillo-Yarce, D., Guzman, J. I., and Rivera, M. (2020). Current control of the coupled-inductor buck–boost DC–DC switching converter using a model predictive control approach. IEEE J. Emerg. Sel. Top. Power Electron. 8 (4), 3348–3360. doi:10.1109/jestpe.2020.2992622
Shafiee, Q., Dragičević, T., Vasquez, J. C., and Guerrero, J. M. (2014). Hierarchical control for multiple DC-microgrids clusters. IEEE Trans. Energy Convers. 29 (4), 922–933. doi:10.1109/tec.2014.2362191
Shan, Y., Hu, J., Chan, K. W., Fu, Q., and Guerrero, J. M. (2019). Model predictive control of bidirectional DC–DC converters and AC/DC interlinking converters—a new control method for PV-Wind-Battery microgrids. IEEE Trans. Sustain. Energy 10 (4), 1823–1833. doi:10.1109/tste.2018.2873390
Sharma, S., Iyer, V. M., Bhattacharya, S., Zou, K., and Kikuchi, J. (2023). Droop-based distributed secondary control method with reduced communication complexity for radial DC microgrids. IEEE J. Emerg. Sel. Top. Industrial Electron. 4 (3), 969–981. doi:10.1109/jestie.2023.3246932
Su, M., Liu, Z., Sun, Y., Han, H., and Hou, X. (2018). Stability analysis and stabilization methods of DC microgrid with multiple parallel-connected DC–DC converters loaded by CPLs. IEEE Trans. Smart Grid 9 (1), 132–142. doi:10.1109/tsg.2016.2546551
Tabari, M., and Yazdani, A. (2014). Stability of a dc distribution system for power system integration of plug-in hybrid electric vehicles. IEEE Trans. Smart Grid 5 (5), 2564–2573. doi:10.1109/tsg.2014.2331558
Vafamand, N., Khooban, M. H., Dragičević, T., and Blaabjerg, F. (2019). Networked fuzzy predictive control of power buffers for dynamic stabilization of DC microgrids. IEEE Trans. Industrial Electron. 66 (2), 1356–1362. doi:10.1109/tie.2018.2826485
Wu, W., Chen, Y., Luo, A., Zhou, L., Zhou, X., Yang, L., et al. (2017). A virtual inertia control strategy for DC microgrids analogized with virtual synchronous machines. IEEE Trans. Industrial Electron. 64 (7), 6005–6016. doi:10.1109/tie.2016.2645898
He, Y., Tang, T., and Blaabjerg, F. (2013). A new design method for the passive damped LCL and LLCL filter-based single-phase grid-tied in-verter. IEEE Trans. Industrial Electron. 60 (10), 4339–4350. doi:10.1109/tie.2012.2217725
Xiong, Y., Ye, Y., Cao, Y., and Wu, Y. (2020). Separate-structure UDE-based current resonant control strategy on $LCL$-Type grid-tied inverters with weighted average current method for improved injected current quality and robustness. IEEE Trans. Power Electron. 35 (12), 13641–13651. doi:10.1109/tpel.2020.2994575
Xu, Q., Zhang, C., Wen, C., and Wang, P. (2019). A novel composite nonlinear controller for stabilization of constant power load in DC microgrid. IEEE Trans. Smart Grid 10 (1), 752–761. doi:10.1109/tsg.2017.2751755
Ye, Q., Mo, R., and Li, H. (2017). Low-frequency resonance suppression of a dual-active-bridge DC/DC converter enabled DC microgrid. IEEE J. Emerg. Sel. Top. Power Electron. 5 (3), 982–994. doi:10.1109/jestpe.2017.2700258
Zhang, L., and Ruan, X. (2019). Control schemes for reducing second harmonic current in two-stage single-phase converter: an overview from dc-bus port-impedance characteristics. IEEE Trans. Power Electron. 34 (10), 10341–10358. doi:10.1109/tpel.2019.2894647
Zhang, Y., Qu, X., Wang, G., Chen, W., and Huang, Z. (2022). Investigation of multiple resonances and stability enhancement in multi-source DC distribution power systems. IEEE J. Emerg. Sel. Top. Circuits Syst. 12 (1), 90–97. doi:10.1109/jetcas.2022.3146875
Keywords: DC distribution system, stability analysis, hybrid control algorithm, model predictive control, resonance suppression
Citation: Zheng Z, Wu X, Zheng F, Liu B and Liang N (2023) Resonance suppression strategy of DC distribution system based on reduced-order hybrid control algorithm. Front. Energy Res. 11:1260678. doi: 10.3389/fenrg.2023.1260678
Received: 18 July 2023; Accepted: 16 August 2023;
Published: 04 September 2023.
Edited by:
Kaiping Qu, China University of Mining and Technology, ChinaCopyright © 2023 Zheng, Wu, Zheng, Liu and Liang. This is an open-access article distributed under the terms of the Creative Commons Attribution License (CC BY). The use, distribution or reproduction in other forums is permitted, provided the original author(s) and the copyright owner(s) are credited and that the original publication in this journal is cited, in accordance with accepted academic practice. No use, distribution or reproduction is permitted which does not comply with these terms.
*Correspondence: Feng Zheng, emZfd2h1QDE2My5jb20=