 Wenyu Zhang1
 Yuyuan Zhang
95% of researchers rate our articles as excellent or good
Learn more about the work of our research integrity team to safeguard the quality of each article we publish.
Find out more
ORIGINAL RESEARCH article
Front. Energy Res. , 03 October 2023
Sec. Sustainable Energy Systems
Volume 11 - 2023 | https://doi.org/10.3389/fenrg.2023.1260251
This article is part of the Research Topic Modeling Practice and Mechanism Design of Green Energy Systems towards Sustainable Development View all 18 articles
As the main body of resource aggregation, Virtual Power Plant (VPP) not only needs to participate in the external energy market but also needs to optimize the management of internal resources. Different from other energy storage, hydrogen energy storage systems can participate in the hydrogen market in addition to assuming the backup supplementary function of electric energy. For the Virtual Power Plant Operator (VPPO), it needs to optimize the scheduling of internal resources and formulate bidding strategies for the electric-hydrogen market based on external market information. In this study, a two-stage model is constructed considering the internal and external interaction mechanism. The first stage model optimizes the operation of renewable energy, flexible load, extraction storage, and hydrogen energy storage system based on the complementary characteristics of internal resources; the second stage model optimizes the bidding strategy to maximize the total revenue of the electricity energy market, auxiliary service market and hydrogen market. Finally, a typical scenario is constructed and the rationality and effectiveness of the strategy are verified. The results show that the hybrid VPP with hydrogen storage has better economic benefits, resource benefits and reliability.
With the implementation of China’s “double carbon” strategy, new energy sources such as wind power and photovoltaic will see more rapid development, and the penetration rate of new energy sources will continue to increase, which will increase the impact of new energy power fluctuations on the safety and stability of microgrid and its access system and the difficulty of operation and scheduling (Ashish et al., 2021). On the one hand, the uncertainty of renewable energy power generation puts higher demands on the grid’s regulation capacity, and smoothing the volatility and indirectness of renewable energy power generation is an urgent problem to be solved. On the other hand, with the increasing installed capacity of renewable energy, the phenomenon of abandoning wind, light and water is getting more and more serious, and the full consumption of renewable energy and the improvement of energy utilization efficiency is also one of the challenges being faced (Huang et al., 2021; Liu et al., 2021). As a smart energy system, VPP has the characteristics of bidirectional trend, which can be used as a controllable power source to strengthen the power supply capacity to the grid and carry out peak regulation, and as a controllable load to increase the power consumption with the system to achieve the valley filling, smooth the system output and demand, and provide a guarantee for the stability of the power system (Nosratabadi et al., 2017; Saleh Sadeghi et al., 2022; Chen et al., 2023). In addition to providing security for the operation of the power system to obtain compensation revenue, VPPs can also participate in the power market at all levels as a flexible resource for capacity, power, and ancillary services to obtain economic benefits through market transactions (Dai et al., 2022). Energy storage can make up for the inherent defects of new energy in terms of random volatility and fundamentally solve the problem of a high percentage of new energy consumption. The charging and discharging characteristics of energy storage can smooth out the system power fluctuations, improve the new energy consumption capacity, reduce the frequency of power fluctuation impact of a microgrid on its access system, and realize the friendly grid connection of microgrid (Li et al., 2021). Hydrogen storage enables the smooth operation of power systems through the conversion of hydrogen energy to electrical energy. When electricity is sufficient, the technology of hydrogen production by electrolysis of water is used to make full use of electricity by storing hydrogen; when electricity output is insufficient, the stored hydrogen energy can be used by hydrogen fuel cells or hydrogen combustion turbines to re-generate electricity and return to the system. As a clean and efficient energy source, hydrogen energy storage can play an important role in VPPs (Furat et al., 2022; Qiu et al., 2022).
The research on energy storage in VPPs mainly includes market participation strategy, capacity allocation, optimal scheduling, and benefit allocation. This study focuses on the research from the perspective of market strategy for VPP.
Many scholars have researched the strategy of VPPs participating in the power market. VPPs as flexible resource-rich subjects can play an important role in the electricity market (Shafiekhani et al., 2019). In addition, with the development of integrated energy systems, multi-energy complementarity has gradually become a trend for resource optimization within VPPs, which can also participate in multi-energy markets as independent subjects (Naughton et al., 2020; Ju et al., 2022). The current research on the participation of VPPs in the electricity market mainly includes the design of market mechanisms (Ahmad, 2022; Morteza et al., 2022) and the study of trading strategies (Tang and Yang, 2019; Dai et al., 2022; Zheng et al., 2022). For example, Rahimi Mahdi et al. constructed a VPP with wind turbines, PV, conventional generators, energy storage systems, and controllable loads and proposed a strategy for VPP participation in day-ahead and real-time electricity markets considering demand response (Mahdi et al., 2022). Bo Li et al. proposed a market participation strategy and compared the benefits of VPPs with and without energy storage to participate in electricity energy markets and ancillary services markets (Li and Ghiasi, 2021). Alahyari, Arman, et al. constructed a VPP consisting of wind power, energy storage, and flexible load, and proposed an optimization strategy considering the stochasticity of renewable energy output and the uncertainty of electricity market price uncertainty (Alahyari et al., 2020). Henao, MM et al. proposed a bidding strategy for VPP participation in the market while determining the optimal size of the energy storage system (Henao Michelle and Oviedo Jairo José, 2022). Appino, Riccardo R et al. considered the uncertainty of renewable energy output and the volatility of energy prices to optimize the strategy of VPPs with hydrogen energy storage participating in the real-time electricity market (Han et al., 2021). The above studies take VPP bidding as the research object and put forward a two-tier strategy of internal resource optimization and energy management considering uncertainty. Specifically, these studies only consider VPPS ‘strategies for participating in the electricity market, ignoring the multiple energy attributes of VPPS.
Some scholars have also considered how a multi-energy coupled VPP can participate in a multi-energy market. For example, Zhang, Tao et al. introduced a VPP consisting of a natural gas network, power-to-gas equipment, flexible loads, and energy storage, and studied an optimization model considering dual energy markets by developing different scenarios (Zhang and Hu, 2022). Ju Liwei et al. constructed a VPP including cogeneration units, wind turbines, power and thermal storage systems, and controllable loads, and considered the impact of different energy market price fluctuations on the profit risk of VPP (Ju et al., 2022). Liu Xiaoou constructed a VPP operation model including wind turbines, electric vehicles, gas turbines, and controllable loads, and constructed an optimal carbon-electricity integration bidding strategy for VPPs by further analyzing the carbon-electricity integration market characteristics (Liu, 2022).
Although many studies have considered the strategy of VPP participation in multi-energy markets, the role of electric energy storage in a single electricity market is still only considered for energy storage resources in VPP (mainly electric energy storage resources, excluding thermal and gas storage devices). Unlike electrochemical energy storage, hydrogen energy storage can participate not only in the electric market but also in the hydrogen market. However, few studies have been conducted to evaluate the participation of hydrogen energy storage systems in VPPs. Unlike other energy storage systems, HSSs can not only fully consume the abandoned wind, light, and water resources as energy storage to ensure power supply, but also serve as a source of hydrogen feedstock to enhance the added value within the system and improve the ability of VPPs to participate in external markets (Zheng et al., 2020; Liu, 2022).
Most of the above studies have considered how VPPs without hydrogen energy storage participate in the power market or multi-energy market, and few studies have explored the role of hydrogen energy storage systems in VPPs and how VPPs with hydrogen energy storage participate in the multi-energy market. In this study, the resource complementary characteristics of renewable energy, flexible load, pumped storage, and hydrogen storage are considered, a two-layer optimization model is constructed, and an external multi-energy market bidding and internal resource optimization strategy are proposed. The structure of the VPP is shown in Figure 1.
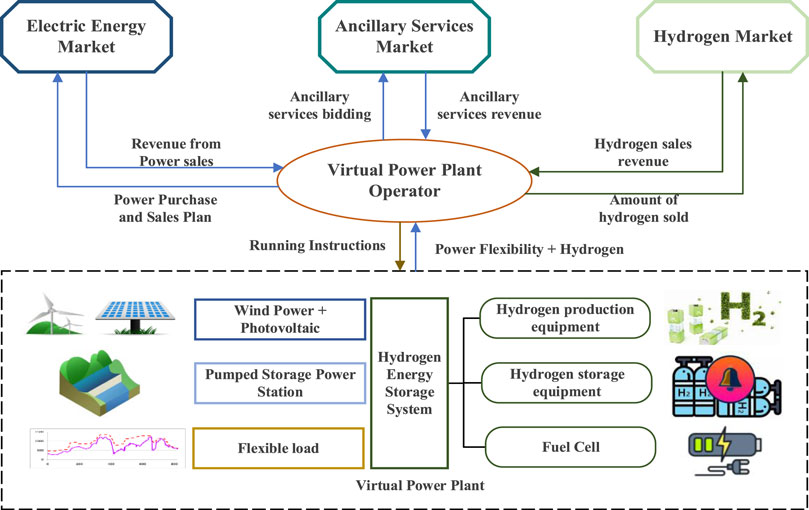
FIGURE 1. Schematic diagram of VPP structure.
The VPP consists of renewable energy generating units, pumped storage plants, flexible loads, and HSSs. The VPP operator collects market information and gives operating instructions to the VPP. The VPP optimizes its internal resources through the instructions given by the VPP operator.
Traditionally, the VPP participates in the power market mainly through peak-hour sales on the power side, peak-to-valley arbitrage on the energy storage side, and demand response on the load side to provide ancillary services.
In this study, the VPP participates in the day-ahead energy market and the peaking auxiliary service market and participates in the day-ahead power market as a price receiver. After obtaining the market information (purchase and sale prices, peak and valley hours, etc.) of the energy market and the peaking market (peak hours and peak compensation prices for peak filling and peak shaving) released by the power dispatching agency, the VPP coordinates its internal resources according to the bidding strategy. After coordinating internal bidding resources according to the bidding strategy, the company further adjusts the bidding plan in the energy market and the peaking market through optimization and reports the information on the electricity bidding in the energy market and the peaking market to the power dispatching agency. Both HSSs and pumped storage plants can participate in the peaking auxiliary service market, but for HSSs, the total amount of resources for their participation in either the electric auxiliary service market or the hydrogen market is fixed, so decisions need to be made based on prices.
The possible innovations and contributions of this study are as follows.
(1) The application of hydrogen energy storage systems in VPPs is explored.
(2) The participation of VPPs in external markets and the optimization of internal resources are both considered.
(3) The role of a combined clean energy storage strategy for participation in multiple markets is considered for VPP.
(4) The impact of energy market price changes on the market participation strategy of VPPs is evaluated.
The rest of this paper is structured as follows: Section 2 constructs a two-layer model of VPP participation in the electricity-hydrogen market. Case studies are performed and analyzed in Section 3. Section 4 highlights the conclusions.
The goal for the VPP operator is to maximize total system revenue, which includes revenue from the sale of electricity in the energy market, revenue from the provision of ancillary services, and revenue from the sale of hydrogen in the hydrogen market.
Where
Among them, regulating peak auxiliary services are further divided into peak-shaving auxiliary services and valley-filling auxiliary services, and the service prices of peak-shaving auxiliary services and valley-filling auxiliary services are different, therefore, the revenue that VPP operators can obtain by providing auxiliary services can be refined into the following model.
VPPO’s bids in the energy and ancillary services markets affect each other, and the limited and fixed flexibility resources available to VPPs require VPP operators to choose the allocation of resources between the energy and ancillary services markets.
where
For the lower-layer model of the VPP, the objective is to minimize the total system operating cost. Its system operating costs
Among them,
To realize the full consumption of wind power and PV, VPP keeps the corresponding positive and negative standby to cope with the deviation of wind power and PV output through a pumped storage power station and flexible load.
Where
The wind power output constraints are as follows.
The photovoltaic output constraint is as follows.
The power output constraint of the pumped storage power plant is as follows.
Among them, pumped storage power plants are not pumped storage and discharge at the same time.
The hydrogen energy storage system output constraints are as follows.
The cumulative hydrogen storage capacity of the hydrogen storage facility satisfies the following constraints.
The electrolysis tank and the fuel cell do not work simultaneously.
For pumped storage plants and HSSs, frequent start-ups and shutdowns not only increase the cost but also affect the normal use of the equipment and increase the wear and tear of the equipment. Therefore, the number of starts and stops of energy storage systems in a typical operating day needs to be kept within a reasonable range.
For flexible loads, the following peaking constraints are satisfied.
In this study, a combination of particle swarm optimization (PSO) algorithm and Cplex solver is used to solve the problem as shown in Figure 2, which is implemented in the MATLAB 2019a platform. The particle swarm algorithm has been widely used as one of the heuristic algorithms for solving optimization problems. Compared with other heuristics such as genetic algorithm (GA) and ant colony optimization (ACO), the PSO algorithm enhances global and local exploration capabilities through a flexible and balanced mechanism. The specific process is as follows.
(1) Initialize the particles, given the initialized velocity and position for each particle in the upper model for the decision variables of the electric energy market bid volume, the auxiliary service market bid volume, and the hydrogen market bid volume.
(2) The lower layer Cplex solver optimizes the internal resources of the VPP according to the lower layer objective function to obtain the optimal power purchase and sale strategy and updates the number of flexibility resources within the VPP to feedback to the upper layer.
(3) The upper-layer particle swarm algorithm updates the bid quantity based on the flexibility resource quantity fed back from the lower layer and calculates the total revenue to evaluate the change in total revenue.
(4) If the model has reached the termination condition, the optimization search process ends and the algorithm terminates; otherwise, the velocity and position of the particles are updated and return to step (2).
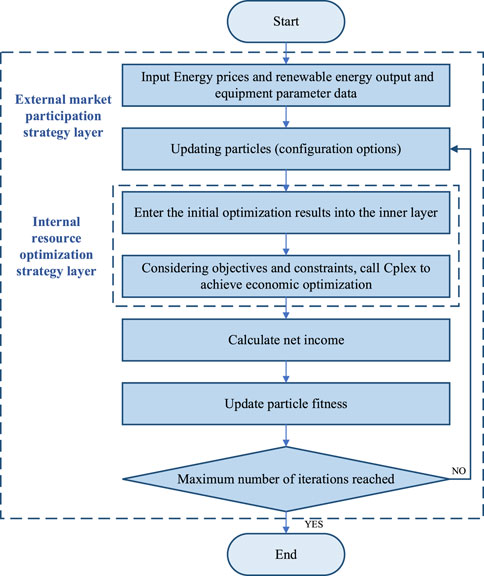
FIGURE 2. Method flow chart.
Since it is difficult for VPPs to influence market prices in both the electricity and hydrogen markets, this paper sets VPPs as recipients of market prices and makes decisions on quoted quantities based on price information. In this paper, the VPP operator rationalizes the allocation of flexibility resources within the VPP by aggregating them according to the demand of the power dispatching agency and the price information obtained from the power market and the hydrogen market to achieve the maximum total system revenue. Renewable energy generation, flexible loads, pumped storage plants, and HSSs can all participate in the peaking demand of the power market, and HSSs can also participate in the hydrogen market. The peaking periods and the prices of power purchase and sale and auxiliary services are shown in Figure 2. VPPs can participate in the electricity energy market in all 24 time periods.
The price of the electricity market is shown in Figure 3. According to the output characteristics of wind power and PV and load demand characteristics, four typical days in spring, summer, autumn, and winter are selected in this study, as shown in Figure 4.
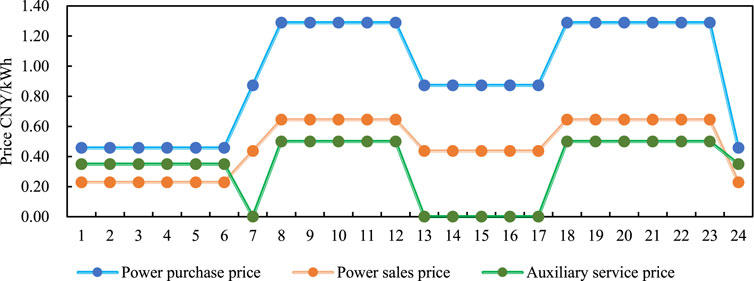
FIGURE 3. Price parameters.
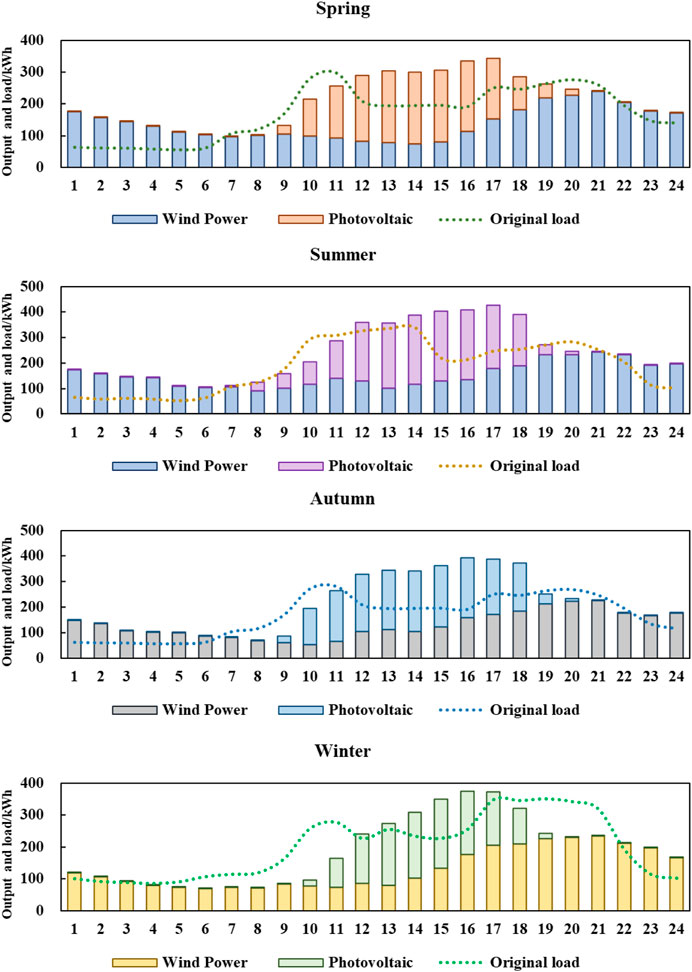
FIGURE 4. Typical daily output and load.
In this paper, the maximum adjustment of the flexible load is set to 20% of the load in that period. The access condition of the auxiliary service market is that the single-day bidding power is not less than 5,000 kW. During the peak-shaving period, the maximum power purchase of the VPP is 250 kWh. The other parameters of this paper are set as shown in Table 1.
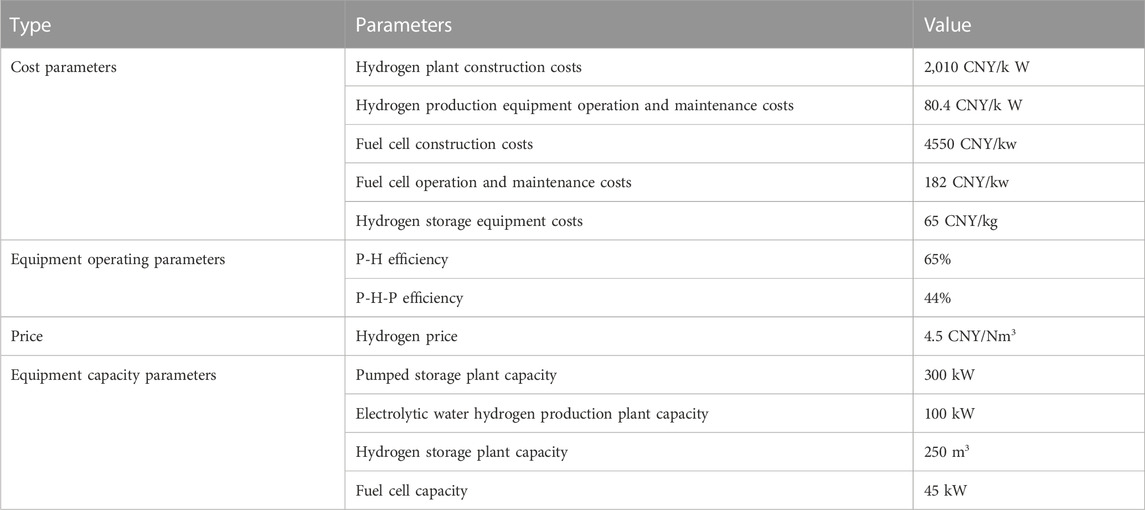
TABLE 1. Parameter table.
Based on the participation of subjects within the VPP and the combination strategy of clean energy storage, four typical scenarios are constructed in this study, as shown in Table 2 below.
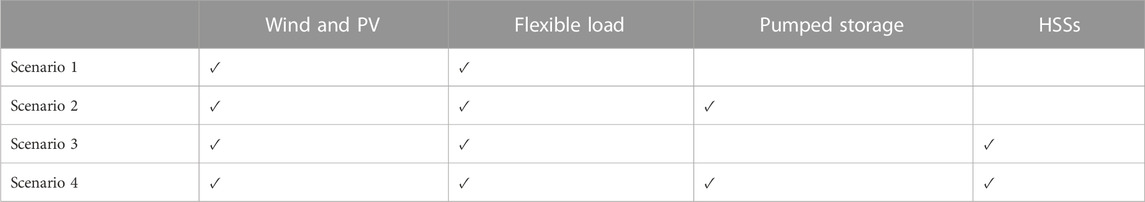
TABLE 2. Scenarios design.
In order to quantitatively analyze the effectiveness and applicability of the PSO algorithm to solve the model built in this paper, the GA and ACO algorithms are selected as a comparison, and their running time, iteration times, and result efficiency are compared. Since there are many scenarios involved in this paper, Case 4 (spring) is taken to verify the effectiveness of the proposed solution algorithm as shown in Figure 5.
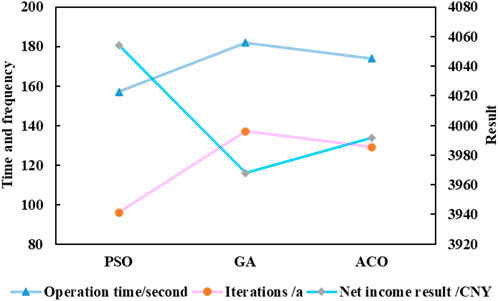
FIGURE 5. Comparison results of different algorithms.
Figure 6 shows the bidding results of the electric energy market. The bidding results of scenario 1 and scenario 2 in the electricity energy market in different seasons are consistent. There are two reasons for this: First, pumped storage does not directly participate in the upper grid electric energy market, but provides ancillary services by prioritizing the optimization of resources within the VPP and reducing the flexible load, because the price of purchasing power is higher than the price of sold power. Reducing power purchases is the strategy that achieves the greatest total net benefits. Second, in both Scenario 1 and Scenario 2 renewable energy generation provides electric energy services during normal and peak periods. For pumped storage, the price difference between peak and flat hours does not make it profitable, so renewable energy generation participates in the electricity energy market during normal hours. The bidding results for Scenario 3 and Scenario 4 are the same and lower than Scenario 1 and Scenario 2 in different seasons. After aggregating hydrogen storage, the total revenue obtained from hydrogen production through wind power and PV in the ordinary period is higher than the revenue from electricity sales by participating in the electricity energy market. Therefore, for scenarios 3 and 4, renewable energy generation in the normal period does not participate in the electricity market.
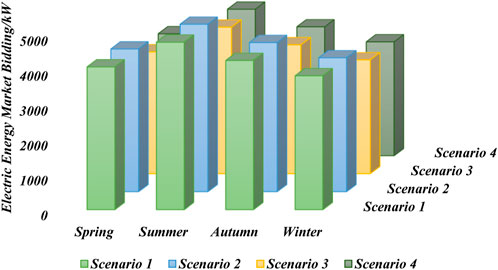
FIGURE 6. Electric energy market bidding results.
The bidding results of typical days in different seasons under different scenarios are shown in Figure 7. It can be seen that in scenario 1, with only renewable energy generation and flexible load participating in the ancillary services, the benchmark conditions for the ancillary services market can barely be met only in summer. In the other three seasons, VPP cannot participate in the ancillary services market, but only in the electric energy market and the hydrogen market. In the case of aggregated single hydrogen storage (scenario 3), VPP can participate in the ancillary services market only in summer and autumn and barely meets the benchmark conditions in autumn. In spring, it comes close to meeting the auxiliary service benchmark conditions. In contrast, for scenarios 2 and 4, VPP can participate in the ancillary services market in all four seasons, mainly because of the larger capacity of the aggregated pumped storage plant compared to just the aggregated HSS. The regulation capacity is stronger when both pumped storage power plants and hydrogen storage participate in the auxiliary service market.
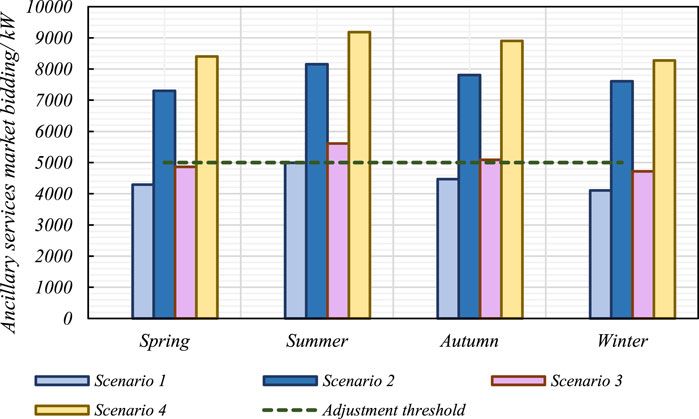
FIGURE 7. Ancillary services market bidding results.
Figure 8 shows the auxiliary service market bidding by specific periods. The positive value indicates participation in peak-shaving auxiliary services, and the negative value indicates participation in valley-filling auxiliary services. In Scenario 1, since the energy storage system is not aggregated, the valley filling capacity is only realized through flexible load demand response, so the auxiliary service capacity is low. The peak-shaving auxiliary service is mainly satisfied by wind power and photovoltaic power output. Since VPP in Scenario 1 only reaches the peak-shaving benchmark in summer, it can only participate in the auxiliary service bidding in summer. Unlike Scenario 1, VPP can participate in auxiliary services in all seasons in Scenario 2. In addition, it can be seen that both the valley filling capacity and peak shaving capacity of Scenario 2 are better than that of Scenario 1. This is because by aggregating pumped storage plants in Scenario 2, VPP can provide valley filling service through pumped storage to purchase electricity from the distribution network in the valley filling auxiliary service phase and reduce the demand for the flexible load to the upper grid through pumped storage in the peak shaving auxiliary service phase. In addition, pumped storage can achieve peak-to-valley arbitrage through peak-to-valley price difference. Compared to Scenario 2, the auxiliary service capability of the VPP alone aggregated HSS in Scenario 3 is inferior. This is because the capacity of the pumped storage plant and the HSS aggregated by the VPP are different, and the capacity of the HSS is only one-third of the pumped storage. However, it can be seen that compared to Scenario 1, after aggregating the HSS, the VPP can participate in the auxiliary service market in both summer and autumn, and its peak-shaving and valley-filling capacity is slightly improved. In scenario 4 where VPP aggregates HSS and pumped storage power plant at the same time, the auxiliary service capacity is significantly increased.
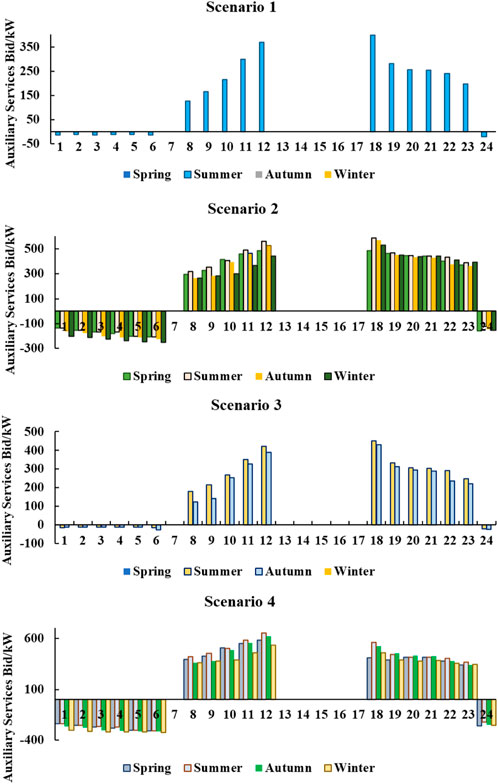
FIGURE 8. Ancillary services market bidding results by period.
The results of the hydrogen market bidding are shown in Figure 9. It can be seen that VPP does not participate in the hydrogen market bidding in scenario 3 in both summer and fall, which is because the VPP reaches the threshold for bidding in the ancillary services market after aggregating hydrogen storage resources. Since the overall benefits of energy storage participation in the electricity energy market and ancillary services market are higher than those in the hydrogen market, all of the hydrogen storage in this scenario is used to participate in the electricity market by aggregating resources within the VPP. Unlike summer and fall, it is difficult for VPPs with only aggregated HSSs in spring and winter to meet the entry threshold for the ancillary services market. When it is impossible to participate in the auxiliary service market, the benefit of just participating in the electric energy market is lower than the benefit of participating in the hydrogen market, so all the hydrogen is used to participate in the hydrogen market.
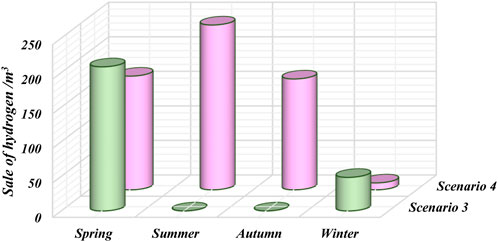
FIGURE 9. Hydrogen market bidding results.
Compared to scenario 3, in scenario 4 when VPP aggregates both pumped storage and HSSs, the threshold for ancillary services can be reached in all four seasons. The pumped storage system is prioritized to meet the electricity demand, and the HSS can be used to trade in the hydrogen market after meeting the output of the auxiliary service threshold. Therefore the hydrogen market bidding volume for Scenario 4 is higher than that of Scenario 3.
Figure 10 shows the demand response of the flexible load. The higher demand response during peak hours in summer and winter is attributed to the maximum purchasable power designed in this paper. If the flexible load is still larger than the maximum purchasable power after the demand response, the loss of load phenomenon will occur and the energy storage output is needed to compensate.
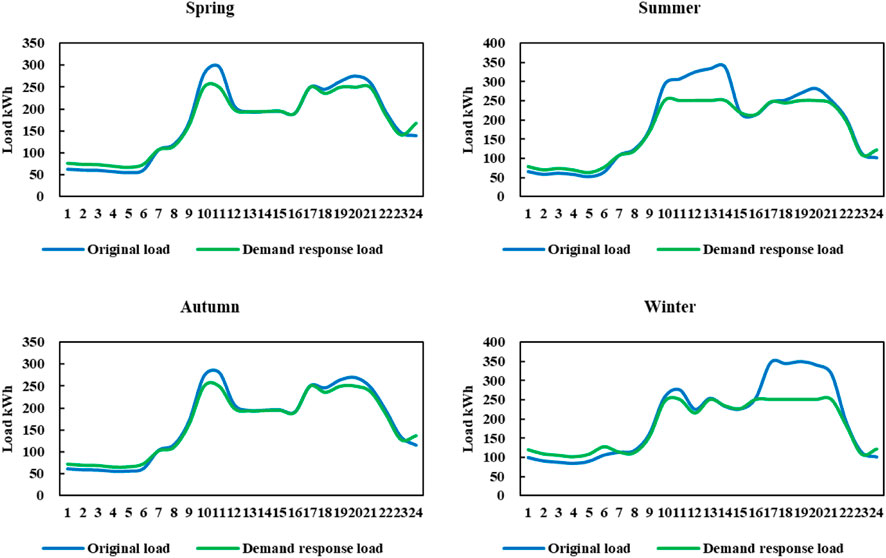
FIGURE 10. Demand response results for flexible loads.
Figure 11 shows the charging and discharging of the pumped storage power plant on a typical day. The pumped storage power plant gives priority to consuming abandoned electricity from renewable energy sources, and if the capacity limit of the pumped storage power plant has not yet been reached, it can buy electricity in the distribution network to achieve peak-valley arbitrage. It can be seen that pumped storage power plants store energy in the valley hours and discharge it in the peak hours. Since pumped storage power plants operate consistently in all seasons, the summer season is used as an example.
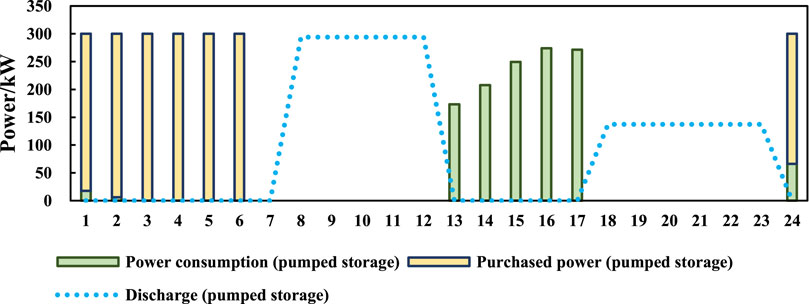
FIGURE 11. Charging and discharging of the pumped storage power station.
As shown in Figure 12, the operation of the HSS is consistent in spring and winter, and summer and fall. In spring and winter, since the VPP cannot participate in the ancillary services market, the fuel cells of the HSS do not work and all the hydrogen produced is used for storage and traded in the hydrogen market on the second day. In summer and fall, VPP can participate in the ancillary services market, and the hydrogen produced by the HSS is first used by the fuel cell, and the excess hydrogen is sold in the market.
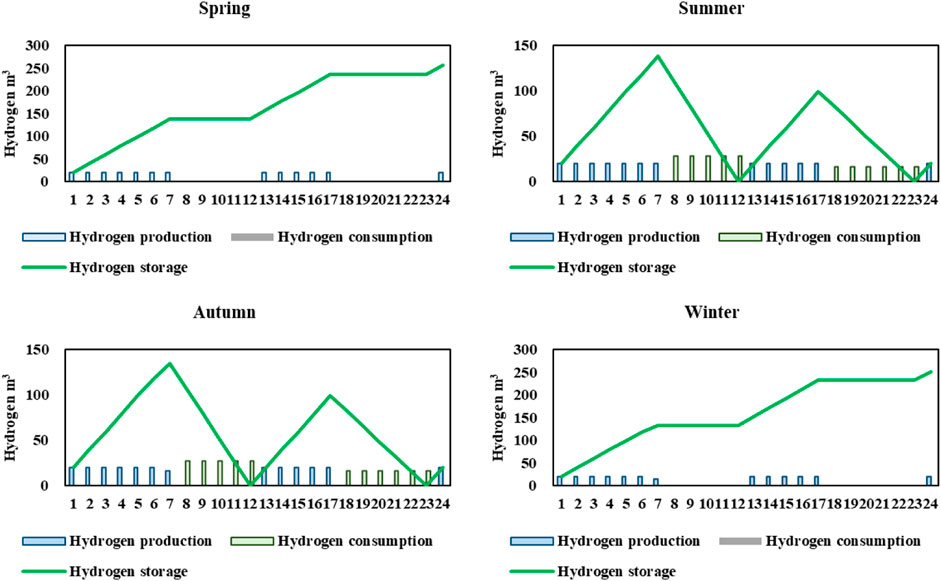
FIGURE 12. Hydrogen production, storage, and utilization.
According to Figure 13, it can be seen that the HSS does not generate electricity in spring and winter. In the summer and autumn peak hours, electricity is generated in the valley, and during flat hours electricity is consumed to produce hydrogen. In addition, the HSS purchases electricity to produce hydrogen during the flat hours in both autumn and winter because the maximum capacity limit of the hydrogen production unit has not yet been reached after consuming the abandoned electricity.
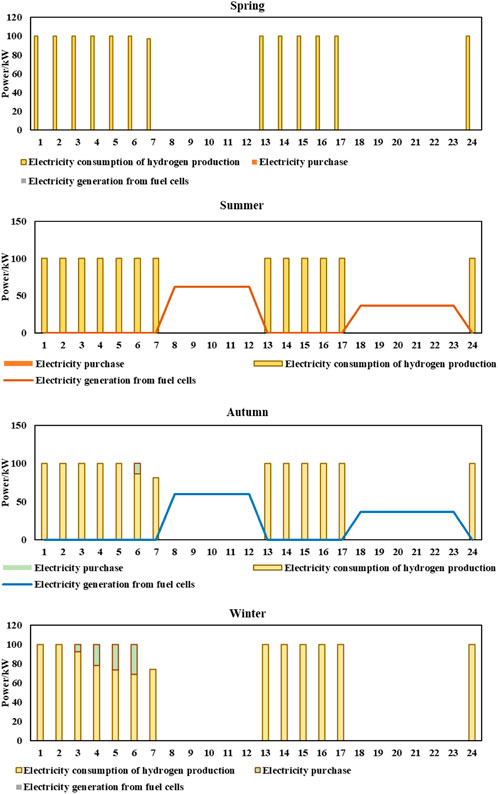
FIGURE 13. Charging and discharging of hydrogen energy storage system.
According to Figure 14, during the valley hours, the abandoned electricity from renewable energy sources is used for hydrogen production in priority, and the excess abandoned electricity is used for pumped storage power plants. Due to the capacity of the pumped storage plant, it gives priority to consuming the abandoned power, and the part that has not yet reached the capacity limit can be satisfied by purchasing power in the grid. The renewable energy output in flat hours is used for the HSS and pumped storage power station because the sum of the reduced power purchase cost and auxiliary service revenue is higher than the revenue from power sales in the electricity energy market. During peak hours, the VPP prioritizes the consumption of pumped storage energy, and when the pumped storage energy does not meet the demand, the fuel cell starts to make up for the shortfall. This is because pumped storage power plants can only gain revenue through the electricity market, while HSSs can gain revenue from both auxiliary services and the hydrogen market. The revenue of HSS participating in the electric energy market and auxiliary service market is lower than its participation in the hydrogen market, but the sum of the reduction of the power purchase cost and the increase of auxiliary service revenue due to the generation of HSS in peak hours is higher than the revenue in the hydrogen market, so the HSS chooses to participate in the hydrogen market based on meeting the load demand in peak hours.
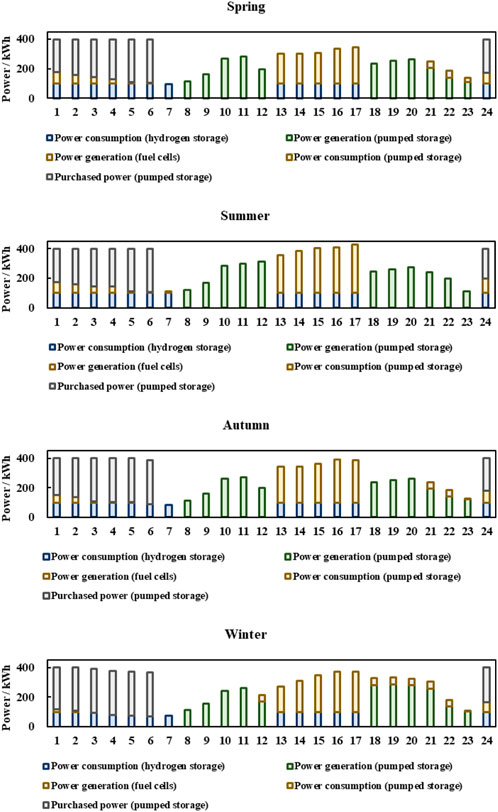
FIGURE 14. Charging and discharging of combined energy storage.
As shown in Figure 15, the situation tends to be consistent in spring and autumn, with hydrogen consumption for fuel cell generation in the second peak hour, due to the priority use of pumped storage generation and fuel cell start-up to make up for the shortfall when pumped storage cannot meet the load demand. It can be seen that in summer, the fuel cell does not work because the pumped storage power plant output is sufficient to match the flexible load during peak hours. In winter, the fuel cell starts working in the first peak hour because the pumped storage power plant output is difficult to meet the load demand. Compared to the other three seasons, the amount of hydrogen stored in winter is close to zero at the end of a typical day. This is due to the high load demand in winter when hydrogen production is almost entirely used for fuel cells and no excess hydrogen is traded in the hydrogen market.
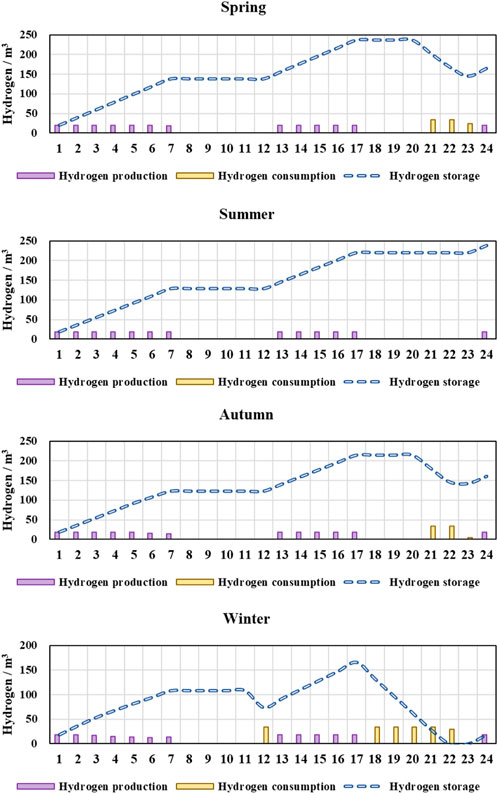
FIGURE 15. Hydrogen production, storage, and utilization.
Table 3 shows the total revenue of the VPP for a typical day in spring. 1) In terms of revenue in the electricity market, scenario 3 has the lowest revenue because both scenario 1 and scenario 3 do not reach the peaking benchmark of the ancillary services market and cannot participate in the ancillary services market but only in the electricity energy market. For scenario 3, the revenue of renewable energy generation for hydrogen production in flat hours is higher than the revenue from participating in the electricity energy market, so the revenue of the electricity energy market for scenario 3 is lower than that of scenario 1. 2) The hydrogen revenue of scenario 3 is greater than that of scenario 4. In scenario 3, VPP has not reached the threshold of the electricity auxiliary service market, and the hydrogen revenue from HSS is greater than the revenue from electricity sales of fuel cells based on meeting the load demand. As for scenario 4, because VPP has reached the auxiliary service benchmark condition, the revenue from auxiliary service is greater than the revenue from hydrogen sales, so the excess hydrogen from HSS is only used for trading in the hydrogen market on the premise of maximizing the demand for auxiliary service that can be participated. 3) The power purchase cost of scenario 3 is higher than that of scenario 2 because the capacity of HSS is lower than that of pumped storage. 4) Compared to Scenario 2 and Scenario 4, Scenario 3 still has the abandonment penalty due to the capacity of the HSS. 5) After aggregating the energy storage system, there is no load loss in the VPP. The revenue for a typical winter day is shown in Table 4 and is similar to that of spring.
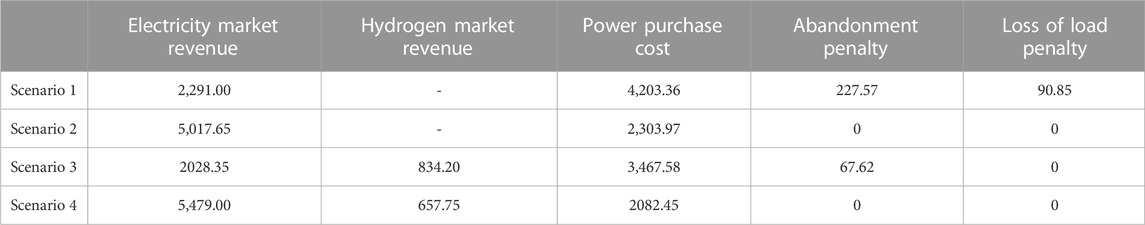
TABLE 3. Total bidding revenue for a typical spring day/CNY.
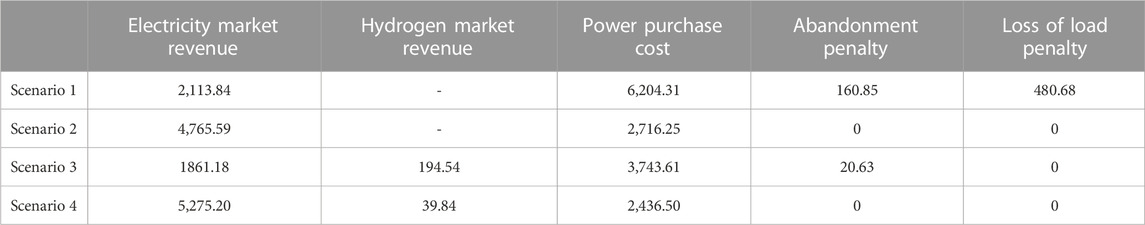
TABLE 4. Total bidding revenue for a typical winter day/CNY.
According to Tables 5, 6, the situation is similar in summer and autumn. 1) In the summer of Scenario 1, VPP can participate in the auxiliary service market so its revenue in the electricity market is higher than that in the autumn; 2) Compared with the spring, in the summer and autumn of Scenario 3, VPP can participate in the auxiliary service market so its revenue is higher than that in Scenario 1, but its revenue is lower than that in Scenario 2 due to the capacity of the HSS; 3) There is no revenue in the hydrogen market in both the summer and fall, which is because the sum of the power purchase cost to compensate for the reduction of flexible load demand and the revenue from ancillary services is higher than the income in the hydrogen market, so all the hydrogen is used for fuel cells.
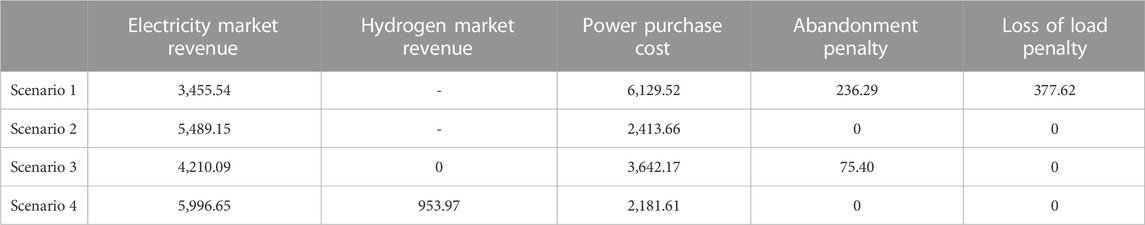
TABLE 5. Total bidding revenue for a typical summer day/CNY.
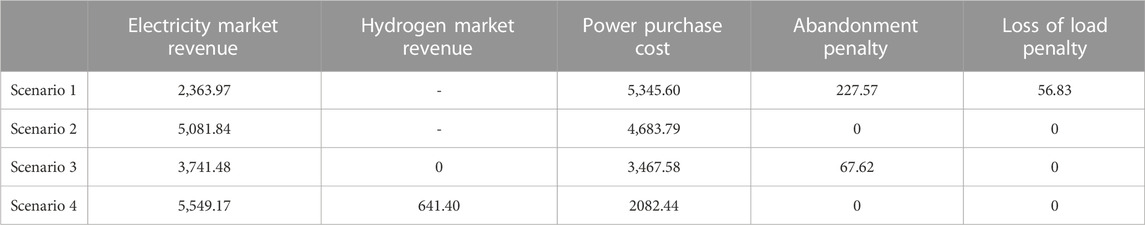
TABLE 6. Total bidding revenue for a typical autumn day/CNY.
Restricted by the electricity market, wind power, and PV can only provide auxiliary services during peak-shaving service hours. During valley hours and flat hours, there will be power abandonment because the superior grid has a strong supply capacity itself and does not need additional power output. According to Figure 16, there is no power abandonment in Scenario 2 and Scenario 4, because compared with Scenario 1, VPP aggregates energy storage resources and can fully utilize the resources of wind and PV. In scenario 3, the VPP still has the abandonment phenomenon, which is limited by the capacity of the aggregated hydrogen storage, but the abandonment phenomenon is significantly alleviated compared to scenario 1.
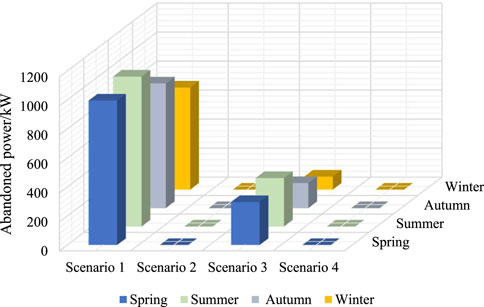
FIGURE 16. Abandoned power.
As shown in Figure 17, the VPP will have a loss of load only in Scenario 1. Due to the limitation of the power available to be purchased from the grid, there will be load loss during peak hours because the VPP load demand is higher than the power available to be purchased. In other scenarios, there is no load loss because the VPP aggregates energy storage resources and can cover its power shortfall.
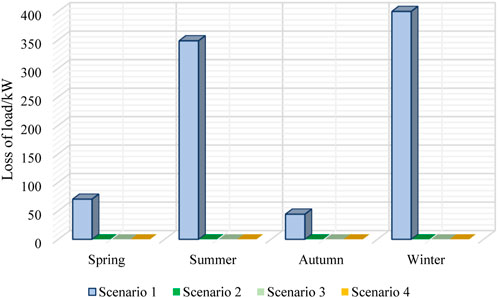
FIGURE 17. Loss of load.
Figure 18 shows the sensitivity analysis of the changes in electricity and hydrogen prices. The market participation strategy of the VPP changes as a result of price changes in the electricity and ancillary services markets and the hydrogen market. In Scenario 1 and Scenario 2, a single change in electricity market price causes a linear change in total revenue because no hydrogen market is involved. In scenarios 3 and 4, total revenue does not show a linear change due to changes in the electricity market price as well as the hydrogen market price. The VPP chooses the optimal strategy that maximizes the total revenue due to the changes in hydrogen and electricity prices, which implies a change in the proportion of hydrogen resources participating in the electricity and hydrogen markets based on the existing prices. In addition, as the prices in the electricity and hydrogen markets increase simultaneously, the total revenue does not always increase, but peaks at a certain price. This is because the amount of hydrogen resources allocated in the electricity market and the hydrogen market does not change when the electricity price and the hydrogen price increase in the same proportion. But when the price changes in the electricity market and the hydrogen market in different proportions, hydrogen resources do not necessarily prioritize the demand for ancillary services, but rather tilt more resources to the higher-priced hydrogen market.
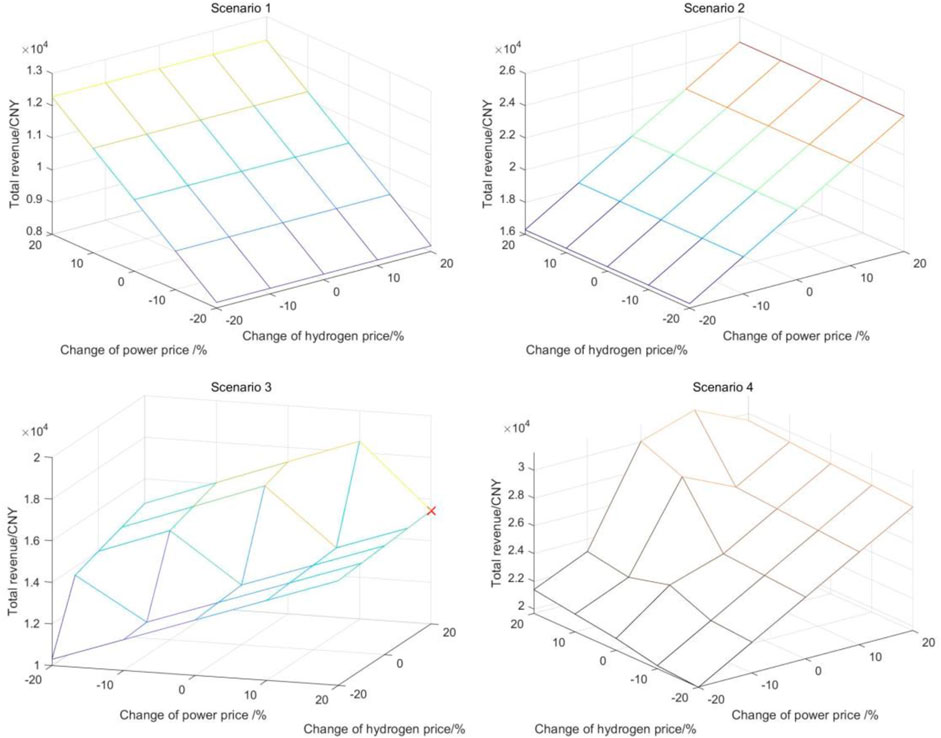
FIGURE 18. Sensitivity analysis of the prices.
This paper investigates the bidding strategy for a VPP in the electricity and hydrogen markets and constructs a two-layer model that considers the bidding strategy and internal resource operation optimization strategy based on the complementary characteristics of renewable power, flexible load, pumped storage, and hydrogen storage resources. The internal resources are optimally dispatched and the optimized flexibility capability is fed back to the VPP operator to adjust the bidding strategy until the optimal bidding strategy is achieved, taking into account the objectives of maximizing the total revenue of the VPP to participate in the external market and minimizing the internal abandonment penalty and load loss penalty. In this paper, the particle swarm algorithm combined with the Cplex solver is used for solving the problem, and the results show that.
(1) The inside-outside two-layer optimization model constructed in this paper can guarantee that the VPP makes optimal bidding decisions based on information from the external power and hydrogen markets and optimally adjusts internal resources based on the bidding situation to achieve the goal of maximizing total net benefits.
(2) In the current market environment, pumped storage power plants can achieve peak-to-valley arbitrage by interacting with the grid. However, for HSSs, it is uneconomical to compensate for peak hour load demand by purchasing power in the valley hours. However, in the case of the hydrogen market, HSS can earn hydrogen sales by purchasing power from the grid to produce hydrogen in the valley and the flat hours.
(3) In the absence of a benchmark threshold for ancillary services, the benefits of HSSs to reduce the cost of power purchase by reducing the demand for flexible loads are smaller than the benefits of participating in the hydrogen market but larger than the benefits of participating in the electricity market. However, due to the threshold of auxiliary services, HSS will sacrifice part of the benefits of direct participation in the hydrogen market and give priority to participating in the electricity auxiliary services market.
(4) For a VPP with multiple complementary energy storage, it is more profitable to fully consider the electricity-hydrogen market and the multi-functional properties of hydrogen storage than to merely equate the HSS with other energy storage as a backup power source. (Emmanouil et al., 2022).
The original contributions presented in the study are included in the article/Supplementary Material, further inquiries can be directed to the corresponding author.
WZ: Conceptualization, Writing–review and editing. YS: Writing–original draft. XW: Writing–original draft. ML: Investigation, Methodology, Writing–original draft. WR: Data curation, Software, Writing–review and editing. XX: Software, Data curation, Writing–original draft. YZ: Visualization, Supervision, Writing–original draft.
The author(s) declare that no financial support was received for the research, authorship, and/or publication of this article.
WZ, YS, ML, WR, and XX were employed by State Grid Jibei Zhangjiakou Wind and Solar Energy Storage and Transportation New Energy Co., Ltd. XW was employed by State Grid Jibei Electric Power Co.
The remaining author declares that the research was conducted in the absence of any commercial or financial relationships that could be construed as a potential conflict of interest.
The Reviewer LD declared a shared affiliation with the author YZ at the time of the review.
All claims expressed in this article are solely those of the authors and do not necessarily represent those of their affiliated organizations, or those of the publisher, the editors and the reviewers. Any product that may be evaluated in this article, or claim that may be made by its manufacturer, is not guaranteed or endorsed by the publisher.
Ahmad, R. J. (2022). A stochastic model for participation of virtual power plants in futures markets, pool markets and contracts with withdrawal penalty. J. Energy Storage, 50, 104334. doi:10.1016/j.est.2022.104334
Alahyari, A., Ehsan, M., and Moghimi, M. (2020). Managing distributed energy resources DERs through virtual power plant technology VPP: A stochastic information-gap decision theory igdt approach. Iran. J. Sci. Technol. Trans. Electr. Eng. 44 (1), 279–291. doi:10.1007/s40998-019-00248-w
Ashish, G., Myron, A., Dmitrii, B., Eugene, E., Joey, O., and Christian, B. (2021). Transition pathway towards 100% renewable energy across the sectors of power, heat, transport, and desalination for the Philippines. Renew. Sustain. Energy Rev., 144. 110934. doi:10.1016/j.rser.2021.110934
Chen, Y., Xiao, D., Xu, D., Tang, J., Lin, X., Xie, K., et al. (2023). Optimal bidding strategy of renewable-based virtual power plant in the day-ahead market. Int. J. Electr. Power Energy Syst., 239 122379. doi:10.1016/j.energy.2021.122379
Dai, X., Chen, H., and He, Q. (2022). An equilibrium model of the electricity market considering the participation of virtual power plants. Energy Rep. 8 (13), 506–514. doi:10.1016/j.egyr.2022.08.096
Emmanouil, V., Nikolaos, S., and Theocharis, T. (2022). Challenges of integrating hydrogen energy storage systems into nearly zero-energy ports. Energy, 241. 122878. doi:10.1016/j.energy.2021.122878
Furat, D., Martin, A., and Shafiullah, G. M. Hydrogen production for energy: An overview. Elsevier BV, Amsterdam, Netherlands, 2022, 3847–3869.
Henao Michelle, M., and Oviedo Jairo José, E. (2022). Bidding strategy for VPP and economic feasibility study of the optimal sizing of storage systems to face the uncertainty of solar generation modelled with IGDT. Energies 15 (3), 953. doi:10.3390/en15030953
Huang, Y., Shi, M., and Lin, H. (2021). A two-stage planning and optimization model for water - hydrogen integrated energy system with isolated grid. J. Clean. Prod. 313, 127889. doi:10.1016/j.jclepro.2021.127889
Ju, L., Yin, Z., Zhou, Q., Li, Q., Wang, P., Tian, W., et al. (2022). Nearly-zero carbon optimal operation model and benefit allocation strategy for a novel virtual power plant using carbon capture, power-to-gas, and waste incineration power in rural areas. Appl. Energy 310, 118618. doi:10.1016/j.apenergy.2022.118618
Li, B., and Ghiasi, M. (2021). A new strategy for economic virtual power plant utilization in electricity market considering energy storage effects and ancillary services. J. Electr. Eng. Technol. 16 (6), 2863–2874. doi:10.1007/s42835-021-00811-8
Li, S., He, H., and Zhao, P. (2021). Energy management for hybrid energy storage system in electric vehicle: A cyber-physical system perspective. Energy 230, 120890. doi:10.1016/j.energy.2021.120890
Liu, A., Miller, W., Cholette Michael, E., Gerard, L., Glenn, C., and Li, Y. (2021). A multi-dimension clustering-based method for renewable energy investment planning. Renew. Energy 172, 651–666. doi:10.1016/j.renene.2021.03.056
Liu, X. (2022). Research on bidding strategy of virtual power plant considering carbon-electricity integrated market mechanism. Int. J. Electr. Power Energy Syst. 137, 107891. doi:10.1016/j.ijepes.2021.107891
Mahdi, R., Fatemeh Jahanbani, A., Oluwaseyi, O., and Ali Jahanbani, A. (2022). Two-stage interval scheduling of virtual power plant in day-ahead and real-time markets considering compressed air energy storage wind turbine. J. Energy Storage, 45. 103599. doi:10.1016/j.est.2021.103599
Morteza, S., Abdollah, A., Omid, H., Miadreza, S.-K., and Catalão João, P. S. (2022). Optimal bidding strategy of a renewable-based virtual power plant including wind and solar units and dispatchable loads. Energy 239 122379. doi:10.1016/j.energy.2021.122379
Naughton, J., Wang, H., and Mancarella, P. (2020). Optimization of multi-energy virtual power plants for providing multiple market and local network services. Electr. Power Syst. Res. 189 (189), 106775. doi:10.1016/j.epsr.2020.106775
Nosratabadi, S. M., Hooshmand, R., and Gholipour, E. (2017). A comprehensive review on microgrid and virtual power plant concepts employed for distributed energy resources scheduling in power systems. Renew. Sustain. ENERGY Rev. 67, 341–363. doi:10.1016/j.rser.2016.09.025
Qiu, Y., Qi, L., Wang, T., Yin, L., Chen, W., and Liu, H. (2022). Optimal planning of Cross-regional hydrogen energy storage systems considering the uncertainty. Appl. Energy 326, 119973. doi:10.1016/j.apenergy.2022.119973
Han, W., and Ángel, J. O. G., (2021). Energy-based stochastic MPC for integrated electricity-hydrogen VPP in real-time markets. Electr. Power Syst. Res. 195 106738. doi:10.1016/j.epsr.2020.106738
Saleh Sadeghi, G., Majid, D., Amirhossein, N., Hamidreza, J., and Masoud Aliakbar, G. (2022). Economic assessment of multi-operator virtual power plants in electricity market: A game theory-based approach. Sustain. Energy Technol. Assessments 53, 102733. doi:10.1016/j.seta.2022.102733
Shafiekhani, M., Badri, A., and Catalão, J. P. S. (2019). Strategic bidding of virtual power plant in energy markets: A Bi-level multi-objective approach. Int. J. Electr. Power & Energy Syst. 113 208-219. doi:10.1016/j.ijepes.2019.05.023
Tang, W.-J., and Yang, H.-T. (2019). Optimal operation and bidding strategy of a virtual power plant integrated with energy storage systems and elasticity demand response. IEEE Access 7, 79798–79809. doi:10.1109/access.2019.2922700
Zhang, T., and Hu, Z. (2022). Optimal scheduling strategy of virtual power plant with power-to-gas in dual energy markets. IEEE Trans. Industry Appl. 58 (2), 2921–2929. doi:10.1109/TIA.2021.3112641
Zheng, B., Wei, W., Yue, C., Wu, Q., and Mei, S. (2022). A peer-to-peer energy trading market embedded with residential shared energy storage units. Appl. Energy, 308. 118400. doi:10.1016/j.apenergy.2021.118400
Keywords: virtual power plant, electricity market, hydrogen market, hydrogen storage system, bidding strategy
Citation: Zhang W, Shen Y, Wang X, Li M, Ren W, Xu X and Zhang Y (2023) Research on multi-market strategies for virtual power plants with hydrogen energy storage. Front. Energy Res. 11:1260251. doi: 10.3389/fenrg.2023.1260251
Received: 17 July 2023; Accepted: 17 August 2023;
Published: 03 October 2023.
Edited by:
Shenbo Yang, Beijing University of Technology, ChinaReviewed by:
Qingkun Tan, State Grid Corporation of China, ChinaCopyright © 2023 Zhang, Shen, Wang, Li, Ren, Xu and Zhang. This is an open-access article distributed under the terms of the Creative Commons Attribution License (CC BY). The use, distribution or reproduction in other forums is permitted, provided the original author(s) and the copyright owner(s) are credited and that the original publication in this journal is cited, in accordance with accepted academic practice. No use, distribution or reproduction is permitted which does not comply with these terms.
*Correspondence: Yuyuan Zhang, MTIwMjAyMTA2MDM0QG5jZXB1LmVkdS5jbg==
Disclaimer: All claims expressed in this article are solely those of the authors and do not necessarily represent those of their affiliated organizations, or those of the publisher, the editors and the reviewers. Any product that may be evaluated in this article or claim that may be made by its manufacturer is not guaranteed or endorsed by the publisher.
Research integrity at Frontiers
Learn more about the work of our research integrity team to safeguard the quality of each article we publish.