 Kai Ren
 Shuguang Zhang
 Huanping Zhang1
 Haiyang Sun
- 1School of Mechanical and Electronic Engineering, Nanjing Forestry University, Nanjing, China
- 2School of Information Science and Technology, Nanjing Forestry University, Nanjing, China
As the core component of the automotive air conditioning cooling system, the automotive cooling fan directly affects the cooling performance of the entire system. Therefore, it is necessary to study the flow field and noise of the automotive cooling fan. This study focuses on the analysis off low field characteristics and noise generation in an automotive air conditioning systems, specifically related to an automobile cooling fan at different speeds. The flow field properties of the fan are examined through the distribution off low line trajectory, pressure distribution on the blade surface, and velocity distribution characteristics at various speeds. The analysis reveals that the maximum air velocity occurs at the point where the fan blade meets the wind guard, while the maximum pressure is observed at this point and at the edge where the fan blade cuts through the cavity. Furthermore, a monitoring point located 1 m in front of the fan is selected to study the average value of fan pneumatic noise pulsation and generate a noise cloud map, aiming to identify the main noise source of the fan. To better understand the noise distribution and variation at different speeds, various noise metrics are utilized, including noise Sound Pressure Level (SPL) spectrum, 1/3-octave SPL spectrum, and 1/3-octave A-weighted SPL spectrum. The noise characterization results indicate that the primary areas of fan noise generation are located at the tip of the leaf margin of the forward swept wing. This research provides valuable insights for the improvement and optimization of the cooling fan design, as well as subsequent noise reduction efforts.
Introduction
In recent years, the rapid growth of the economy and advancements in technology have led to an increased demand for improved temperature and humidity control in cars, consequently placing a greater load on the car’s air conditioning system. Car comfort is primarily evaluated based on factors such as car noise and car air conditioning performance (Yuan et al., 2011). The operation of the air conditioning system and exhaust purifier in a car leads to increased temperatures within the engine compartment, thereby elevating the load on the engine cooling fan and resulting in issues such as noise and heat dissipation. Consequently, addressing vehicle noise problems has become a top priority in the automotive industry (Li et al., 2011). The proper functioning of the engine is crucial for optimal car performance. As a core component of the engine cooling system, the cooling fan directly affects the cooling performance of the entire system. Therefore, studying and optimizing the performance of the cooling fan is essential (Wang et al., 2021). The cooling fan holds significant importance as an integral part of the engine cooling system. Functioning as a vane-type fluid machinery, the cooling fan converts the electrical energy generated by the drive system (motor) into mechanical energy, which propels the fan blades in rotation (Makki et al., 2012). The rotation of the fan blades creates a pressure difference between the front and rear of the fan, generating circulation and establishing an inflow-outflow air flow pattern. Therefore, the mechanical energy provided by the motor-driven fan is transformed into kinetic energy that drives the rotation of air (Huang et al., 2011).
The automotive industry is constantly evolving, and within the realm of engine cooling system, the automotive cooling fan stands out as a significant source of noise. Analyzing the flow characteristics and noise characteristics is vital to effectively reduce or minimize the noise generated. Chai et al. (Chai et al., 2021). Employed acoustic testing methods to study the flow and noise characteristics of automotive cooling fans. Their work investigates the impact of factors such as blade tip clearance, cover plate, and single rotor (fan structure) on fan noise. They utilize cyclic modal to examine the sound propagation characteristics and modal spectral distribution of discrete pitch noise. Rao et al. (Rao et al., 2007). Conducted a comparison between a standard blade and a forward curved blade, analyzing the static pressure distribution and velocity distribution. Their findings indicate that the forward curved blade exhibits superior performance and efficiency compared to the standard blade. Zhu et al. (Zhu et al., 2015). Developed a comprehensive Computational Fluid Dynamics (CFD) model to capture sound source information from cooling fans using Large Eddy Simulation (LES) in three different scenarios. Wu et al. (Wu et al., 2019). Applied a blade splitting strategy to simulate a fan with uneven blade pitch. Similarly, Tannoury et al. (Tannoury et al., 2013). Investigated the impact of fan blade compactness and splitting strategies on discrete noise in automotive cooling fans.
Historically, the design of automotive cooling fans relied on a trial-and-error approach, involving repeated testing to identify the optimal solution. However, this method not only resulted in long design cycles but also incurred high production costs. In recent times, Fluent, a widely adopted commercial CFD software, has gained popularity due to its extensive range of physical models, advanced numerical methods, and robust pre- and post-processing capabilities (Heinemann et al., 2015). Fluent is capable of handling diverse problems related to fluid dynamics, heat transfer, and chemical reactions (Zhao et al., 2014). This study provides a brief explanation of the fundamental theory of fluid dynamics and relevant formulas, which serve as the theoretical foundation for subsequent numerical simulations. The research creates a fan model using SOLIDWORKS and utilize Fluent to conduct numerical simulations of the fan model at different speeds. A comparative analysis is performed to investigate the flow characteristics of the cooling fan, incorporating flow trajectories, velocity clouds maps, and pressure cloud maps. Additionally, this study compares the noise distribution clouds maps, noise spectra, 1/3-octave SPL spectra, and 1/3-octave A-weighted SPL spectra to analyze the differences in noise characteristics among cooling fans. By employing Fluent for numerical simulation of the flow and sound fields in the design model, the design efficiency is significantly enhanced while reducing production costs.
Computational theory and methods
Conservation of mass and momentum
The flow of fluid in the context of cooling fan analysis is governed by conservation laws, particularly the mass conservation equation and the momentum conservation equation (Monreal, 2015). Energy conversion is not considered in the simulation process for cooling fans, hence only the mass and the momentum conservation equation are discussed.
The mass conservation equations is discretized using Finite Volume Method (FVM), which is a commonly employed numerical discretization method in CFD (Proot and Gerritsma, 2006). FVM involves discretizing both the control equations and the computational meshes (Jeong and Seong, 2014). In essence, the mass conservation equation describes the rate of change of mass within a fixed fluid micro-element, which is equal to the outflow of fluid from Cartesian coordinates in three directions. The mass equation can be expressed as follows:
The conservation of momentum equation, commonly referred to as Navier-Stokes equation, is utilized to describe the flow behavior of the fluid. It assumes that the only external forces acting on the fluid are the volume and area forces (Yin et al., 2012). The equation represents the rate of change of momentum within a given region, which is equal to the combined effect of the volume force and the area force exerted on that region. The momentum equation can be expressed as follows:
where ρ is the pressure, Fx, Fy, Fz are the component forces in the x, y, z directions, and
Pneumatic performance formula
The performance of an axial fan flow, including parameters such as flow rate, air pressure, and power, that vary during operation, is collectively referred to as the aerodynamic performance or characteristics of the fan (Nakamura et al., 2014). When it comes to the aerodynamic noise generated by an axial fan, it exhibits typical characteristics of a dipole sound source. The generation mechanism of the noise can be attributed to eddy current noise and rotational noise (Chai et al., 2021).
Flow refers to the volume or mass of gas that passes through a fan per unit of time, and it is commonly referred to as the flow rate. In a system with constant flow, the mass flow rate remains constant between any two sections of the system.
where A is the cross-sectional area, V is the average velocity of the airflow perpendicular to A, and ρ is the gas density.
Air pressure refers to the increase in pressure relative to atmospheric pressure. In the context of an axial fan, the static pressure is defined as the difference between between the total pressure and the dynamic pressure.
Vortex noise is a type of noise generated by turbulent airflow pressure pulsations, typically occurring at the trailing edge and tip of the fan blades (Alic et al., 2010). It is caused by the formation of turbulent surface layers on the blade surface. Vortex noise is characterized by a broadband continuous spectrum on a spectrogram (Park and Lee, 2017). The frequency equation for vortex noise can be expressed as follows:
where Sr is Strouhal number, w is the relative velocity of the airflow to the blade, d is the characteristic size of the source, and i is the harmonic number, starting from i = 1 for the fundamental frequency.
Rotational noise is generated due to the vibration of air caused by the blades as they cut through the surrounding air during rotation (Sturm and Carolus, 2012). This noise is characterized by periodicity and is observed as discrete peaks on the spectrogram. The frequency equation is expressed as follows:
where B is the number of fan blades, n is the fan speed per minute, and i is hte harmonic number, starting from i = 1 for the fundamental frequency (Dou et al., 2016).
When the obstacles exist in the fluid, the unstable reaction force between the fluid and the object results a dipole source. The dipole source can be seen as formed by two monopoles with a phase difference of 180°, with a directional pattern of “8” (Li et al., 2007). The sound power of a dipole sound source is expressed by:
where
Fan modeling and simplification
The establishment of a reasonable aerodynamic model serves as the foundation for investigating the aerodynamic and noise characteristics of a cooling fan (Spasic et al., 2018). This study focuses on a specific configuration of a single 7-blade cooling fan module with equidistant blades. The fan has a diameter of 420 mm, a hub ratio of 0.38, and a blade ring width of 10 mm.
The 3D fan model, created in SOLIDWORKS, is imported into Workbench Fluent in step format for further processing. To simplify the fan model, attention is given to two primary areas (Hsia et al., 2009). Firstly, curved rounded or chamfered corners at the tip of the fan, as well as the junctions between the blades and the hub, are adjusted. These modifications have minimal impact on the flow field and sound field of the fan, but they can significantly increase the computational time required for meshing. In some cases, failure in meshing can occur (Bizjan et al., 2016), as shown in Figure 1A. Secondly, threaded holes and reinforcement bars exist inside the hub, but they do not contribute to fluid flow. As a result, these components are considered during the repair process of 3D models. The software Space Claim is utilized to remove or fill rounded or chamfered corners, reducing the interior of the fan hub to a simplified cylindrical solid with equivalent dimensions (Zhang et al., 2011), as shown in Figure 1B. This approach not only enhances the computational efficiency of the computer but also ensures the quality and accuracy of the meshing process (Ocker et al., 2022).
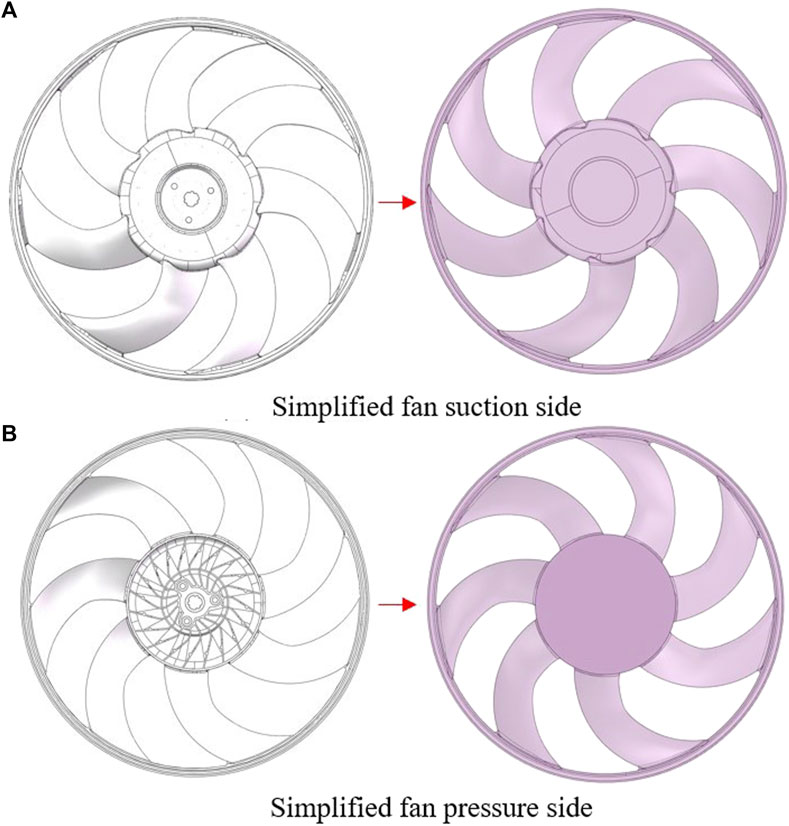
FIGURE 1. Fan model simplification.
CFD simulation modeling and meshing
Design Modeler module in Workbench Fluent is accessed to partition the fluid domain using Boolean operations, separating it into dynamic and static domains (Chen et al., 2013). When creating the static domain, it is crucial to position the cylinder as close as possible to the outer diameter of the fan and align its height with that of the fan model. This ensures that the cylinder appropriately encapsulates the fan model without any gaps. In terms of dimensions, the fluid field is specified as follows: The inlet and outlet diameter are set to 0.8 m, which is approximately twice the diameter of the fan. The inlet zone length is determined to be 2 m, exceeding 10 times the fan radius, while the outlet zone length is set to 2.5 m, surpassing 12 times the radius of the fan (Lin and Tsai, 2010), as shown in Figure 2A.
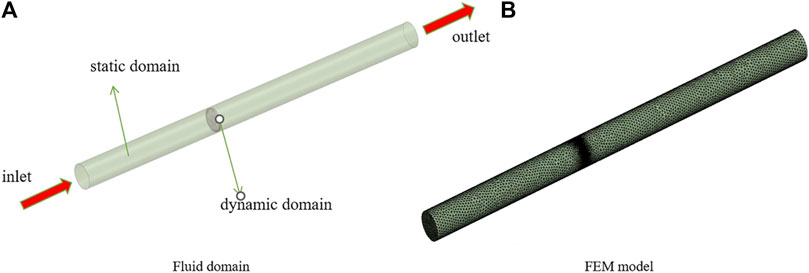
FIGURE 2. Aerodynamic model.
In numerical calculations, the quality of the mesh plays a crucial role in determining the accuracy of the final results and the convergence time of the simulation. A high-quality meshing should capture all important geometric details, while a poor-quality mesh can lead to convergence difficulties or inadequate representation of the physical field (Chen et al., 2022). Therefore, it is important to balance the number of mesh elements to reduce computational time and enhance convergence stability, while maintaining a sufficiently fine mesh resolution. To achieve a better mesh, a mesh independence verification process is typically performed. Critical regions in the model may require more precise mesh control. As the fan component is a key focus of the study, the majority of mesh refinement is carried out in the dynamic domain, as shown in Figure 2B. The fan’s rotational center (at the entrance), under different conditions. The calculation is considered grid-independent when the velocity at the monitoring point and the inlet mass flow rate remains essentially constant across different mesh sizes. To verify mesh independence, a verification environment at 2000 rpm is established, and a monitoring point located 1 m from the center of rotation (at the entrance) is selected to observe speed variation and inlet mass flow rate variation. The goal is to achieve a stable velocity and inlet mass flow rate at the monitoring point to determine the minimum number of grids required to satisfy the conditions.
Different cell sizes are employed to generate various overall mesh sizes for mesh independence verification. The following data represents the results obtained:
• Total elements: 1,021,796; Dynamic elements: 714,774; Monitor point velocity: 2.801 m/s; Inlet mass flow rate: 2.287 kg/s.
• Total elements: 1,897,605; Dynamic elements: 1,264,727; Monitor point velocity: 3.412 m/s; Inlet mass flow rate: 3.255 kg/s.
• Total elements: 3,409,084; Dynamic elements: 2,485,237; Monitor point velocity; 3.439 m/s; Inlet mass flow rate: 3.268 kg/s.
• Total elements: 5,428,725; Dynamic elements: 3,677,400; Monitor point velocity: 3.489 m/s; Inlet mass flow rate: 3.231 kg/s.
The data reveals that the velocities at the monitoring points and the mass flow rate at the inlet stabilize as the dynamic domain is refined. Based on this, a mesh with approximately 1.9 million cells can be considered as the minimum grid that satisfies the criteria for mesh independence and can be employed in subsequent calculations. After dividing the mesh, it is essential to check its quality to ensure acceptability for Fluent calculations. The two key metrics for fluid simulation, Skewness and Orthogonal Quality, are evaluated (Bruno and Oberto, 2022).
The final mesh demonstrates a Skewness value of less than 0.847 and an Orthogonal Quality greater than 0.153, meeting the requirements for accurate calculations.
Key parameter settings
Before configuring Fluent parameters, it is essential to check for any negative volumes within the mesh. Additionally, it is recommended to change the units to rpm, which is a commonly used engineering unit. The approach adopted is to transform the flow field in the duct to the instantaneous flow field at a specific position of the impeller, utilizing a steady-state method to solve unsteady problems. In this case, the fan and its immediate vicinity are defined within the rotating coordinate system, while the other regions are defined within the stationary coordinate system. The fan remains stationary in relation to the rotating coordinate system (Bujalski et al., 2002). For the turbulence model, Realizable K-ε model is selected as it provides better predictions of rotational phenomena. This model is widely used in viscous simulations, general problems, and is suitable for non-separable, compressible/incompressible flow problems, as well as complex geometric external flows. Fluent offers 10 types of flow inlet and outlet conditions, and for this study, in order to better simulate the airflow generated by the fan due to its rotation, select a pressure inlet with a pressure inlet set to 0, select a pressure outlet with a relative pressure of 0, and the airflow flows out along the axial direction of the fan. SIMPLE pressure correction algorithm is utilized. The air density is set to 1.225 kg/m³. And the viscosity is defined as 1.7894 × 10⁻⁵Pa·s.
Due to the fact that the noise of a fan is calculated based on the flow field of the fan, there is a quantitative relationship between the parameters of the noise characteristics and the flow field characteristics. If the noise characteristic parameters are the same as the flow field, the same boundary conditions are used, that is, the relative pressure between the inlet and outlet is zero and is not affected by the external boundary pressure. The second order upwind scheme was chosen for both turbulent kinetic energy and turbulent dissipation rate. The spatial discretization of pressure adopts second order, and the spatial discretization of momentum adopts second order upwind. Unlike the flow field analysis, the noise field uses a transient solver. The dynamic and static domains were coupled using a slip mesh, and the connection surfaces between them were properly intersected. The solution method used is the pressure implicit operator splitting algorithm, which enhances the stability of transient flow calculations. Additionally, pressure staggering option pressure interpolation method was utilized, which is particularly suitable for fan models.
Results and discussion
Mechanical properties
First, the mechanical strength of the fan is addressed, which is other prerequisites for flow field and noise performances. The random vibration calculations are investigated to validate reliability of the fan. The frequency at first 6 modes of the fan is obtained by 69.5 Hz, 70.6 Hz, 96.0 Hz, 128.6 Hz, 130.3 Hz, and 250.0 Hz, respectively, shown as Supplementary Figure S1A in the Supplementary Material. One can see that the minimal frequency (69.5 Hz) is also larger than the engineering experience (about 30 Hz). The random vibration spectrum is applied by the industry standards, QCT773-2006, shown as Supplementary Figure S1B in the Supplementary Material. Thus, the calculated stress and the deformation of the fan are within the tolerance range, suggesting a mechanical strength reliability, shown as Supplementary Figure S1C, D in the Supplementary Material, respectively.
Flow field analysis
Various methods can be employed to determine convergence in simulations. To ensure more accurate results, it is recommended to monitor physical quantities such as velocity and flow rate, which serve as indicators of the system’s behavior. Convergence is achieved when these physical quantities of interest exhibit stability. In some cases, even if the residuals do not reach the specified threshold, convergence can be considered attained as long as the monitored physical quantities remain stable. For instance, when operating at the maximum speed of 3000 rpm, the mass flow rate at the inlet and outlet of the fan can be selected as monitoring observation point. Convergence is recognized when the mass flow rate at these locations has reached a stable level.
After a certain number of iterations, the inlet mass flow rate stabilizes at approximately 2.5229 kg/s, while the outlet mass flow rate also stabilizes at the same value. Additionally, the residual value of the iterations is less than 10−6, indicating convergence of the iterations.
The simulation study involves investigating the fan’s behavior at different speeds: 1000 rpm, 1500 rpm, 2000 rpm, 2500 rpm, and 3000 rpm. Analysis of the fan’s performance is conducted using data obtained from the flow trajectory, velocity distribution, and pressure distribution clouds.
Rotation in this context represents a steady and constant flow, where the flow state remains independent of time, resulting in coinciding flow lines and traces. Figures 3A–E illustrate the fan trajectory at different speeds: 1000 rpm, 1500 rpm, 2000 rpm, 2500 rpm, and 3000 rpm. Observing the fan inlet, a predominantly laminar flow movement is evident. At the airflow progresses towards the fan exit, it takes on an alternating spiral pattern due to the interaction with the fan blades. As the speed increases, this spiral pattern becomes more pronounced, and the airflow becomes more concentrated in the axial direction of the fan’s rotating shaft. In addition, subtle turbulence or backflow was observed at the exit of the rotating domain. This is due to the solid filling of the fan hub, which acts as a “wall”. When the fluid flows through it, it will generate a subtle turbulence or backflow, as shown in Figure 3F.

FIGURE 3. Flow traces at different speeds.
Velocity analysis is a critical aspect of fluid analysis, providing valuable insights into the behavior of the flow. Velocity cloud map and other related representations can help draw important conclusions. Figure 4A–E present the velocity cloud map on the fan surface at speeds of 1000 rpm, 1500 rpm, 2000 rpm, 2500 rpm, and 3000 rpm, respectively. The velocity cloud map at different speeds reveals a consistent trend in the overall velocity zones on the fan surface. As the fan speed increases, the velocity magnitude within these zones also increases. Furthermore, the speed distribution exhibits a stepped increase from the hub center towards the fan blade edge, reaching its maximum value at the fan blade edge.
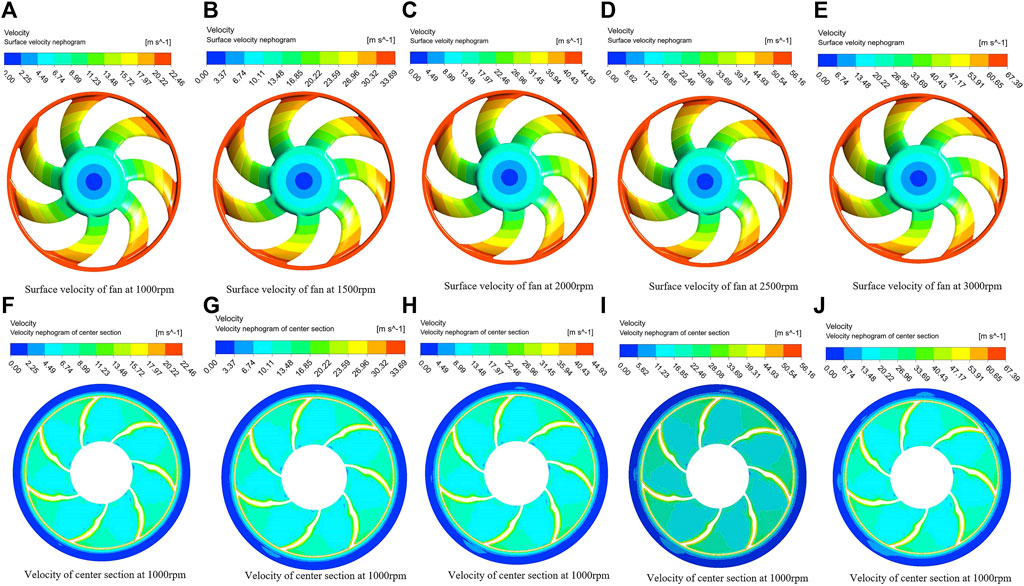
FIGURE 4. Fan surface and center section velocity cloud map.
To validate the observations made, center section of the dynamic domain was selected to examine the velocity distribution of the fan. Figures 4F–J illustrate the fan speed distribution within this selected dynamic domain section. The depicted speed distribution clearly demonstrates that the velocity increase progressively from the fan hub towards the fan blade. At the tip of the blade, the speed reaches its maximum value, aligning with the earlier conclusion drawn from the velocity cloud map.
Figure 5 presents the pressure cloud map on both the suction and pressure surfaces of the fan at different speeds. Overall, the pressure value on the fan surface gradually increases with the increase of speed. A large negative pressure can be observed on the surface of the blade on the suction side of the fan. However, there is a significant positive pressure at the edge of the fan blades. Notably, positive pressures are present at the leading edge of the blade in the direction of the incoming flow and at the blade tip. Other regions of the fan blade exhibit significant changes in pressure gradients, resulting in an uneven pressure distribution. On the contrary, on the pressure side of the fan blades, positive pressure is commonly present in most areas. The maximal positive pressure on the pressure surface is found at the blade tip, which intensifies with higher speeds. Due to the solid central hub of the fan, which does not involve airflow, the pressure values on the suction and pressure surfaces near the hub are relatively small.
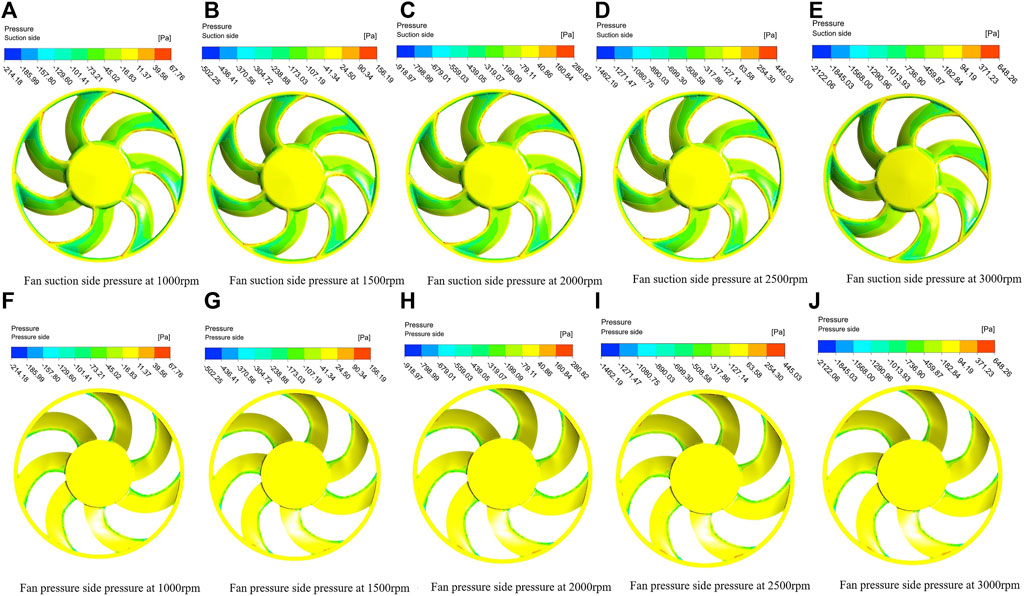
FIGURE 5. Pressure on suction and pressure sides of the fan at different speeds.
Simulation and analysis of fan aerodynamic noise characteristics
To analyze the far-field sound propagation, was calculated Ffowcs Williams-Hawkings Model integrated within Fluent software was employed. Realizable K-ε model was selected to predict the aerodynamic performance and noise source in the near field of the cooling fan (Zhai and Huxiao, 2020). In addition, the setting of the time step size is the minimal grid length divided by the flow velocity or rotational flow velocity. This ensures that each iteration is within a grid range and does not cause result errors due to crossing the grid. However, in practice, the calculation speed may be accelerated after a period of time, and the time step size will be set to a larger size. Finally, to obtain the final solution, the time step size will be reduced to perform subtle calculations (Havryliv et al., 2020). In this article, the time step size is selected as 5e−5.
When setting parameters, the fan body is used as the noise source, and the monitoring points are set according to the regulations in the “Noise Measurement Method for Fans and Roots blowers”. Due to the limitations of the simulation model, it is not possible to fully follow the 45° layout of the outlet area in the experimental plan. Instead, the sound pressure measuring instrument is arranged on the axis at a distance of 1 m and 2 m from the center of the fan, and the results at 1 m in front of the fan are compared with the test data. The values at other points are used as supplementary references (Li et al., 2007).
To validate the accuracy of calculation methods, the noise simulations were first explored at 4000 rpm compared with experiments at the same speed. The bench test for noise test is built to place the fan in a closed test room with a background noise of less than 45 dB (A) and a volume of more than 60 m³, and to introduce the power supply from outside the test room, showing as Supplementary Figure S2 in the Supplementary Material. The fan is placed vertically, 500 mm from the ground, and is operated at the rated voltage for 15 min before the start of the measurement. The experimental fan is also loaded with the tank core and placed according to the actual loading position with the voltage of 13.5 V ± 0.1 V applied. The microphone is placed at a position 1 m away from the inside of the microphone. The equipment used is Squadriga Ⅱ noise and vibration test system, QJ3060X DC power supply with a range of 0–30 V, 17 B+ FLUKE multimeter with a range of 0–1000 V. In this experimental quiet room test, the measurement noise meets the requirements. Importantly, the comparison of A-weighted total sound pressure levels of simulation and experiment are 66.75 dB and 68.23 dB with an error of about 2.2%. Furthermore, one can see that the A-weighted total sound pressure level error at the monitoring point is relatively small, below 5%, which meets the engineering application standards. By comparing the collected spectra, it is believed that the sound field prediction method is reliable and can be used for subsequent research at other rotational speeds.
The noise characteristics of the cooling fan were analyzed at five different speeds: 1000 rpm, 1500 rpm, 2000 rpm, 2500 rpm, and 3000 rpm. A monitoring point located 1 m from the axial inlet of the fan, as illustrated in Figure 6, was selected for data collection and analysis. Simulations were conducted to obtain various acoustic parameters, including the root mean square of the rate of change of sound pressure (Dpdt RMS) on the fan’s surface, the distribution of noise clouds, SPL spectrum at different speeds, as well as 1/3 octave sound pressure level and 1/3 octave A-weighted sound pressure level.
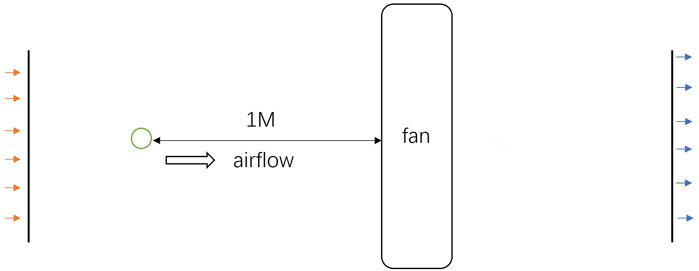
FIGURE 6. Location of monitoring point.
In Fluent post-processing, Acoustic Surface Dpdt RMS parameter was selected to visualize the time-averaged values of sound pressure pulsations on the fan’s surface, as shown in Figure 7. The regions with the highest values of Acoustic Surface Dpdt RMS are primarily concentrated at the tip of the leaf margin of the forward swept wing. This analysis clearly reveals the main areas where noise is generated on the fan. The source of noise can be prominently observed on the windward side of the fan blade, particularly at the tip of the blade edge.
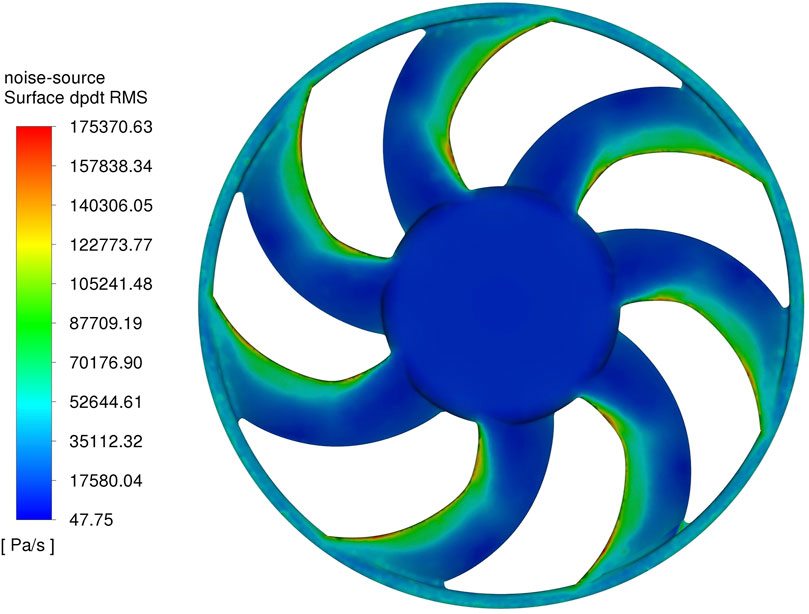
FIGURE 7. Acoustic surface Dpdt RMS.
Figure 8 shows the distribution of the sound power levels at three different speeds, providing an overview of the approximate noise distribution. Generally, the noise levels increase as the speed of the fan increases. When comparing of high and low speeds, it is observed that at low speed, the noise primarily originates from the front edge in the rotation direction and the blade tips, with a maximum sound power level of 63.7 dB at 1000 rpm. On the other hand, at high speeds, the main source of noise extends from the blade tips towards the tailing edge, reaching a maximum sound power level of 96.6 dB at 3000 rpm. As the speed increases, the noise contribution from the hub section of the fan also undergoes significant changes. It can be observed that the noise from the hub section gradually increases as the speed increases. Additionally, the sound source on the surface of the fan blade is mainly located in the middle part of the blade near the leading edge of the pressure and suction surfaces of the blade, as well as at the trailing edge of the blade.
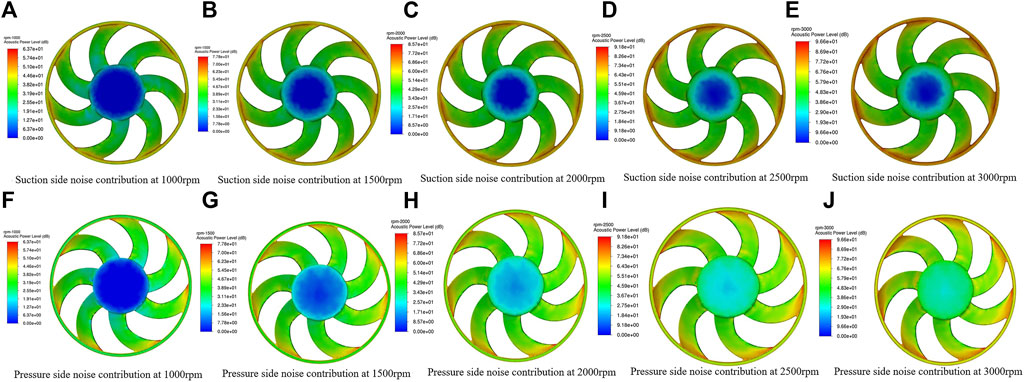
FIGURE 8. Acoustic power levels at five different speeds.
Following the completion of the simulation, Fast Fourier Transform (FFT) function within Fluent’s post-processing capabilities was utilized. This function facilitated the conversion of the sound pressure signal at the monitoring points from the time domain to the frequency domain. As a result, sound pressure level spectra at different speeds were obtained. By measuring the sound pressure levels at different rotational speeds and combining formula (6), it can be found that the sound pressure level is proportional to the 6th power of the rotational speed, which conforms to the characteristics of typical dipole sound sources.
Figure 9 presents the sound pressure spectrum at a distance of 1 m from the axial inlet of the fan for speeds of 1,000, 1,500, 2000, 2,500, and 3000 rpm. The overall noise level demonstrates an increase as the fan speed rises. The spectrum reveals that the fan noise primarily consists of two components: rotational noise resulting from the blades cutting through the air during rotation, and broadband frequency eddy current noise caused by random forces. At lower speeds, the spectrum exhibits fewer discrete peaks and a greater prevalence of broadband continuous spectra, indicating that fan eddy current noise is the main contributor to the overall fan noise during these conditions. However, as the speed increases, the spectrum reveals an increase in the number of discrete peaks. This suggests that fan rotation noise becomes the dominant source of noise at higher speeds.
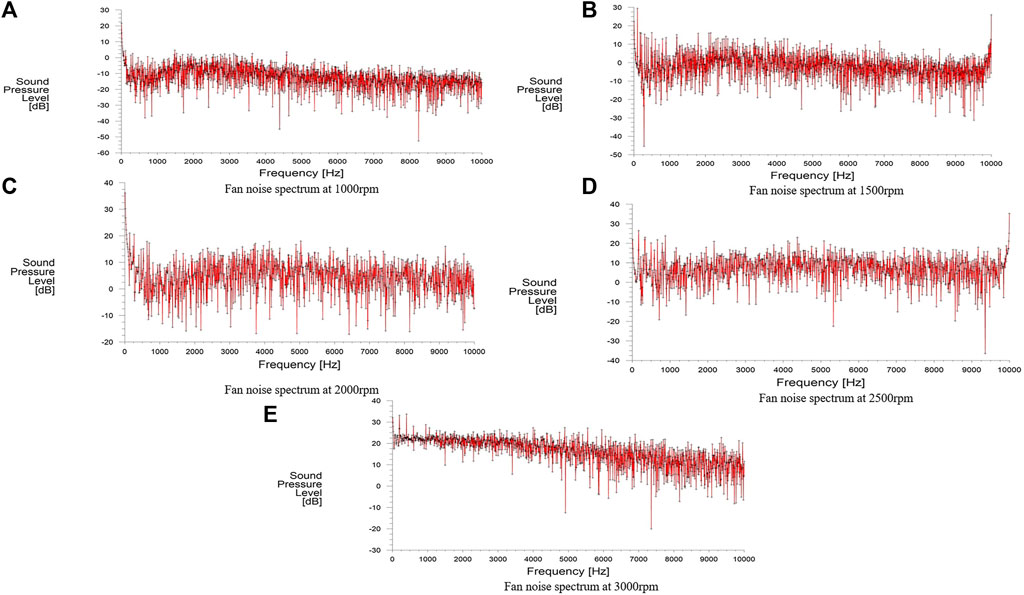
FIGURE 9. Fan noise spectrum at three different speeds.
To ensure the reliability of the simulation results, Eq. 5 was employed to calculate the fundamental frequency of the 7-blade forward-swept fan at 2000 rpm. The calculated fundamental frequency was found to be 233.3 Hz, which corresponds to the position of the fundamental frequency observed in the graphical spectrum. By comparing the theoretical calculation with the observed spectrum, confidence in the simulation outcomes is strengthened. This verification process underscores the accuracy and credibility of the simulation methodology employed in analyzing the noise characteristics of the fan.
The octave plays a crucial role in NVH (Noise, Vibration, and Harshness) spectrum analysis, representing an equally spaced interval where two adjacent frequencies are related by a factor of 2n, While the human ear can perceive sounds within the range of 20 and 20,000 Hz, its sensitivity to different frequencies varies. Distinguishing higher frequencies becomes progressively more challenging. To accurately analyze and capture the characteristics of low frequencies, it is necessary to subdivide them extensively in spectrum analysis. The concept of the octave involves summing the sound energy within the corresponding octave band. The primary objective of using 1/3 octave analysis is to examine the frequency distribution of noise energy, while also employing a weighted grid as a filtering function. Research has demonstrated that regardless of sound intensity, measurements taken using A-weighting closely correspond to the human ear’s perception of sound loudness. Therefore, the A-weighted sound level serves as the primary indicator for evaluating noise.
Figure 9 shows 1/3 octave sound pressure levels and 1/3 octave A-weighted sound pressure levels at the monitoring points for the five different speeds. Compared to the fan with different rotational speeds, the overall noise energy is mainly concentrated in multiple narrowband spectra at 100 Hz–300 Hz and the band spectra between 3,000 Hz–7000 Hz, with peak values appearing around 4000 Hz. As shown in Figure 10A, the noise spectrum at a speed of 1000 rpm is shown. At a low frequency of around 100 Hz, the noise gradually increases to reach the first peak, and at around 300 Hz, it reaches the second peak. The noise at subsequent high frequencies is relatively stable. As the speed increases, the noise at low frequencies becomes more pronounced and increases gradually, due to the rotating airflow generated by the high speed of the blades as a result of the increased speed. The noise frequency at different rotational speeds is more stable at 3,000 Hz–7000 Hz, which is due to the broadband noise generated by the shedding vortices colliding with each other generated by the gas flow through the blades. At 1000 rpm, the fan aerodynamic noise is dominated by this broadband noise, peaking at 26.7 dB; at 1500 rpm, the noise peaks at 34.8 dB; at 2000 rpm, the noise peaks at 40.5 dB; at 2500 rpm, the noise peaks at 42.9 dB; and at 3000 rpm finally, the noise peaks at 51.7 dB; At 3000 rpm, the noise peak reaches 51.7 dB. At low rotational speeds, the noise is mainly controlled by broadband noise, and the rotational noise value at low frequencies is very small; with the increase of rotational speed, the rotational noise increases sharply, and the broadband noise peak grows slowly and tends to flatten out compared with the low-frequency noise peak.
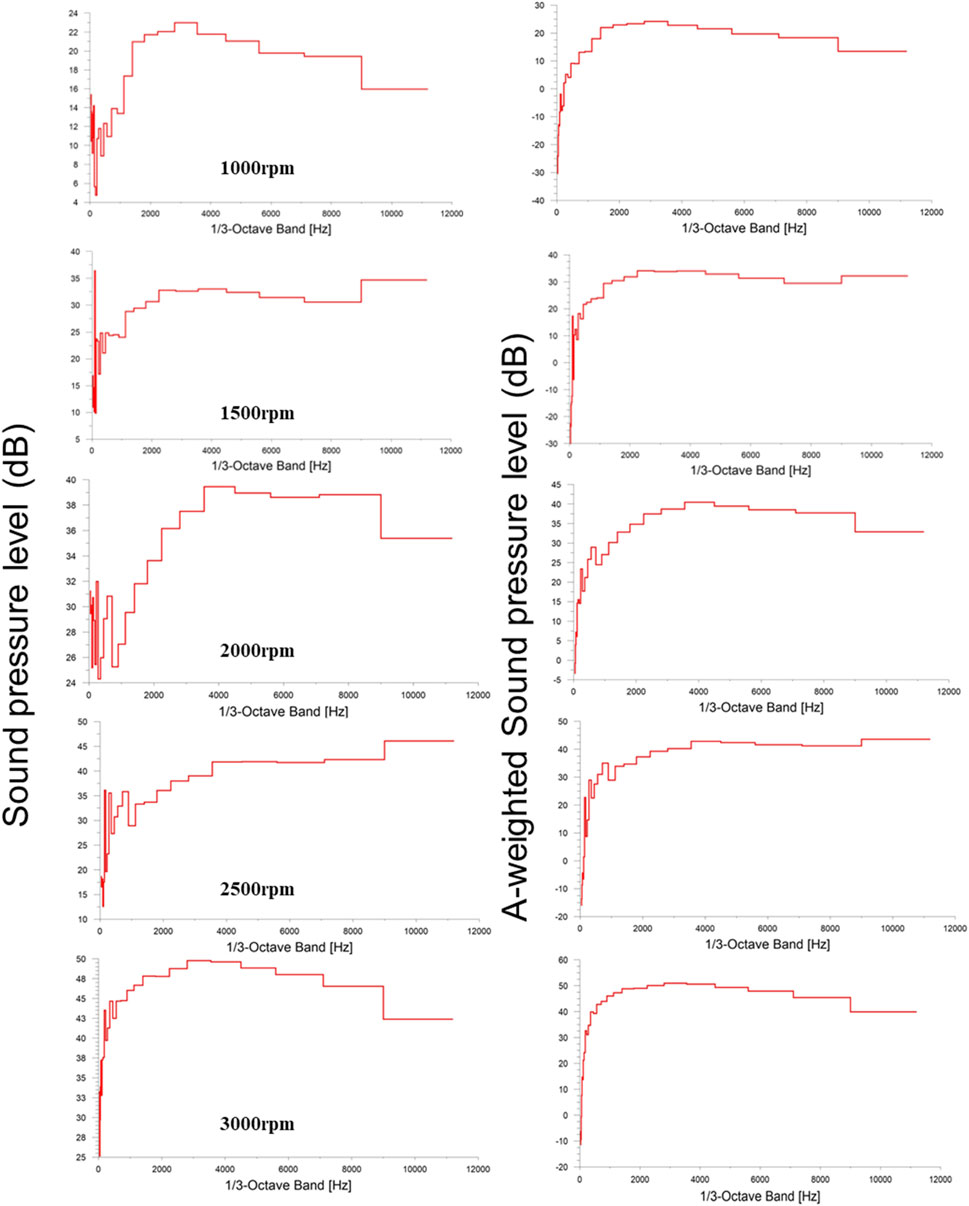
FIGURE 10. 1/3 octave spectrum and A-weighted spectrum at the five speeds.
Conclusion
This study aimed to simulate the aerodynamic and noise performance characteristics of a cooling axial fan at different speeds. The key findings of the study can be summarized as follows:
1. As the fan speed increases, the airflow in the axial direction of the rotating shaft becomes more concentrated, presenting a spiral alternating pattern. Backflow generated at the center of the fan hub, this is due to the solid filling of the fan hub, which acts as a “wall”. When the air flows through it, it will generate a subtle turbulence or backflow.
2. With the increase of fan rotating speed, the gradient trend of fan surface velocity distribution does not change. The changes in positive and negative pressure gradients on the surface of the fan are significant, especially at the leading edge and tip of the blade. These areas undergo rotational backflow, which is more pronounced at low speeds. Due to the crucial importance of these areas for fan operation, they may lead to power loss, which may be a focus of future fan optimization work.
3. Regarding noise performance, the main sound source of the fan is the dipole, and the sound pressure level is proportional to the sixth power of the speed. The study identified the sound source on the surface of the fan blade is mainly located in the middle part of the blade near the leading edge of the pressure and suction surfaces of the blade, as well as at the trailing edge of the blade. The noise spectrum analysis revealed that rotational noise becomes the primary source of noise output as the speed increases. Compared to fans at different speeds, the overall noise energy is mainly concentrated in two different frequency bands: 100 Hz–300 Hz and 3,000 Hz–7000 Hz, with peaks appearing around 4000 Hz.
Data availability statement
The original contributions presented in the study are included in the article/Supplementary Material, further inquiries can be directed to the corresponding author.
Ethics statement
Written informed consent was obtained from the individual(s) for the publication of any potentially identifiable images or data included in this article.
Author contributions
KR: Funding acquisition, Methodology, Supervision, Writing–original draft, Writing–review and editing. SZ: Conceptualization, Data-curation, Writing–original draft. HZ: Formal Analysis, Funding acquisition, Methodology, Supervision, Writing–original draft. CD: Conceptualization, Data-curation, Writing–review and editing. HS: Formal Analysis, Methodology, Software, Writing–review and editing.
Funding
The author(s) declare that no financial support was received for the research, authorship, and/or publication of this article. The authors would like to thank the Natural Science Foundation of Jiangsu (No. BK20220407).
Conflict of interest
The authors declare that the research was conducted in the absence of any commercial or financial relationships that could be construed as a potential conflict of interest.
Publisher’s note
All claims expressed in this article are solely those of the authors and do not necessarily represent those of their affiliated organizations, or those of the publisher, the editors and the reviewers. Any product that may be evaluated in this article, or claim that may be made by its manufacturer, is not guaranteed or endorsed by the publisher.
Supplementary material
The Supplementary Material for this article can be found online at: https://www.frontiersin.org/articles/10.3389/fenrg.2023.1259052/full#supplementary-material
References
Alic, G., Sirok, B., and Hocevar, M. (2010). Guard grillimpacton aero dynamic integral and acoustic characteristics of anaxial fan. NOISE CONTROL Eng. J. 58 (3), 20. doi:10.3397/1.3421971
Bizjan, B., Milavec, M., Sirok, B., Trenc, F., and Hočevar, M. (2016). Energy dissipation in the blade tip region of anaxial fan. J. SOUND Vib. 382, 10. doi:10.1016/j.jsv.2016.06.036
Bruno, L., and Oberto, D. (2022). Effects of cell quality in grid boundary layer on the simulated flow around a square cylinder. Comput. FLUIDS, 238. 105351 doi:10.1016/j.compfluid.2022.105351
Bujalski, W., Jaworski, Z., and Nienow, A. W. (2002). Cfd study of homogenization with dual rushton turbines - comparison with experimental results part ii: the multiple reference frame[j]. Chem. Eng. Res. Des. 80 (A1), 97–104. doi:10.1205/026387602753393402
Chai, P. F., Sun, Z. H., Chang, Z. Q., Peng, Z., Tian, J., and Ouyang, H. (2021). Noise characteristics of automobile cooling fan based on circumferential mode analysis. J. Eng. GAS TURBINES POWER-TRANSACTIONS ASME 143 (12). 121003 doi:10.1115/1.4051953
Chen, H. F., Zhou, X. Q., Feng, Z. B., and Cao, S. J. (2022). Application of polyhedral meshing strategy in indoor environment simulation: model accuracy and computing time. INDOOR BUILT Environ. 31 (3), 719–731. doi:10.1177/1420326x211027620
Chen, Q. G., Zhang, Y. C., Li, F., Kong, X. Z., and Luan, X. H. (2013). Effects of anti-recirculation ring on performance of an automotive cooling fan. IOP Conference Series: Materials Science and Engineering, 52 042008 doi:10.1088/1757-899X/52/4/042008
Dou, H. S., Li, Z. H., Lin, P. F., Wei, Y., Chen, Y., Cao, W., et al. (2016). An improved prediction model of vortex shedding noise from blades of fans. J. Therm. Sci. 25 (6), 6. doi:10.1007/s11630-016-0894-3
Havryliv, R., Kostiv, I., and Maystruk, V. (Septembe 2020). Using the computational fluid dynamic software to mixing process modeling in the industrial scale vessel with side-mounted agitator. Proceedings of the 2020 10TH Int. Conf. Adv. Comput. Inf. Technol. (ACIT), Deggendorf, Germany doi:10.1109/ACIT49673.2020.9208986
Heinemann, T., Johann, M., Zenger, S., and Becker, F. (2015). Cross wind in fluence on noise emission and computed vibrational noise of anaxial fan. ASME TURBO EXPO TURBINE Tech. Conf. Expo. 56628, V001T09A004. doi:10.1115/GT2015-42444
Hsia, S., Chiu, S., and Cheng, J. (2009). Sound field analysis and simulation for fluid machines. Adv. Eng. Softw. 40 (1), 8. doi:10.1016/j.advengsoft.2008.03.006
Huang, H., Jiao, W., Shi, Z. M., Wang, S. Z., Lu, R., Pan, Y. M., et al. (2011). A novel antireflux metal stent for the palliation of biliary malignancies: A pilot feasibility study (with video). Smart mater. Intelligent syst. 73, 143–148. doi:10.1016/j.gie.2010.08.048
Jeong, W., and Seong, J. (2014). Comparison of effects on technical variances of computational fluid dynamics (CFD) software based on finite element and finite volume methods. Int. J. Mech. Sci. 78, 19–26. doi:10.1016/j.ijmecsci.2013.10.017
Li, L. L., Wang, X. F., Ge, C. F., Xie, R., and Sun, T. (2007). Numerical and experimental investigation into the axial cooling fan on electric locomotive. CHALLENGES OF POWER ENGINEERING AND ENVIRONMENT VOLS 1 AND 2, 510. doi:10.1007/978-3-540-76694-0_93
Li, Z., Wang, G., Wang, S., and Hong, J. (2011). Vehicle interior noise measurement and analysis. Mater. MECHATRONICS AUTOMATION, PTS 467, 1072. doi:10.4028/www.scientific.net/KEM.467-469.1072
Lin, S., and Tsai, M. (2010). An integrated performance analysis for a small axial-flow fan. Proc. INSTITUTION Mech. Eng. PART C-JOURNAL Mech. Eng. Sci. 224 (C9), 14. doi:10.1243/09544062JMES1829
Makki, Z., Janda, M., and Deeb, R. (September 2012). Effect of blade rotation on the pressure on the outlet side of the fan. Proceedings of the twelfth International Conference on Low Temperature Physics, Kyoto, Japan.
Monreal, J. (2015). General Navier-Stokes-like momentum and mass-energy equations. Ann. Phys. 354, 5. doi:10.1016/j.aop.2015.01.026
Nakamura, S., Takahashi, M., Sato, K., and Yokota, K. (2014). Influence of an upstream obstacle on the flow characteristics of axial-flow fans. Proceedings of the asme fluids engineering division summer meeting, 46223 V01BT10A017. doi:10.1115/FEDSM2014-21251
Ocker, C., Czwielong, F., Chaitanya, P., Pannert, W., and Becker, S. (2022). Aerodynamic and aero acoustic properties of axial fan blades with slitted leading edges. ACTA ACUST. 6, 12. doi:10.1051/aacus/2022043
Park, M. J., and Lee, D. J. (2017). Sources of broadband noise of an automotive cooling fan. Appl. Acoust. 118, 66–75. doi:10.1016/j.apacoust.2016.10.007
Proot, M., and Gerritsma, M. I. (2006). Mass- and momentum conservation of the least-squares spectral element method for the Stokes problem. J. Sci. Comput. 27 (1-3), 13. doi:10.1007/s10915-005-9030-3
Rao, D. N., Bhatti, S. K., Kumar, S., and Kumar, R. (2007). CFD analysis of axial flow fans for radiator cooling in automobile engines. SAE Technical Paper. Pittsburgh, Pennsylvania
Spasic, Z., Jovanovic, M., and Bogdanovic-Jovanovic, J. (2018). Design and performanceoflow-pressurereversibleaxialfanwithdoublycurvedprofilesofblades. J. Mech. Sci. Technol. 32 (8), 6. doi:10.1007/s12206-018-0723-6
Sturm, M., and Carolus, T. (2012). Tonal fan noise of an isolated axial fan rotor due to inhomogeneous coherent structures at the intake. NOISE CONTROL Eng. J. 60 (6), 8. doi:10.3397/1.3701041
Tannoury, E., Khelladi, S., Demory, B., Henner, M., and Bakir, F. (2013). Influence of blade compactness and segmentation strategy on tonal noise prediction of an automotive engine cooling fan. Appl. Acoust. 74 (5), 782–787. doi:10.1016/j.apacoust.2012.11.015
Wang, S. W., Yu, X. K., Shen, L. X., Yang, A., Chen, E., Fieldhouse, J., et al. (2021). Noise reduction of automobile cooling fan based on bio-inspired design. Proc. INSTITUTION Mech. Eng. PART D-JOURNAL Automob. Eng. 235 (2-3), 465–478. doi:10.1177/0954407020959892
Wu, Y. D., Pan, D. H., Peng, Z. G., and Ouyang, H. (2019). Blade force model for calculating the axial noise of fans with unevenly spaced blades. Appl. Acoust. 146, 429–436. doi:10.1016/j.apacoust.2018.11.008
Yin, X., Le, G., and Zhang, J. (2012). Mass and momentum transfer across solid-fluid boundaries in the lattice-Boltzmann method. Phys. Rev. E 86 (2), 13. doi:10.1103/PhysRevE.86.026701
Yuan, Z. C., Zhao, F. Q., Chen, H. B., and Ma, J. Y. (2011). A simulation research on the noise and flow of vehicle cooling fans. Advanced Materials Research. 199. 988 doi:10.4028/www.scientific.net/AMR.199-200.988
Zhai, S. F., and Huxiao, W. Y. (2020). Study on noise reduction of fans with uneven blade spacing. IOP Conference Series: Earth and Environmental Science. 508. 012162 doi:10.1088/1755-1315/508/1/012162
Zhang, L., Jin, Y. Z., Zhao, Y., and Pin, L. (2011). Experimental and numerical investigation of blades effect on aero dynamic performance of small axial flow fan. Proc. ASME/JSME/KSME Jt. FLUIDS Eng. Conf. 44403, 203. doi:10.1115/AJK2011-06041
Zhao, H. M., Li, M., Ji, Y. Q., and Xie, X. (2014). Study on gas-liquid-solid three-phase flow field of radial-straight-vane wet fan. Applied Mechanics and Materials 607, 273. doi:10.4028/www.scientific.net/AMM.607.273
Keywords: automobile cooling fan, flow field, noise reduction, simulation calculation, finite element analysis
Citation: Ren K, Zhang S, Zhang H, Deng C and Sun H (2023) Flow field analysis and noise characteristics of an automotive cooling fan at different speeds. Front. Energy Res. 11:1259052. doi: 10.3389/fenrg.2023.1259052
Received: 15 July 2023; Accepted: 18 August 2023;
Published: 29 August 2023.
Edited by:
Wei Li, Jiangsu University, ChinaReviewed by:
Hongyue Zhou, Jiangsu University, ChinaLongfei Yang, Nanjing University of Science and Technology, China
Copyright © 2023 Ren, Zhang, Zhang, Deng and Sun. This is an open-access article distributed under the terms of the Creative Commons Attribution License (CC BY). The use, distribution or reproduction in other forums is permitted, provided the original author(s) and the copyright owner(s) are credited and that the original publication in this journal is cited, in accordance with accepted academic practice. No use, distribution or reproduction is permitted which does not comply with these terms.
*Correspondence: Kai Ren, a2FpcmVuQG5qZnUuZWR1LmNu