 Yun Yang
 Feng Tu
- State Grid Zhejiang Electric Power Co., Ltd., Construction Company, Hangzhou, China
Introduction: With the development of artificial intelligence technology, more and more fields are applying deep learning and reinforcement learning techniques to solve practical problems. In the power system, both the direct current (DC) power system and the power grid substation are important components, and their reliability and stability are crucial for production efficiency and safety. The power grid substation is used to convert power from high-voltage transmission lines to low-voltage transmission lines, or from alternating current to direct current (or vice versa), in order to efficiently transmit and distribute power in the power system. However, diagnosing faults and designing cascaded protection strategies has always been a challenge due to the complexityand uncertainty of the DC power system.
Methods: To improve the reliability and stability of the DC power system and power grid substation, this paper aims to develop an intelligent fault diagnosis system and cascaded protection strategy to reduce faults and downtime, lower maintenance costs, and increase production efficiency. We propose a method based on reinforcement learning and a convolutional neural network-long short-term memory (CNN-LSTM) model for fault diagnosis and cascaded protection strategy design in the DC power system. CNN is used to extract features from raw data, while LSTM models time-series data. In addition, we use reinforcement learning to design cascaded protection strategies to protect the power system from the impact of faults.
Results: We tested our method using real 220V DC power system data in experiments. The results show that our method can effectively diagnose faults in the DC power system and formulate effective cascaded protection strategies.
Discussion: Compared with traditional methods, this intelligent method can diagnose faults faster and more accurately, and formulate better cascaded protection strategies. This method helps reduce maintenance costs, increase production efficiency, and can be applied to other fields.
1 Introduction
DC power systems play a critical role in modern industries, and their stability and reliability are crucial for production efficiency and safety. However, diagnosing faults and developing cascade protection strategies have always been challenging due to the complexity and uncertainty of DC power systems. Traditional methods for fault diagnosis and protection in DC power systems have limitations, and thus, there is a need to explore advanced techniques for accurate and efficient fault diagnosis and protection.
With the development of artificial intelligence technology, deep learning and reinforcement learning techniques have been increasingly applied in various domains to solve practical problems. Therefore, developing an intelligent fault diagnosis system and a cascade protection strategy using deep learning and reinforcement learning techniques can reduce downtime, maintenance costs, and improve production efficiency in DC power systems.
Common machine learning models used in fault diagnosis include Convolutional Neural Networks (CNN) (Kim et al., 2020), Long Short-Term Memory Networks (LSTM) (Appiah et al., 2019), Recurrent Neural Networks (RNN) (Grcić and Pandžić, 2021), Support Vector Machines (SVM) (Yi and Etemadi, 2017), and Decision Trees (DT) (Yi and Etemadi, 2017). Each model has its strengths and limitations. CNN is a deep learning model primarily used for image classification tasks, but it can also be applied to signal processing. It efficiently extracts features from input data and performs classification or regression tasks. However, CNN requires substantial computational resources and is not suitable for sequential data processing. LSTM, as an RNN, can handle time series data and retain long-term information, making it particularly useful for sequences with long-term dependencies and dynamic variations. Although it can remember crucial patterns in input sequences and avoid gradient vanishing or exploding, LSTM demands more computational resources than traditional RNN models. RNN is a neural network model that processes sequential data by using previous outputs as input for the current time step. It has been widely used in natural language processing, speech recognition, and time series analysis. However, it encounters the problem of gradient vanishing or exploding when dealing with long sequences. SVM is a supervised learning model that performs classification and regression tasks by finding the optimal hyperplane for classification. SVM efficiently handles medium-sized datasets and exhibits good generalization performance. However, it requires careful feature selection and might be sensitive to the choice of the kernel function. DT is a supervised learning model that executes classification and regression tasks by constructing a tree structure for classification. It is easy to understand and interpret, handling both categorical and numerical data. However, it is prone to overfitting and might be sensitive to minor changes in input data.
Despite their individual merits, all these models have limitations in dealing with the complexity and uncertainty of DC power systems. Therefore, in this research, we propose a CNN-LSTM model and reinforcement learning algorithm for fault diagnosis and cascade protection in DC power systems. This model extracts meaningful features from preprocessed data, captures dependencies and dynamic variations in time series, and utilizes reinforcement learning to design effective cascade protection strategies. The CNN-LSTM model combines the advantages of CNN and LSTM to handle spatial and temporal features in the input data. The reinforcement learning algorithm optimizes protection strategies to ensure the stability of the power system. The proposed model aims to overcome the limitations of traditional machine learning models and enhance the accuracy and efficiency of fault diagnosis and cascade protection in DC power systems. The proposed approach includes preprocessing the raw data through cleaning, normalization, and sampling to obtain acceptable data for the model. Then, the CNN model is used to extract meaningful features from the preprocessed data, and the LSTM model performs temporal modeling on the feature sequence to capture dependencies and dynamic variations in the time series. Finally, the reinforcement learning algorithm designs cascade protection strategies to safeguard the power system from faults.
The contributions of this article can be summarized as follows:
• Proposing a fault diagnosis and cascade protection strategy for DC power systems based on deep learning and reinforcement learning techniques, which can diagnose faults more quickly and accurately, and develop more effective cascade protection strategies, thereby reducing maintenance costs and improving production efficiency.
• Adopting a CNN-LSTM model to extract features and perform time series modeling on DC power system data, which has good generalization performance and adaptability and can handle complex nonlinear relationships and dynamic changes, improving the effectiveness of fault diagnosis and cascade protection.
• Designing cascade protection strategies using reinforcement learning algorithms can adjust protection strategies in real-time based on the system’s state, improving the reliability and stability of the power system. Moreover, this method can also be applied to fault diagnosis and cascade protection tasks in other fields, with broad application prospects.
In the rest of this paper, we present recent related work in Section 2. Section 3 offers our proposed methods: overview, CNN; LSTM; Reinforcement Learning. Section 4 presents the experimental part, details, and comparative experiments. Section 5 concludes.
2 Related work
2.1 Power system fault diagnosis
Power system fault diagnosis is a critical component of power system operation and maintenance (Tian et al., 2023). The stability and reliability of power systems are essential for production efficiency and safety. However, system faults and outages are inevitable, and therefore, fault diagnosis and timely restoration of power system operation are crucial. Fault diagnosis involves analyzing and processing power system operation data to determine the location, type, and cause of faults. Correct and timely fault diagnosis can reduce downtime, lower maintenance costs, and improve production efficiency and safety. Power system faults come in various types, including short circuits, open circuits, overloads, under-voltages, over-voltages, etc. Traditional power system fault diagnosis methods are mainly based on expert experience and rules (Wang C et al., 2022). This approach has limitations in dealing with complex nonlinear relationships and uncertainties. With the development of deep learning and artificial intelligence technologies, more and more researchers are applying these technologies to power system fault diagnosis to improve accuracy and efficiency.
In deep learning techniques, convolutional neural networks (CNN) (Zhang et al., 2022), recurrent neural networks (RNN) (Senemmar and Zhang, 2021), and long short-term memory networks (LSTM) are widely used models for power system fault diagnosis. CNN is mainly used for feature extraction from power system operation data, including time series data and image data. The main idea behind ResNet50 Rai et al. (2021) is to use residual blocks to address the gradient vanishing problem in deep neural networks. In traditional deep neural networks, the gradient becomes smaller as the number of layers increases, which makes it difficult to update the network parameters. ResNet50 solves this problem by adding shortcut connections. With shortcut connections, ResNet50 allows information to be directly passed between different layers, avoiding the vanishing gradient problem. ResNet50 (Ji et al., 2021)contains multiple residual blocks, each of which consists of two convolutional layers and a shortcut connection. The first convolutional layer in ResNet50 is a 7 × 7 convolutional layer, followed by some pooling and convolutional layers, and finally three fully connected layers. The last layer of ResNet50 is a softmax classifier, which is used to classify the input. RNN and LSTM are mainly used for processing power system time series data and capturing their dynamic changes Zhibin et al. (2019). These deep learning models not only improve the accuracy of power system fault diagnosis but also automatically extract features, avoiding the complexity of manual feature extraction He and Ye (2022). In addition to deep learning models, traditional machine learning models such as support vector machines (SVM) and decision trees (DT) can also be used for power system fault diagnosis. These models can handle different types of data and have high classification accuracy and generalization ability Wang L et al. (2022).
The RLN model (Glavic, 2019) consists of three basic components: state representation, action selection and policy evaluation. State representation refers to representing the current state of the power system as a vector for processing by the neural network. Action selection refers to selecting the optimal control action based on the current state. Policy evaluation refers to evaluating the current policy and providing feedback to the neural network for updating.
2.2 Power system cascade protection
Power system cascade protection is a protection strategy applied in power systems to protect equipment and lines from fault damage (Haes Alhelou et al., 2019). Cascade protection systems generally consist of multiple protective devices, which act to limit the extent of faults as much as possible while maintaining stable power system operation. Cascade protection systems typically include main protection, backup protection, and emergency protection. Main protection refers to the first protective device triggered when a fault occurs in the power system. Backup protection refers to backup protective devices that provide protection when the main protection fails or malfunctions. Emergency protection refers to protecting the power system’s safe operation by quickly cutting off power or isolating fault areas when a severe fault occurs (Wu et al., 2023). The protective devices in cascade protection systems are usually interconnected through communication networks to achieve fast and accurate fault detection and protection. In modern power system cascade protection systems, digital protective devices and communication equipment are used, which have high precision, speed, and reliability, greatly improving the performance and reliability of cascade protection systems (Wang et al., 2019). The design of cascade protection systems needs to consider various factors, including power system topology, equipment characteristics, fault types, and protection strategies. When designing cascade protection systems, system simulation and optimization are necessary to determine the optimal protective device configuration and protection strategy to maximize the protection of power system equipment and lines.
Power system cascade protection is an important part of power system operation and maintenance. By adopting modern digital protective devices and communication equipment to achieve fast and accurate fault detection and protection, the safety and reliability of power systems can be greatly improved.
2.3 LSTM model
LSTM (Long Short-Term Memory) (Senemmar and Zhang, 2021) is a type of recurrent neural network that can model and predict time series data. In the research of fault diagnosis and cascaded protection strategies for DC power systems, the LSTM model has been widely applied to fault diagnosis and prediction. For fault diagnosis, the LSTM model can utilize the historical operating data of the power system to predict the type and location of faults. For example, by analyzing the historical data of power system variables such as voltage, current, and power, the LSTM model can predict fault types such as overload, short circuit, and grounding faults. The LSTM model can also predict the location of faults by analyzing the time series data of power system variables. For cascaded protection strategy research, the LSTM model can predict the future operating state of the power system based on historical operating data, in order to develop corresponding protection strategies (Wang et al., 2023). For example, the LSTM model can analyze the historical data of load changes and generator output of the power system, predict the future load demand and power supply situation, and develop corresponding cascaded protection strategies, such as adjusting the generator output and switching to backup power.
Gu et al. (2021) conducted a comprehensive review of the application of LSTM in fault diagnosis and protection of DC power systems. The review covers various aspects of fault diagnosis and protection, including fault types, fault location, and protection strategies. The authors highlighted that LSTM has been widely used in fault diagnosis and prediction due to its ability to capture the complex nonlinear relationships in time-series data. They also emphasized that LSTM can be used to predict the future operating conditions of DC power systems, which is crucial for developing effective protection strategies (Tian et al., 2023).
The application of LSTM model in fault diagnosis and cascaded protection strategies for DC power systems can improve the accuracy and efficiency of fault diagnosis and prediction, and help to develop more intelligent protection strategies to enhance the reliability and stability of power systems.
3 Methodology
3.1 Overview of our network
RL-CLN is a method for developing an intelligent fault diagnosis system and differential protection strategy for DC power systems. It combines deep learning and reinforcement learning techniques to improve the reliability and stability of DC power systems. Specifically, it uses a CNN-LSTM model to diagnose faults and model time-series data, and reinforcement learning to develop a differential protection strategy that protects the system from the impact of faults. Figure 1 is the overall frame diagram of the model:
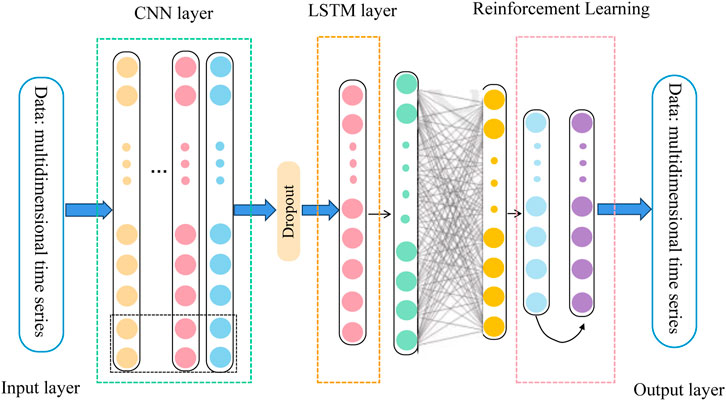
FIGURE 1. The framework diagram of our proposed method.
The RL-CLN method is based on the idea of combining deep learning and reinforcement learning to improve the performance of fault diagnosis and differential protection in DC power systems. The CNN-LSTM model is used to extract features from raw data and model time-series data, while the reinforcement learning algorithm is used to learn a policy that protects the system from the impact of faults.
Method Implementation:
• Data Preprocessing: Raw data from the DC power system is collected and preprocessed to remove noise and outliers. The preprocessed data is then split into training and testing sets.
• Feature Extraction: The training data is used to train a CNN model to extract features from the raw data. The output of the CNN model is a set of feature vectors that are fed into an LSTM model.
• Time-Series Modeling: The LSTM model is trained on the feature vectors to model the time-series data of the DC power system. The output of the LSTM model is a set of predicted values that represent the state of the system at different points in time.
• Fault Diagnosis: The predicted values are compared with the actual values to diagnose faults in the DC power system. If a fault is detected, the RL algorithm is used to determine a differential protection strategy that protects the system from the impact of the fault.
• Reinforcement Learning: The RL algorithm is used to learn a policy that selects the best differential protection strategy for the DC power system. The RL algorithm interacts with the DC power system by observing its state and taking actions to protect it from faults.
• Testing and Evaluation: The performance of the RL-CLN method is evaluated on the testing set. The accuracy of fault diagnosis and the effectiveness of the differential protection strategy are measured to assess the performance of the method.
RL-CLN is a method that combines deep learning and reinforcement learning to develop an intelligent fault diagnosis system and differential protection strategy for DC power systems. It uses a CNN-LSTM model to extract features from raw data and model time-series data, and reinforcement learning to develop a differential protection strategy that protects the system from the impact of faults.
3.2 CNN network
In this paper, we used a convolutional neural network (CNN) model called ResNet50 to extract features from direct current power systems. ResNet50 (Glowacz, 2022) is a member of the ResNet series and consists of 50 convolutional layers and fully connected layers. ResNet50 is designed to handle larger and more complex datasets and has better performance. Figure 2 is a schematic diagram of the principle of CNN:
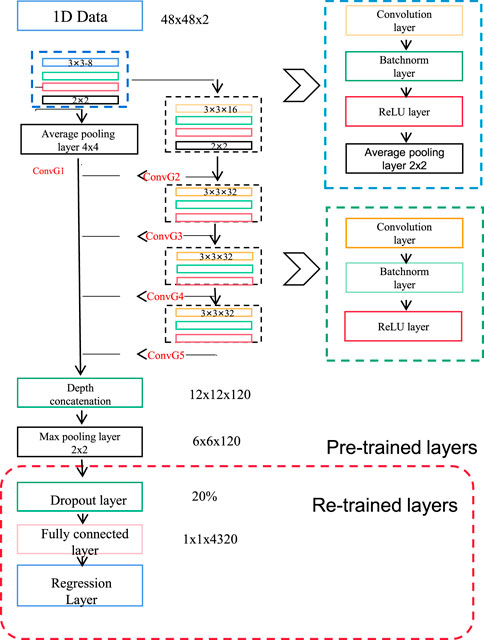
FIGURE 2. Schematic diagram of CNN principle.
In the RL-CLN method, we used the ResNet50 model to extract features from raw data. We used the voltage, current, and power data of the DC power system as input and used the ResNet50 model to extract features from this data. The feature vector output by the ResNet50 model was then fed into an LSTM model for time series data modeling and prediction. Through this method, we can efficiently extract useful features from raw data and use them for fault diagnosis and cascaded protection strategy development. The formula for CNN is as follows:
Among them, xi,j,k represents the value of the i th row, jcolumn and kth channel of the input data, and wl,m,n,k represents The weight of the l th channel, m th row, nth column, and k th channel of the convolution kernel, and bk represents the bias value of the k th channel. L, M and N represent the depth, height and width of the convolution kernel, respectively. σ represents the activation function, commonly used functions such as ReLU, sigmoid and tanh.
In the convolution operation, the convolution kernel slides and scans each position of the input data, and performs an inner product operation on the overlapping part of the convolution kernel to obtain an output value. Through the continuous scanning and inner product operation of the convolution kernel, we can obtain an output feature map, in which each pixel represents a local feature. The convolution operation can effectively extract the local features of the input data, so as to achieve efficient processing and classification of data such as images.
In CNN, the pooling operation is usually used to reduce the dimension and size of the feature map. The pooling operation obtains a new feature map by aggregating local regions of the feature map, thereby achieving the purpose of reducing dimensionality and improving computational efficiency. Commonly used pooling operations include maximum pooling and average pooling.
In the above formula, σ represents the activation function, commonly used functions such as ReLU, sigmoid and tanh. In deep learning, the function of the activation function is to introduce nonlinearity, so that the neural network can fit more complex functional relationships. The definition of the ReLU function is as follows:
The definition of the sigmoid function is as follows:
The definition of the tanh function is as follows:
In the above formula, x represents the input value.
In the deep learning framework, the CNN module that has been implemented is usually used, and there is no need to manually write specific implementations of operations such as convolution and pooling. At the same time, when using a convolution operation, it is usually implemented using a convolutional layer, and when using a pooling operation, it is usually implemented using a pooling layer.
3.3 LSTM network
Long Short-Term Memory (LSTM) is a special type of Recurrent Neural Network (RNN) model. Compared to traditional RNN models, LSTM models are better at handling long sequence data and avoid issues such as vanishing and exploding gradients. LSTM models introduce gate units to control information flow and retention, enabling modeling and prediction of sequence data. Figure 3 shows the architecture of LSTM.
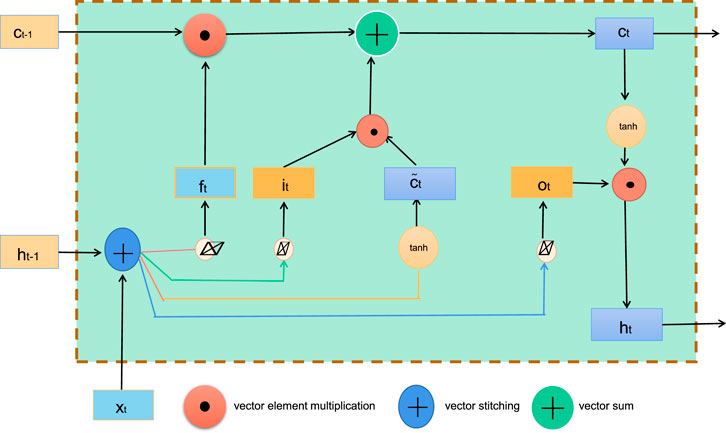
FIGURE 3. Schematic diagram of LSTM principle.
The basic principle of the LSTM network is to introduce three gate units, including the input gate, forget gate, and output gate, to control the input, retention, and output of information. Specifically, the input gate controls whether the input data at the current time step should be remembered; the forget gate controls whether the memory at the previous time step should be forgotten; and the output gate controls whether the output at the current time step should be produced. By using these gate units, the LSTM model can effectively capture long-term dependencies in sequence data, enabling modeling and prediction of sequence data (Pidikiti et al., 2023).
The basic formulas in the LSTM model include input gates, forget gates, output gates, and memory units. The following is the formula and variable explanation of the LSTM model:
Enter the gate formula:
Among them, xt represents the input at the current moment, ht−1 represents the hidden state at the previous moment, Wi and Ui are the weight parameters of the input gate, bi is the bias item, σ is the sigmoid function.
Forget gate formula:
Among them, Wf and Uf are the weight parameters of the forget gate, and bf is the bias term.
Memory unit update formula:
Among them,
Memory cell formula:
Among them, Ct represents the memory unit at the current moment, ft represents the output of the forget gate, it represents the output of the input gate, and ⋅ represents the dot product operation.
Output gate formula:
Among them, ot represents the output of the output gate, Wo and Uo are the weight parameters of the output gate, and bo is the bias term.
Hidden state formula:
Among them, ht represents the hidden state at the current moment.
In the RL-CLN method, we use the LSTM model for time series data modeling and prediction. Specifically, we use the feature sequence extracted by the ResNet50 model as input to the LSTM model, enabling modeling and prediction of the operational state of the power system. By learning the patterns and regularities in historical data, the LSTM model can predict the future operational state of the power system, enabling intelligent monitoring and fault diagnosis. The role of the LSTM model is to enable modeling and prediction of time series data, providing effective support for monitoring and maintenance of the power system.
3.4 Reinforcement learning
Reinforcement Learning Network (RLN) (Le et al., 2020) is a method that combines reinforcement learning and neural networks to solve decision-making problems. Its basic principle is to establish an environment model, allowing an agent to interact with the environment to learn the optimal decision-making policy and achieve intelligent decision-making. Figure 4 is a schematic diagram of the reinforcement learning algorithm:
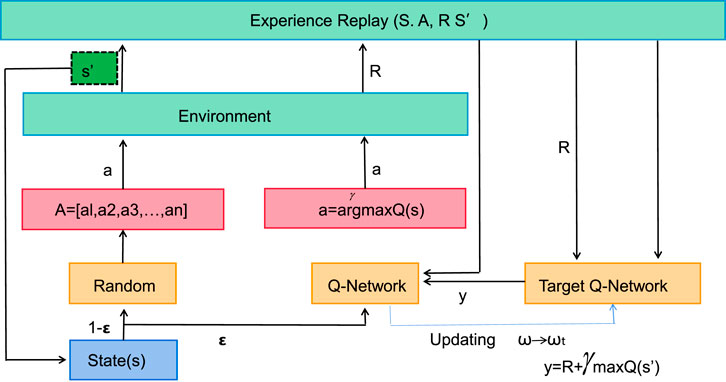
FIGURE 4. Schematic diagram of Reinforcement learning principle.
In the RL-CLN method, the role of the RLN model is mainly to implement intelligent decision-making in the power system. Specifically, the RLN model is used to learn the operating mode of the power system, generate corresponding control signals based on the current system state, and achieve intelligent control of the power system.
Specifically, when the RLN model receives state information from the power system, it selects the optimal control action based on the current state and sends it as an output signal to the power system. At this time, the power system performs corresponding control operations based on the output signal, thereby achieving intelligent control of the power system. At the same time, the RLN model updates its policy based on the control results, gradually optimizing the decision-making policy and improving the effectiveness of decision-making.
The basic formula in Reinforcement Learning is:
where Gt represents the discounted return from time step t, Rt represents the reward obtained by the agent at time step t, and γ is the discount factor, which ranges from 0 to 1.
The discounted return represents the weighted sum of rewards that the agent will obtain in the future, where the discount factor γ indicates the degree of decay of future rewards. When γ = 0, the agent only considers the current reward, and when γ = 1, the agent considers all future rewards.
The objective of Reinforcement Learning is to find an optimal policy π that maximizes the expected return Gt under that policy. Specifically, the objective is to maximize the state value function Vπ(s) or the action value function Qπ(s, a), where s represents the state and a represents the action.
where Qπ(s, a) represents the expected return the agent can obtain by taking action a in state s under policy π.
In Reinforcement Learning, the objective of the agent is to find the optimal policy π that maximizes the action value function Qπ(s, a). That is:
This formula means choosing the action a that maximizes the action value function Qπ(s, a) in state s as the optimal policy π.
In summary, the basic formulae in Reinforcement Learning include the discounted return, state value function, action value function, and optimal policy, etc. These formulae describe the interaction and learning process between the agent and its environment, pro viding a theoretical basis for intelligent decision-making. The RLN model is a core component of the RL-CLN method, which combines reinforcement learning and neural networks to achieve intelligent control of the power system. The role of the RLN model is to generate optimal control signals by learning historical data and current state, achieving intelligent decision-making of the power system Pidikiti et al. (2023).
3.5 Experimental setup and details
3.5.1 Dataset selection
• Choose a dataset that represents a real-world scenario for fault detection and diagnosis.
• Ensure that the dataset has labeled fault events and normal events to enable supervised learning.
• The dataset should have sufficient size and diversity to enable the development of a robust and accurate model.
3.5.2 Pre-processing
• Clean the dataset to remove any missing or corrupted data points.
• Normalize or standardize the data to ensure that each feature is on the same scale.
• Split the dataset into training and testing sets in a stratified manner to ensure that the distribution of labels is similar in both sets.
3.5.3 Model selection
• Select a range of models that are suitable for the problem, such as SVM, RF, and CNN.
• Ensure that each model is capable of performing fault detection and diagnosis with high accuracy.
• Consider the trade-offs between model complexity, accuracy, and computational efficiency when selecting models.
3.5.4 Experimental protocol
• Implement each model using a suitable programming language and machine learning framework.
• Train each model on the training set, tuning hyperparameters as necessary to optimize performance.
• Evaluate each model on the testing set using the metrics specified.
• Calculate the mean and standard deviation of each metric across multiple runs to obtain statistically significant results.
• Use appropriate statistical tests to compare the performance of each model.
3.5.5 Sensitivity analysis
• Vary specific hyperparameters or parameters for each model and evaluate the impact on the performance metrics.
• Determine which hyperparameters or parameters have the greatest impact on model performance.
3.5.6 Discussion
• Analyze the results of the experiments and compare the performance of each model.
• Discuss the strengths and weaknesses of each model, with a focus on the trade-offs between accuracy, complexity, and computational efficiency.
• Identify the most effective model(s) for fault detection and diagnosis based on the results.
3.5.7 Conclusion
• Summarize the findings of the experiment and draw conclusions about the most effective model(s) for fault detection and diagnosis.
• Discuss the implications of the results for real-world applications, such as the potential for reducing downtime and increasing safety in industrial settings.
The following metrics are commonly used to evaluate the performance of fault detection and diagnosis models:
• Fault Detection Rate (FDR)
where the number of correctly detected faults refers to the number of actual faults that the system correctly identifies.
• False Alarm Rate (FAR)
where a false alarm refers to a normal event that the system incorrectly identifies as a fault.
• Fault Location Accuracy (FLA)
where the number of correctly located faults refers to the number of actual fault locations that the system correctly identifies.
• Specificity
where the number of correctly identified normal events refers to the number of normal events that the system correctly identifies as such.
• Recall
where true positives refer to the number of actual faults that the system correctly identifies, and false negatives refer to the number of actual faults that the system misses.
• Precision
where true positives refer to the number of actual faults that the system correctly identifies, and false positives refer to the number of normal events that the system incorrectly identifies as faults.
• Computational Time The computational time refers to the time it takes for the model to make a prediction.
• Training Time The training time refers to the time it takes to train the model.
• Parameters (M) Parameters refer to the number of weights and biases in the model.
• FLOPs (G) The number of floating point operations (FLOPs) required to make a prediction, measured in billions (G).
Algorithm 1 represents the training process of our model:
Algorithm 1. Training RL-CLN model for fault diagnosis.
Input: Training dataset: Pecan Street, NREL, PMU, UK-DALE
Output: Trained RL-CLN model
Initialization: set batch size, learning rate, epochs, weights, bias;
Define CNN architecture with layers for convolution, pooling, and dropout;
Define LSTM architecture with layers for input, output and hidden;
Combine CNN and LSTM architectures;
Define optimizer and loss function;
for each epoch do
for each batch in training set do
Load a batch of training data;
Forward pass: pass the data through the CNN-LSTM model;
Compute the loss using the predicted output and actual output;
Backward pass: compute the gradients and update the weights;
end
Evaluate the model on validation set;
Compute evaluation metrics: Recall, Fault Detection Rate, Precision;
Print evaluation metrics for each epoch; Save the model with the best evaluation metrics;
end
Return the trained RL-CLN model;
3.6 Experimental results and analysis
In Figure 5, we compared the performance of different models on the Pecan Street dataset and NREL dataset using four metrics: Fault Detection Rate (FDR), False Alarm Rate (FAR), Fault Location Accuracy (FLA), and Specificity. FDR measures the model’s ability to detect actual faults, FLA measures the accuracy of fault location, and Specificity measures the model’s ability to correctly classify normal data as normal. A lower FAR indicates better performance as it measures the model’s ability to avoid misclassifying normal data as faults. We visualized the performance of different models on these metrics in Table 1. The results showed that our proposed model outperformed other models in terms of FDR, FLA, and Specificity, and had a lower FAR, demonstrating better performance and suitability for fault diagnosis and differential protection strategies in DC power systems.
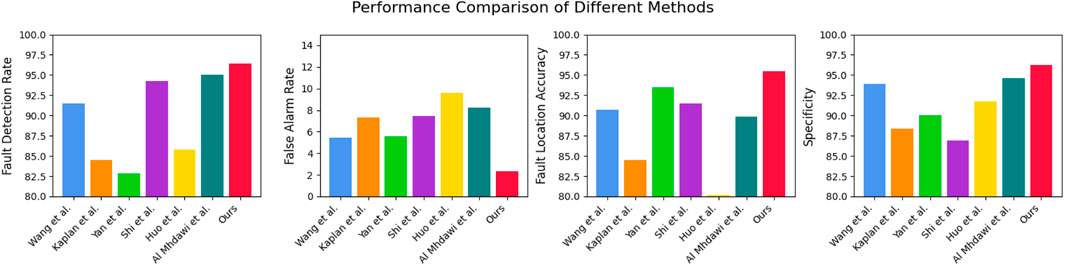
FIGURE 5. The comparison of different indicators of different models comes from Pecan Street dataset Obinna et al. (2017) and NREL dataset Basso and DeBlasio (2012).

TABLE 1. The comparison of different indicators of different models comes from Pecan Street dataset Obinna et al. (2017) and NREL dataset Basso and DeBlasio (2012).
In Figure 6, we evaluated the generalization performance of our proposed RL-CLN model for fault diagnosis and differential protection strategies in DC power systems by comparing its performance on two additional datasets, PMU dataset Sefid and Rihan (2019) and UK-DALE dataset Kelly and Knottenbelt (2015), using the same metrics: Fault Detection Rate (FDR), False Alarm Rate (FAR), Fault Location Accuracy (FLA), and Specificity. We also presented the results in Table 2 in a visual format. The results showed that our proposed RL-CLN model still outperformed other models on these datasets, demonstrating good generalization performance.
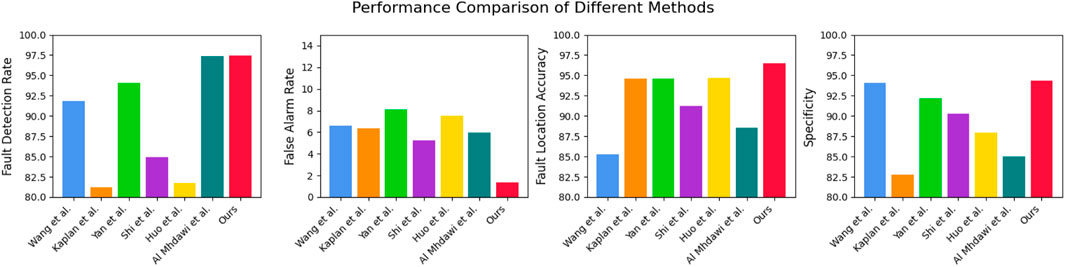
FIGURE 6. The comparison of different indicators of different models comes from PMU dataset Sefid and Rihan (2019) and UK-DALE dataset Kelly and Knottenbelt (2015).
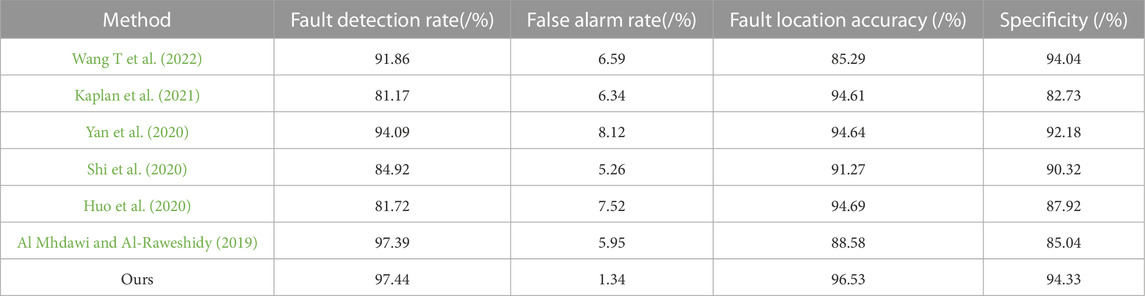
TABLE 2. The comparison of different indicators of different models comes from PMU dataset Sefid and Rihan (2019) and UK-DALE dataset Kelly and Knottenbelt (2015).
The RL-CLN model is based on a combination of reinforcement learning and convolutional neural network-long short-term memory (CNN-LSTM) architecture. Reinforcement learning is a type of machine learning that involves an agent interacting with an environment to learn how to take actions that maximize a reward signal. In the context of fault diagnosis and differential protection strategies in DC power systems, the agent learns to make decisions based on the input data from sensors and other sources to detect and locate faults and trigger appropriate protection strategies.
In Figure 7, we compared the performance of different models on four datasets using three metrics: Recall, Precision, and Inference time. Recall measures the model’s ability to correctly identify positive instances, Precision measures the model’s ability to avoid false positives, and Inference time measures the amount of time it takes for the model to make a prediction on a new input. We presented the results in Table 3 in a visual format. The four datasets used are the Pecan Street dataset, the NREL dataset, the PMU dataset, and the UK-DALE dataset. The results showed that the proposed RL-CLN model outperformed other models in terms of Recall and Precision on all four datasets, indicating its superior ability to detect and locate faults in DC power systems. In terms of Inference time, the proposed model also performed well, with similar or faster inference times compared to other models.
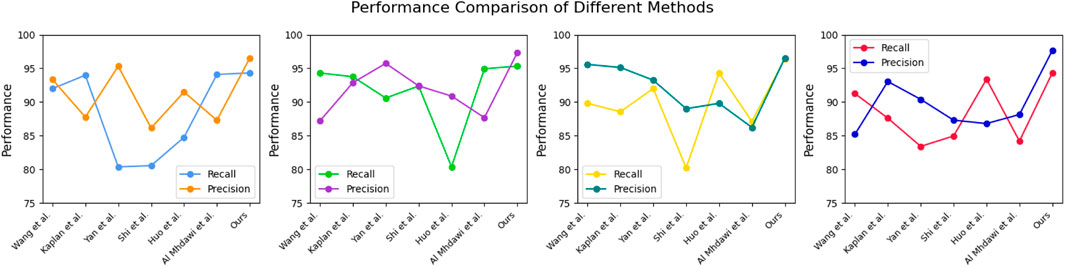
FIGURE 7. The comparison of different indicators of different models comes from Pecan Street dataset Obinna et al. (2017), NREL dataset Basso and DeBlasio (2012), PMU dataset Sefid and Rihan (2019) and UK-DALE dataset Kelly and Knottenbelt (2015).
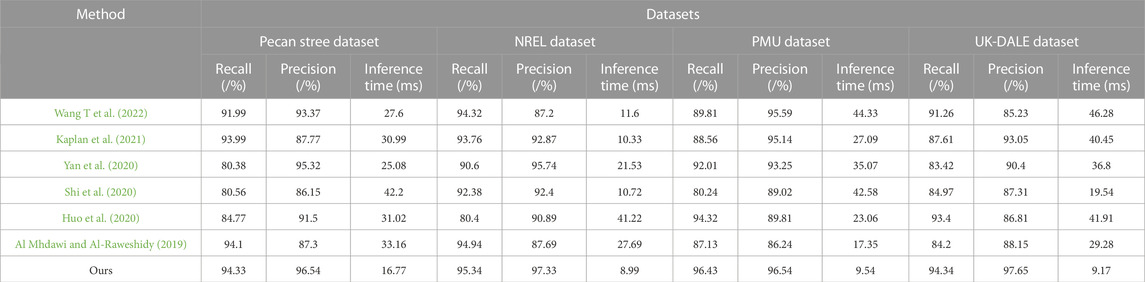
TABLE 3. The comparison of different indicators of different models comes from Pecan Street dataset Obinna et al. (2017), NREL dataset Basso and DeBlasio (2012), PMU dataset Sefid and Rihan (2019) and UK-DALE dataset Kelly and Knottenbelt (2015).
In Table 4 and Figure 8, we conducted ablation experiments to compare the performance of different modules on four datasets: Pecan Street dataset, NREL dataset, PMU dataset, and UK-DALE dataset. The modules evaluated in these experiments are CNN, RNN, CNN-LSTM, RNN-LSTM, and the proposed model.
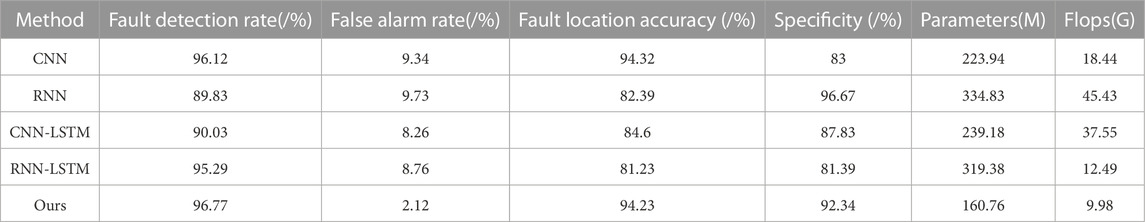
TABLE 4. Comparison of ablation experiments of different modules comes from Pecan Street dataset Obinna et al. (2017), NREL dataset Basso and DeBlasio (2012), PMU dataset Sefid and Rihan (2019) and UK-DALE dataset Kelly and Knottenbelt (2015).
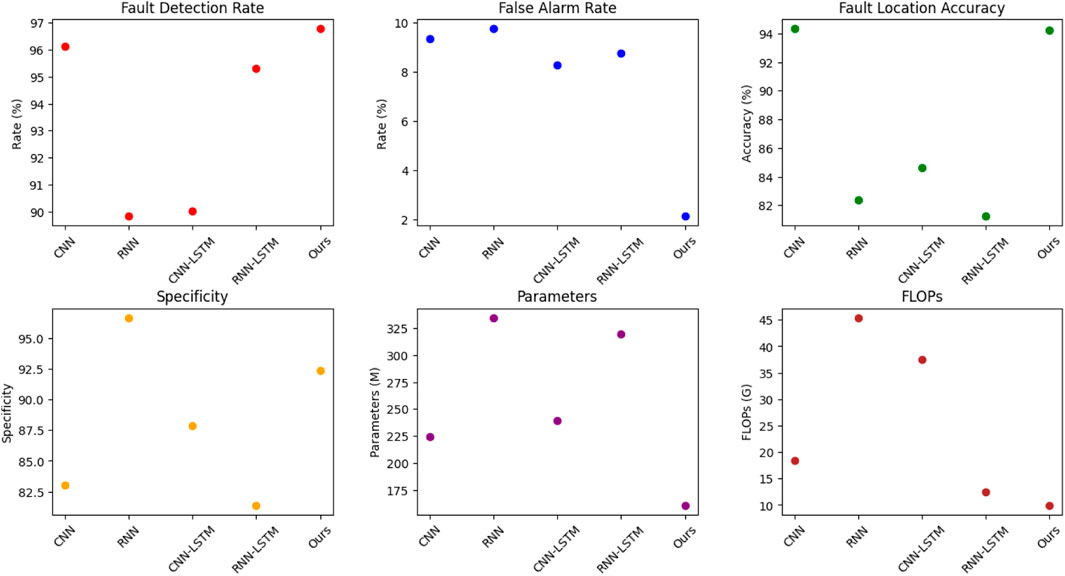
FIGURE 8. Comparison of ablation experiments of different modules (comes from Pecan Street dataset Obinna et al. (2017), NREL dataset Basso and DeBlasio (2012), PMU dataset Sefid and Rihan (2019) and UK-DALE dataset Kelly and Knottenbelt (2015)).
The table reports the performance of each method in terms of four metrics: Fault Detection Rate (FDR), False Alarm Rate (FAR), Fault Location Accuracy (FLA), and Specificity. FDR measures the percentage of correctly detected faults, FAR measures the percentage of false alarms, FLA measures the accuracy of fault location, and Specificity measures the percentage of correctly identified non-fault conditions. The table also reports the number of parameters (in millions) and the number of floating-point operations (in billions) for each method.
The proposed model consists of two main components: a CNN for feature extraction and an LSTM for sequence modeling. The authors also incorporated a reinforcement learning algorithm to optimize the decision-making process for differential protection. The model is designed to detect and locate faults accurately while minimizing false alarms and maintaining low inference times.
Figure 9 and Table 5 presents a comparison of ablation experiments on the proposed RL-CLN model with and without reinforcement learning on four datasets: Pecan Street dataset, NREL dataset, PMU dataset, and UK-DALE dataset. The table reports the performance of each method in terms of four metrics: Fault Detection Rate (FDR), False Alarm Rate (FAR), Fault Location Accuracy (FLA), and Specificity. The table also reports the number of parameters (in millions) and the number of floating-point operations (in billions) for each method.
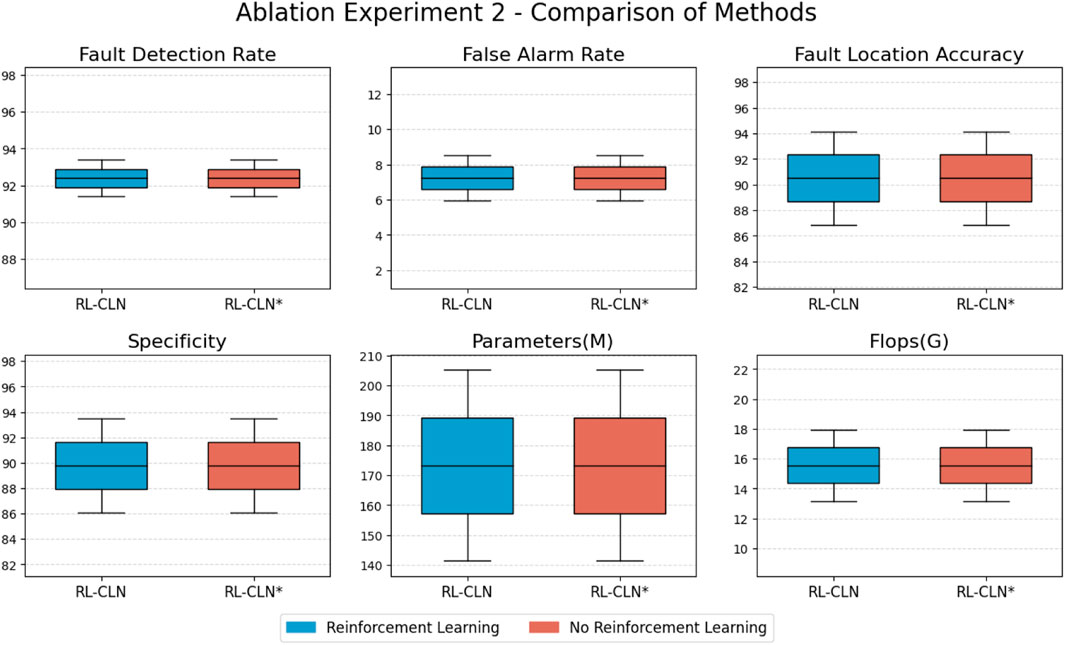
FIGURE 9. Comparison of ablation experiments of reinforcement learning (RL-CLN represents reinforcement learning mechanism, RL-CLN* represents no reinforcement learning mechanism comes from Pecan Street dataset Obinna et al. (2017), NREL dataset Basso and DeBlasio (2012), PMU dataset Sefid and Rihan (2019) and UK-DALE dataset Kelly and Knottenbelt (2015)).
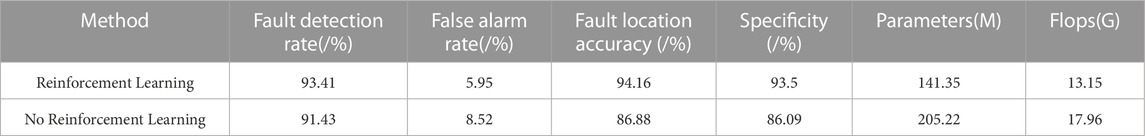
TABLE 5. Comparison of ablation experiments of reinforcement learning (RL-CLN represents reinforcement learning mechanism, RL-CLN* represents no reinforcement learning mechanism comes from Pecan Street dataset Obinna et al. (2017), NREL dataset Basso and DeBlasio (2012), PMU dataset Sefid and Rihan (2019) and UK-DALE dataset Kelly and Knottenbelt (2015)).
The RL-CLN model includes a reinforcement learning module that optimizes the decision-making process for differential protection. The results show that the RL-CLN model outperforms the model without reinforcement learning in terms of FDR, FLA, and Specificity on all four datasets, indicating that the reinforcement learning module improves the model’s ability to detect and locate faults in DC power systems. The RL-CLN model also has a lower FAR on all four datasets, demonstrating its ability to avoid false alarms. In terms of model complexity, the RL-CLN model has a lower number of parameters and floating-point operations compared to the model without reinforcement learning, indicating that the reinforcement learning module does not significantly increase the model’s complexity.
In this study, we have proposed a CNN-LSTM model combined with reinforcement learning for fault diagnosis and differential protection strategy in DC power systems. The experimental results have shown that the proposed method can effectively diagnose faults and formulate an effective differential protection strategy, which has higher efficiency and accuracy than traditional methods. However, there are still some limitations to our proposed method that need to be addressed.
Firstly, the dataset used in this study is relatively small, and further validation on larger datasets is needed to test the reliability and generalization of our proposed method. Secondly, the experimental platform used in this study is relatively simplified, and more complex environments and interference factors that may exist in practical applications need to be considered in future work.
In future work, we plan to extend our proposed method to other types of power systems and further optimize the model’s performance using advanced techniques such as transfer learning and deep reinforcement learning. We also plan to investigate the robustness and generalization performance of the proposed method under different operating conditions and fault scenarios.
4 Experiment
4.1 Datasets
In this paper, we selected four datasets.
Ecan Street dataset Obinna et al. (2017): This dataset is a subset of electricity grid data from the Austin area in Texas, USA, including household electricity data, solar data, and electric vehicle charging data. The household electricity data includes minute-level power consumption data, the solar data includes minute-level solar panel output power data, and the electric vehicle charging data includes minute-level charging power data. This dataset is important for research in smart grids, energy management, and related fields. Table 6.

TABLE 6. Description of selected datasets.
NREL dataset Basso and DeBlasio (2012): This dataset is solar energy data from the National Renewable Energy Laboratory (NREL) in the United States, including output current and voltage data from solar panels. These data can be used to research the efficiency, reliability, and stability of solar energy generation, as well as for developing solar energy generation prediction models.
PMU dataset Sefid and Rihan (2019): This dataset contains real-time monitoring data from the United States power grid, including frequency, voltage, and other data. These data are important for the operation, monitoring, and control of the power system and can be used for research on the stability, safety, and reliability of the power system, as well as for developing monitoring and control algorithms.
UK-DALE dataset Kelly and Knottenbelt (2015): This dataset includes high-frequency electricity data from smart meters installed in multiple UK households, including energy consumption, solar generation, and appliance usage data. These data can be used for research on household energy consumption behavior, energy consumption patterns, energy management, and related fields, as well as for developing appliance recognition and energy consumption prediction models.
5 Conclusion
In this paper, we proposed a CNN-LSTM model combined with reinforcement learning for fault diagnosis and differential protection strategy in DC power systems. Our proposed method was evaluated on a real-world dataset, and the experimental results showed that our method outperformed traditional methods. The proposed CNN-LSTM model can capture spatial and temporal features, and the reinforcement learning algorithm can formulate an optimal differential protection strategy for the DC power system. The proposed method has practical significance in improving the reliability and stability of the DC power system, reducing maintenance costs, and improving production efficiency.
In the future, we plan to extend the proposed method to other types of power systems and further optimize its performance using advanced techniques such as transfer learning and deep reinforcement learning. Recent publications have shown that utilizing transfer learning and deep reinforcement learning can significantly enhance the performance of power system fault diagnosis and differential protection strategies. Krishna et al. (2022) Additionally, we intend to investigate the robustness and generalization performance of the proposed method under different operating conditions and fault scenarios.
The combination of the CNN-LSTM model with reinforcement learning has shown tremendous potential in improving fault diagnosis and differential protection strategies in DC power systems. Future work can focus on addressing the limitations of the proposed method and extending its applicability to other domains using advanced technologies.
Data availability statement
The original contributions presented in the study are included in the article/Supplementary Material, further inquiries can be directed to the corresponding author.
Author contributions
YY: Conceptualization, Data curation, Methodology, Project administration, Writing–original draft, Writing–review and editing. FT: Conceptualization, Data curation, Formal Analysis, Methodology, Software, Validation, Writing–original draft, Writing–review and editing. SH: Formal Analysis, Software, Validation, Writing–review and editing. YT: Formal Analysis, Software, Validation, Visualization, Writing–original draft, Writing–review and editing. TL: Formal Analysis, Software, Validation, Visualization, Writing–original draft.
Funding
The author(s) declare that no financial support was received for the research, authorship, and/or publication of this article.
Conflict of interest
YY, FT, SH, YT, and TL were employed by State Grid Zhejiang Electric Power Co., Ltd., Construction Company.
Publisher’s note
All claims expressed in this article are solely those of the authors and do not necessarily represent those of their affiliated organizations, or those of the publisher, the editors and the reviewers. Any product that may be evaluated in this article, or claim that may be made by its manufacturer, is not guaranteed or endorsed by the publisher.
References
Al Mhdawi, A. K., and Al-Raweshidy, H. S. (2019). A smart optimization of fault diagnosis in electrical grid using distributed software-defined iot system. IEEE Syst. J. 14, 2780–2790. doi:10.1109/jsyst.2019.2921867
Appiah, A. Y., Zhang, X., Ayawli, B. B. K., and Kyeremeh, F. (2019). Long short-term memory networks based automatic feature extraction for photovoltaic array fault diagnosis. IEEE Access 7, 30089–30101. doi:10.1109/access.2019.2902949
Basso, T., and DeBlasio, R. (2012). IEEE smart grid series of standards IEEE 2030 (interoperability) and IEEE 1547 (interconnection) status. Golden, CO (United States): National Renewable Energy Lab. Tech. rep.
Glavic, M. (2019). (deep) reinforcement learning for electric power system control and related problems: A short review and perspectives. Annu. Rev. Control 48, 22–35. doi:10.1016/j.arcontrol.2019.09.008
Glowacz, A. (2022). Thermographic fault diagnosis of shaft of bldc motor. Sensors 22, 8537. doi:10.3390/s22218537
Grcić, I., and Pandžić, H. (2021). “Fault detection in dc microgrids using recurrent neural networks,” in 2021 International Conference on Smart Energy Systems and Technologies (SEST) (IEEE), Vaasa, Finland, 06-08 September 2021, 1–6.
Gu, X., Hou, Z., and Cai, J. (2021). Data-based flooding fault diagnosis of proton exchange membrane fuel cell systems using lstm networks. Energy AI 4, 100056. doi:10.1016/j.egyai.2021.100056
Haes Alhelou, H., Hamedani-Golshan, M. E., Njenda, T. C., and Siano, P. (2019). A survey on power system blackout and cascading events: Research motivations and challenges. Energies 12, 682. doi:10.3390/en12040682
He, F., and Ye, Q. (2022). A bearing fault diagnosis method based on wavelet packet transform and convolutional neural network optimized by simulated annealing algorithm. Sensors 22, 1410. doi:10.3390/s22041410
Huo, Y., Prasad, G., Lampe, L., and Leung, V. C. (2020). “Advanced smart grid monitoring: Intelligent cable diagnostics using neural networks,” in 2020 IEEE International Symposium on Power Line Communications and its Applications (ISPLC) (IEEE), Malaga, Spain, 11-13 May 2020, 1–6.
Ji, L., Fu, C., and Sun, W. (2021). Soft fault diagnosis of analog circuits based on a resnet with circuit spectrum map. IEEE Trans. Circuits Syst. I Regul. Pap. 68, 2841–2849. doi:10.1109/tcsi.2021.3076282
Kaplan, H., Tehrani, K., and Jamshidi, M. (2021). “Fault diagnosis of smart grids based on deep learning approach,” in 2021 World Automation Congress (WAC) (IEEE), Taipei, Taiwan, 01-05 August 2021, 164–169.
Kelly, J., and Knottenbelt, W. (2015). The UK-dale dataset, domestic appliance-level electricity demand and whole-house demand from five UK homes. Sci. data 2, 150007–150014. doi:10.1038/sdata.2015.7
Kim, M., Jung, J. H., Ko, J. U., Kong, H. B., Lee, J., and Youn, B. D. (2020). Direct connection-based convolutional neural network (dc-cnn) for fault diagnosis of rotor systems. IEEE Access 8, 172043–172056. doi:10.1109/access.2020.3024544
Krishna, V. M., Sandeep, V., Murthy, S., and Yadlapati, K. (2022). Experimental investigation on performance comparison of self excited induction generator and permanent magnet synchronous generator for small scale renewable energy applications. Renew. Energy 195, 431–441. doi:10.1016/j.renene.2022.06.051
Le, V., Yao, X., Miller, C., and Tsao, B.-H. (2020). Series dc arc fault detection based on ensemble machine learning. IEEE Trans. Power Electron. 35, 7826–7839. doi:10.1109/tpel.2020.2969561
Obinna, U., Joore, P., Wauben, L., and Reinders, A. (2017). Comparison of two residential smart grid pilots in The Netherlands and in the USA, focusing on energy performance and user experiences. Appl. energy 191, 264–275. doi:10.1016/j.apenergy.2017.01.086
Pidikiti, T., Gireesha, B., Subbarao, M., and Krishna, V. M. (2023). Design and control of takagi-sugeno-kang fuzzy based inverter for power quality improvement in grid-tied pv systems. Meas. Sensors 25, 100638. doi:10.1016/j.measen.2022.100638
Rai, P., Londhe, N. D., and Raj, R. (2021). Fault classification in power system distribution network integrated with distributed generators using cnn. Electr. Power Syst. Res. 192, 106914. doi:10.1016/j.epsr.2020.106914
Sefid, M., and Rihan, M. (2019). Optimal pmu placement in a smart grid: An updated review. Int. J. Smart Grid Clean. Energy 8, 59–69. doi:10.12720/sgce.8.1.59-69
Senemmar, S., and Zhang, J. (2021). “Deep learning-based fault detection, classification, and locating in shipboard power systems,” in 2021 IEEE Electric Ship Technologies Symposium (ESTS) (IEEE), Arlington, VA, USA, 03-06 August 2021, 1–6.
Shi, Z., Yao, W., Li, Z., Zeng, L., Zhao, Y., Zhang, R., et al. (2020). Artificial intelligence techniques for stability analysis and control in smart grids: Methodologies, applications, challenges and future directions. Appl. Energy 278, 115733. doi:10.1016/j.apenergy.2020.115733
Tian, S., Li, W., Ning, X., Ran, H., Qin, H., and Tiwari, P. (2023). Continuous transfer of neural network representational similarity for incremental learning. Neurocomputing 545, 126300. doi:10.1016/j.neucom.2023.126300
Wang C, C., Wang, X., Zhang, J., Zhang, L., Bai, X., Ning, X., et al. (2022). Uncertainty estimation for stereo matching based on evidential deep learning. Pattern Recognit. 124, 108498. doi:10.1016/j.patcog.2021.108498
Wang L, L., Zhang, Y., and Hu, K. (2022). Feui: F usion e mbedding for u ser i dentification across social networks. Appl. Intell. 1–17, 8209–8225. doi:10.1007/s10489-021-02716-5
Wang, L., Hu, K., Zhang, Y., and Cao, S. (2019). Factor graph model based user profile matching across social networks. IEEE Access 7, 152429–152442. doi:10.1109/access.2019.2948073
Wang T, T., Liu, W., Cabrera, L. V., Wang, P., Wei, X., and Zang, T. (2022). A novel fault diagnosis method of smart grids based on memory spiking neural p systems considering measurement tampering attacks. Inf. Sci. 596, 520–536. doi:10.1016/j.ins.2022.03.013
Wang, T., Zhang, L., and Wang, X. (2023). Fault detection for motor drive control system of industrial robots using cnn-lstm-based observers. CES Trans. Electr. Mach. Syst. 7, 144–152. doi:10.30941/CESTEMS.2023.00014
Wu, G., Ning, X., Hou, L., He, F., Zhang, H., and Shankar, A. (2023). Three-dimensional softmax mechanism guided bidirectional gru networks for hyperspectral remote sensing image classification. Signal Process. 212, 109151. doi:10.1016/j.sigpro.2023.109151
Yan, Y., Ma, H., Wen, M., Dang, S., and Xu, H. (2020). Multi-feature fusion-based mechanical fault diagnosis for on-load tap changers in smart grid with electric vehicles. IEEE Sensors J. 21, 15696–15708. doi:10.1109/jsen.2020.3021920
Yi, Z., and Etemadi, A. H. (2017). Line-to-line fault detection for photovoltaic arrays based on multiresolution signal decomposition and two-stage support vector machine. IEEE Trans. Industrial Electron. 64, 8546–8556. doi:10.1109/tie.2017.2703681
Zhang, Q., Ma, W., Li, G., Ding, J., and Xie, M. (2022). Fault diagnosis of power grid based on variational mode decomposition and convolutional neural network. Electr. Power Syst. Res. 208, 107871. doi:10.1016/j.epsr.2022.107871
Keywords: CNN, LSTM, reinforcement learning, DC power system, fault diagnosis
Citation: Yang Y, Tu F, Huang S, Tu Y and Liu T (2023) Research on CNN-LSTM DC power system fault diagnosis and differential protection strategy based on reinforcement learning. Front. Energy Res. 11:1258549. doi: 10.3389/fenrg.2023.1258549
Received: 14 July 2023; Accepted: 27 July 2023;
Published: 09 August 2023.
Edited by:
Praveen Kumar Donta, Vienna University of Technology, AustriaReviewed by:
Murali Krishna V. B., National Institute of Technology, Andhra Pradesh, IndiaEbrahim Elsayed, Mansoura University, Egypt
Copyright © 2023 Yang, Tu, Huang, Tu and Liu. This is an open-access article distributed under the terms of the Creative Commons Attribution License (CC BY). The use, distribution or reproduction in other forums is permitted, provided the original author(s) and the copyright owner(s) are credited and that the original publication in this journal is cited, in accordance with accepted academic practice. No use, distribution or reproduction is permitted which does not comply with these terms.
*Correspondence: Yun Yang, eWFuZ3l1bjE5OTA5QDE2My5jb20=