 Feng Zhou
 Jicheng Yu
- China Electric Power Research Institute, Wuhan, China
Faced with the pressure of energy conservation and emission reduction, the power industry is urgently requires low-carbon transformation. The carbon flow calculation theory redistributes the actual carbon generated by the power plant to the branch and loads customers with the power flow. This paper first introduces the theory of carbon flow calculation and the carbon metrics corresponding to the electricity metrics. Second, a time-synchronous technology is introduced for the carbon flow calculation of transmission, transformation, and distribution networks, and a time-synchronous-based carbon metering system is conceived. The impact of time deviation on carbon metering is elucidated through simulation experiments of IEEE14 standard nodes, and finally, relevant suggestions are made for future research ideas and technical routes.
1 Introduction
Given the energy crisis and global warming, various countries around the world are making efforts to save energy and reduce emissions in various ways. Coal-fired power generation is the main source of CO2 generation in the power industry, so renewable new energy generation represented by wind power and photovoltaic power generation is currently entering the power system in high proportion. Although new energy generation can significantly reduce the production of CO2, this type of power generation is unstable. Therefore, the power industry cannot be zero carbon and coal-fired power generation cannot be replaced entirely. Carbon measurement and carbon trading are currently the promising management approaches used to achieve carbon reduction. Drawing on the cyclic transfer of carbon elements in ecology (Richey et al., 1978), some scholars have now proposed the concept and theory of carbon emission streams for the power industry (Xu et al., 2019) and (Sun et al., 2022).
Carbon emission is calculated by using the energy consumption and statistical emission factors of different fossil fuels, which is mainly attributed to the source side of direct emission, which is calculated based on statistically empiric methods. However, these carbon emission accounting methods have insufficient theoretical basis with irrationality and unfairness, and it is difficult to promote multi-party carbon reduction while only the direct carbon emission source is responsible (Hu et al., 2022). An increasing number of researchers are becoming aware of the need to look at carbon emissions from the perspective of the whole system, taking into account the actual characteristics of the power system, and have proposed many corresponding methods to deal with the problem. In order to account for carbon emissions from the consumption-based perspective, Zhou et al. (2012) and Kang et al. (2012) proposed the carbon emission theory to distribute the responsibility of carbon emission to the load side by tracking the whole process from the source to the load. Zhou et al. (2012)define some basic concepts of carbon emission flow in power networks. An analytical model for carbon emission flow is proposed in Kang et al. (2015) to quantify the carbon emission accompanying the power delivery process. The model of the carbon emission flow can take into account the operational characteristics and the network features of the power system and elaborately characterize the relationship between power delivery and carbon emission flow. A calculation model for the carbon emission flow is also proposed in the article. A directed graph-based method for tracing the carbon flow is proposed in Sun et al. (2016). Yan et al. (2021) put forward a real-time carbon flow algorithm of the electrical power system based on the network power decomposition and solve the limitations of the current method and problems given as follows: the hidden carbon flow was unevenly allocated and the carbon reduction contribution of the new energy units cannot be quantified. A data-driven approach conducted with the Bayesian interference regression is proposed by Wang et al. (2021) to carry out the carbon emission flow model to cope with the drawbacks of the conventional emission calculation. Qin et al. (2022) present a deep reinforcement learning-based multi-objective optimal carbon emission flow solving method that handles the generator dispatching scheme by utilizing the current power system state parameters as known quantities. Cheng et al. (2018b), Wei et al. (2022), Cheng et al. (2018a), and Huang et al. (2022) propose different analytical models and calculation methods for carbon emission flow in multiple energy systems or integrated energy stations. Zhang et al. (2021) and Yang et al. (2023) establish the carbon emission analysis model of the distribution systems with prosumers which combined with the perfect system power flow (PF) theory and considered the network loss and prosumers.
Although the theory of carbon flow measurement has been established and widely promoted in recent years, the assurance of carbon measurement accuracy is still topic reqiring urgent study. In this paper, the influence of time deviation on the error of carbon flow measurement is studied. A satellite synchronization method to add time labels to the carbon flow calculation data is proposed to make the carbon flow allocation in transmission and distribution and the carbon flow measurement on the load side more accurate. In this study, we use the IEEE-14 standard system to realize the carbon flow distribution and measurement of power transmission, transformation, and distribution. First, based on the carbon flow measurement theory, a single-carbon flow calculation is performed. Second, the load fluctuation data of a typical day at 24 points per day are input into the IEEE-14 standard system for continuous carbon flow simulation calculation. Then, based on the 24-point load data, data sets of 48 points per day and 96 points per day are generated for calculation again. Finally, the deviation analysis of the loaded carbon flow under three different sets of conditions is carried out.
2 Carbon flow theory
2.1 Basic theory of the transformation of electricity to carbon
The basic principle of the transformation of electricity to carbon is carbon flow theory (CFT). In addition, the main idea is to quantify the state of carbon emissions in a power system based on the distribution of PF. A power system carbon flow is a virtual network flow that exists on the PF and is used to characterize the carbon emissions in the power system that maintains the PF on any branch. A power system carbon flow is equivalent to labeling each PF with carbon emission. The carbon flow in the power system originates in the power plant and eventually enters the load nodes via the power grid. Similar to electricity generation, carbon flow is generated by generators. It is consumed by electricity consumers through the carbon flow.
The CFT is based on the PF tracking theory. There are some differences between carbon emission flow analysis and PF analysis. On one hand, the initial conditions for the calculation of the carbon emission parameters of power systems are derived from the results of PF calculation. Therefore, all the factors affecting the distribution of system PF will affect the distribution of carbon emission flow, such as the topology of the power system forms the same basic constraints in carbon emission flow analysis as in PF calculation; on the other hand, carbon emission flow is also related to the carbon emission characteristics of the power plant with unique boundary conditions. In addition, the carbon emission flow is mainly affected by the distribution of the active power since the energy consumption is mainly related to the active power. Although the reactive power affects the active power loss in the grid, which has an impact on the distribution of system carbon emissions, the carbon emission flow can be approximated to be affected by the active power of the system only when the net loss is neglected.
2.2 Concepts of electricity-to-carbon transformation in power systems
Calculations of electricity-to-carbon transformation are used to measure the production, consumption, and transmission of carbon in the power system. Some vital basic concepts of electricity transforming to carbon are introduced as follows: carbon flow, carbon flow rate, and carbon flow density (CFD). CFD describes the relationship between carbon flow and active power in power systems. CFD is divided into two categories according to the branch and node, namely, branch carbon flow density and node carbon potential, respectively.
2.2.1 Carbon flow
Carbon flow is a basic concept in CFT. Carbon flow characterizes the magnitude of carbon flow in a branch or load. The carbon flow is defined as the cumulative amount of carbon emissions in a given branch or load in a certain time range. The unit of carbon flow is the same as that of carbon emission. Currently, the international unit of carbon emissions is generally expressed in tCO2 or kgCO2, which means that the mass of carbon dioxide is used as the basis for calculating the mass of greenhouse gases in the gas being emitted.
2.2.2 Carbon flow rate
The carbon flow rate (CFR) is defined as the carbon flow that passes along with the PF per unit of time, at a value equal to the derivative of the CFR with respect to time, as shown in (1).
2.2.3 Branch carbon flow density
The carbon emission flow of the power system is dependent on the PF. Therefore, it is necessary to combine the carbon emission flow with the PF. Furthermore, carbon emission in the power system is mainly related to active power. To characterize the combination of both, the ratio of the CFR of any branch of the power system to the active power is defined as branch carbon flow density (BCFD).
where ρ represents the ratio of the CFR of any branch to the active PF in the power system.
The unit of carbon flow density is kgCO2/(kWh). In the generator nodes, the BCFD is equal to the carbon emission intensity of the generator. In the load nodes, the BCFD is equal to the carbon emission value of the generation side caused by the consumption of unit power transmitted by the branch line.
2.2.4 Node carbon potential
The CFT defines the physical quantity that describes the carbon emission intensity of nodes by carbon emission flow, named node carbon potential (NCP). ent is used to describe the NCP of node n at time t.
where the unit of NCP is kgCO2/(kWh), the same as that of BCFD. NCP equals the weighted average of the BCFD ρit of all branches flowing into node n with respect to the active power Pit.
The physical meaning of the NCP is the value of carbon emissions caused by the consumption of a unit of electricity at that node. For a power plant node, its NCP is equal to the real-time generation carbon emission intensity of the power plant.
2.3 Node carbon potential vector
The primary goal of carbon emission flow calculation in a power system is to calculate the carbon potential of all nodes. To calculate the node carbon potential vector (NCPV), three matrices should be constructed first which are the node active flux matrix (PN), the branch PF distribution matrix (PB), and the generator injection distribution matrix (PG). In addition, they are constructed from the PF calculation results. According to (4), the NCP of the power system can be calculated as follows:
• PN is an N-order diagonal matrix that describes the contribution of the generator set and other nodes to the NCP of a node in the system.
• PB is used to describe the active power flow distribution of the power system. This matrix contains the topology structure information of the power network and the steady-state active power flow distribution information.
• PG is a K × N matrix. It is defined to describe the connection between all generating sets and the power system. In addition, it represents the active power injected into the system by the unit.
• EG is a vector representing the carbon potential of the system generator. As a known condition for the calculation of the carbon emission flow, subsequent calculations are carried out.
3 Time-synchronized measurement carbon system
Figure 1 shows a transmission and distribution carbon metering system based on time synchronization. The metrics of the PF calculation are time-stamped by configuring satellite synchronization signals to the power measurement devices of the transmission and distribution. After the carbon flow is calculated, it is measured and recorded by the time marker alignment. This allows for more accurate carbon flow calculations in order to provide credibility for the carbon trading market and other subsequent expansion applications.
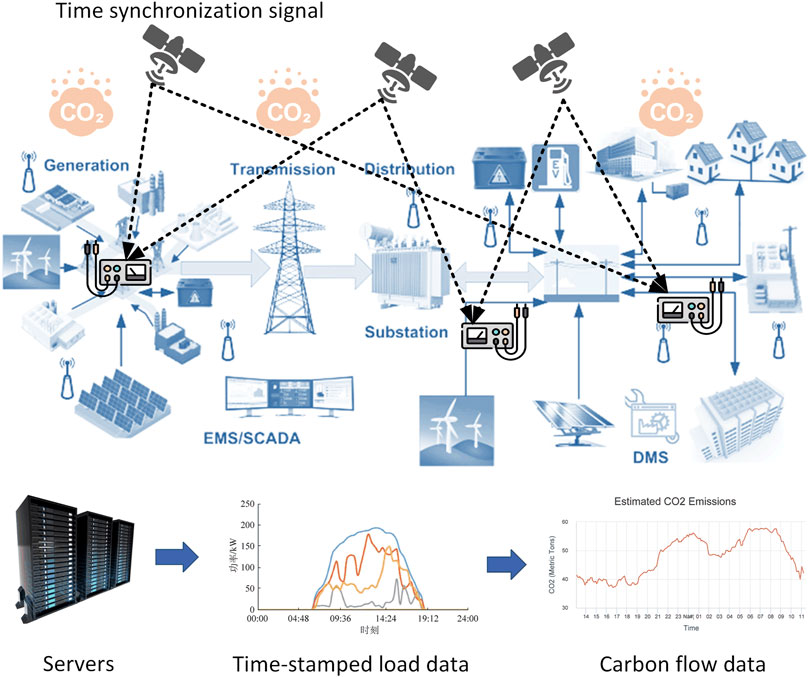
FIGURE 1. Carbon metering system based on the time synchronization technique. The calculated data in the carbon metering system are time-stamped by satellite synchronization and stored to the server. The error impact of time deviation on carbon measurement is corrected by time alignment when the carbon measurement verification work is performed.
Considering the time factor, the equation of carbon measurement is rewritten as (5) according to the CFT.
4 Carbon flow calculation framework for power systems
The time deviation calculation framework of the carbon emission flow in the power system based on the matrix analysis method is shown in Figure 2, and the carbon flow calculation times k and typical load matrix P within a certain time are initialized first. We then perform the following four steps for carbon flow calculation. Error analysis was carried out after the aforementioned calculation.
1. The distribution of the active power flow at time i is calculated, and the matrices PN, PB, and PG are established;
2. It is determined whether magnetic flux matrix PN satisfies the following conditions:
3. The carbon potential EN of all nodes in the power system is calculated first. Then, the distribution matrix of the branch carbon flow rate and load carbon flow rate vector is obtained based on the results.
4. The program judges whether the current cycle count i is equal to the preset count k. If not, we proceed to step 1. Otherwise, the calculation is finished.

FIGURE 2. Flow chart of the continuous carbon flow calculation incorporating time factor.
5 Results and discussions
The IEEE-14 node standard model is used to validate the time-synchronized carbon metering scheme proposed in this paper. Without considering network losses, the DC PF calculation method is used for solving. The previously mentioned simplified considerations are mainly used to illustrate the calculation results of the time deviation affecting carbon metering in transmission and distribution networks.
5.1 Carbon flow calculation simulation in the IEEE-14 standard system
As shown in Figure 3, it is assumed that G1 is a thermal power generator with high carbon potential, G2 and G4 are gas-fired generators with relatively low carbon potential, and G3 and G5 are new energy power plants (wind power or hydropower), where the generators do not produce CO2 and have zero-carbon potential. We initialize the carbon potential vector
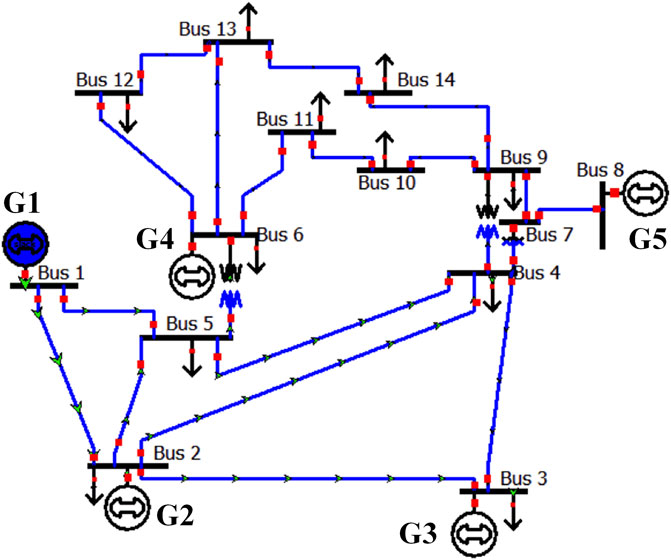
FIGURE 3. IEEE-14 standard system.
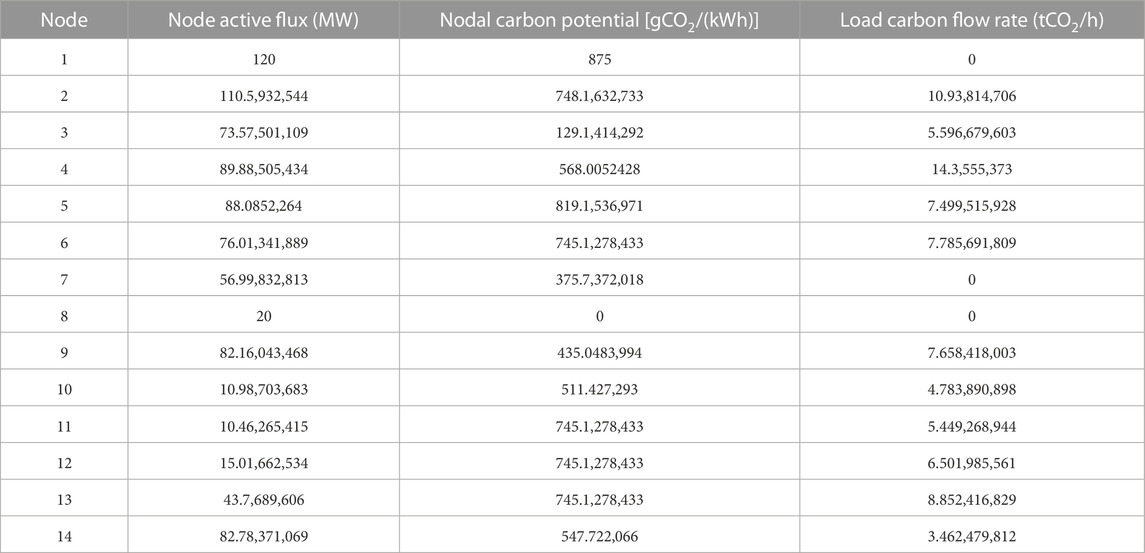
TABLE 1. Standard system carbon emission flow calculation results.
5.2 Carbon metering at different time scales
Figure 4 shows the load carbon flow rate of 11 loads in the IEEE-14 standard system. The CFR is different for each load, and we can see from the graph that the third load user produces CO2 at a significantly higher rate than the other load users due to the difference in electricity consumption. It is evident that the trend of the CFR for each load is almost the same as the trend of the load. This indicates that carbon emissions are related to the intensity of electricity consumption. The carbon emission stream reflects the rate of CO2 production by customers using electricity. In order to calculate the amount of CO2 produced by a load user in a fixed period of time, the CFR needs to be integrated for that period of time. Therefore, for more accurate carbon metering, the time factor must be taken into account.
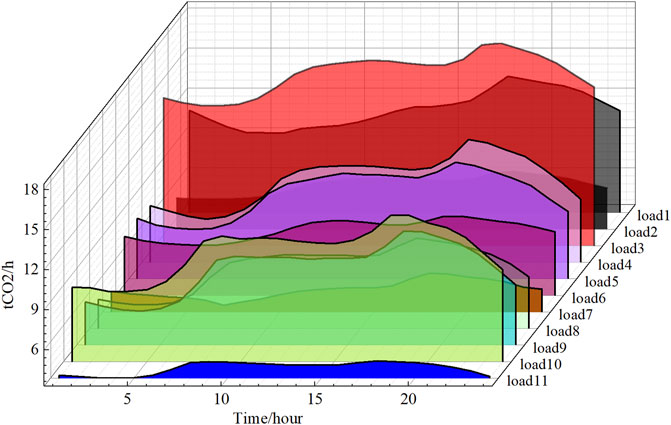
FIGURE 4. Load carbon flow rate visualization results for IEEE-14 standard systems.
In practical engineering applications, the integral approach to carbon measurement is replaced by cumulative sums. Suppose that the calculation of the ith carbon flow calculation is executed at ti time and repeated at the next ti+1 time, then the CO2 generated by the load user at that time is the product of the CFR at time i and the step size at that time CFR × (ti+1 − ti). Therefore, we investigated the effect of different time-scale carbon flow calculations on load-side CO2 metering. The time scales were set to three groups, 24 points/day, 48 points/day, and 96 points/day for a typical day. Based on the 24 points/day data, two additional control groups were generated by interpolation to ensure consistent load trends. In addition, a random fluctuation of ±0.5% of the load was added to the control group data generation to represent the real random fluctuation of the load.
The CO2 measurement results for a typical day are calculated for each load user, and the CO2 measurement results and corresponding measurement errors are shown for the 48 points/day and 96 points/day settings for the corresponding load users. As shown in Table 2, the majority of load users have larger CO2 metering values with more points calculated than in the 24 points/day case, which is due to the finer time scale and the fact that the metering result values are closer to the integral value performance. Furthermore, the CO2 measurement results for a typical day are calculated for each load user, and the CO2 measurement results and corresponding measurement errors are shown for the 48 points/day and 96 points/day settings for the corresponding load users. From Table 2, it can be seen that the majority of load users have larger CO2 metering values with more points than in the 24 points/day case because the time scale is finer and the metering result values are closer to the integral values. However, we also note that the CO2 metering results for some load users are small in the control group, such as the first load user and the fourth load user. During the execution of the simulation experiment, the loads added random fluctuations, leading to such unpredictable results. The occurrence of this phenomenon suggests that it is necessary to add time synchronization to the carbon metering system for synchronous alignment of the time scale. Finally, we also found that the CO2 metering values generated by all load users in the IEEE-14 standard system on a typical day under the simulation arithmetic of this experiment are 0.403 and 0.32 tons of CO2, which are larger than the results of the baseline case for the 96-point/day case and the 48-point/day case, respectively. If time synchronization is ignored, the cumulative measurement errors over time will lead to questionable accuracy and fairness of carbon metering.
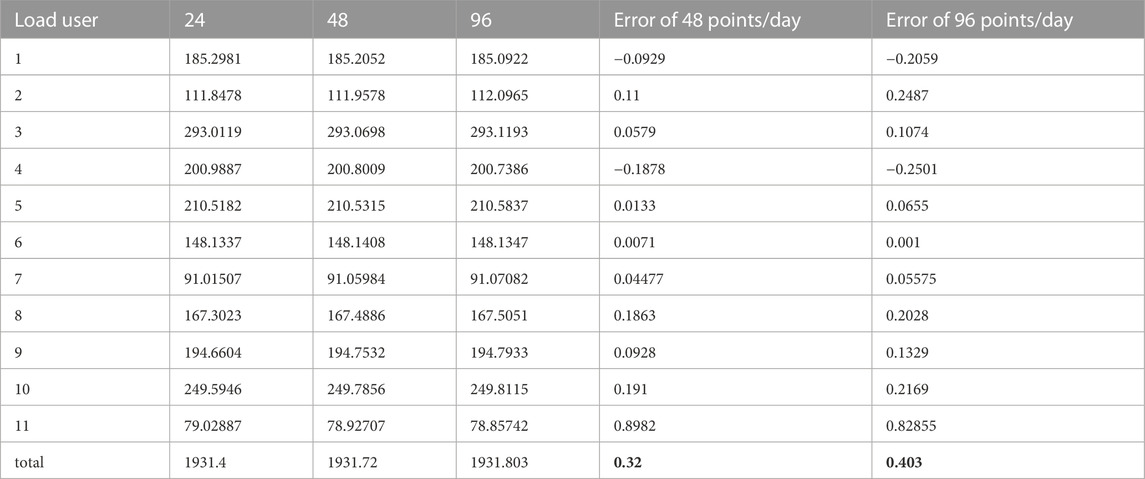
TABLE 2. Results of carbon flow data by load of the IEEE-14 standard system under different time granularity values (±0.5% fluctuation).
5.3 Error analysis of load fluctuation at the 96 points/day time scale
Based on the analysis in subsection 5.2, we concluded that the carbon measurement accuracy at high sampling rates is closest to reality. This sub-section explores the impact of data bias at a time granularity of 96 points/day. The results of the load carbon flow are shown in Table 3, and the absolute errors of the error data and the original data are shown in Table 4. The data units in Table 3 and Table 4 are tCO2.
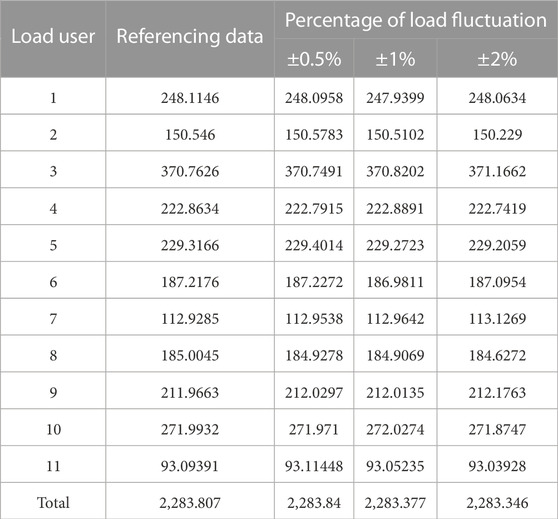
TABLE 3. Carbon metering experiments with different load fluctuation percentages.

TABLE 4. Absolute error in carbon metering for different load fluctuation percentages.
As shown in Table 4, the size of the random fluctuation of the data causes the absolute error of the total carbon emission of the system in a single day to be less than 0.5tCO2. However, as the fluctuation increases, the absolute error also increases. For a single load node, the absolute error caused at ±2% data fluctuation is an order of magnitude higher in the total carbon flow for more than 70% of the loads compared to the results for ±1% as well as ±0.5%. However, the carbon flow results for loads caused by ±0.5% and ±1% fluctuations are not significantly different in order of magnitude. In addition, there is even an absolute error in the total load carbon flow caused by ±0.5% data deviation, which is greater than the absolute error in the total load carbon flow caused by ±1% fluctuation.
6 Conclusion
This paper introduces the time synchronization technique to power system carbon flow calculations and provides relevant work for more accurate carbon flow measurement. Carbon flow in transmission, transformation, and distribution accompanies the PF calculation. Considering that the source follows the load movement, the deviation of the load monitoring can lead to an error in carbon flow measurement. The necessity of introducing time-synchronous technology into carbon flow metering is illustrated by combining the arithmetic example of the IEEE14 node. The findings of this study are summarized in the following three points:
1. There are measurement errors in carbon measurement at different time granularities, and the finer the time granularity, the closer the carbon measurement results are to the true value.
2. In the case of the high sampling rate of the carbon metering system, the magnitude of load fluctuation also has an impact on the carbon metering error.
3. Time synchronization technology should be included in the technical scope of carbon metering for transmission, transformation, and distribution grids to improve the credibility of carbon verification.
Future work can focus on data-driven carbon flow prediction based on data to further improve the stability of this system’s work.
Data availability statement
The raw data supporting the conclusions of this article will be made available by the authors, without undue reservation.
Author contributions
FZ: conceptualization, data curation, and writing-original draft. JY: conceptualization, funding acquisition, supervision, writing-review and editing, and writing-original draft. XY: formal analysis, project administration, validation, and writing-review and editing. CY: resources, visualization, and writing-review and editing. SL: investigation, methodology, software, and writing-review and editing.
Funding
The author(s) declare that financial support was received for the research, authorship, and/or publication of this article. This work was funded by the State Grid Corporation of China Science and Technology Project (Grant number: 5400-202255274A-2-0-XG). The funder was not involved in the study design, collection, analysis, interpretation of data, the writing of this article, or the decision to submit it for publication.
Conflict of interest
Authors FZ, JY, XY, CY, and SL were employed by China Electric Power Research Institute.
Publisher’s note
All claims expressed in this article are solely those of the authors and do not necessarily represent those of their affiliated organizations, or those of the publisher, the editors, and the reviewers. Any product that may be evaluated in this article, or claim that may be made by its manufacturer, is not guaranteed or endorsed by the publisher.
References
Cheng, Y., Zhang, N., and Kang, C. (2018a). Carbon emission flow: from electricity network to multiple energy systems. Glob. Energy Interconnect. 1, 500–506. doi:10.14171/j.2096-5117.gei.2018.04.010
Cheng, Y., Zhang, N., Wang, Y., Yang, J., Kang, C., and Xia, Q. (2018b). Modeling carbon emission flow in multiple energy systems. IEEE Trans. Smart Grid 10, 3562–3574. doi:10.1109/tsg.2018.2830775
Hu, R., Ma, N., Huang, Z., Li, B., and Ou, M. (2022). “Carbon emission flow analysis of an integrated energy system using cloudpss simstudio,” in 2022 7th International Conference on Power and Renewable Energy (ICPRE), Shanghai, China, 23-26 Sept. 2022 (IEEE), 1200–1205. doi:10.1109/ICPRE55555.2022.9960590
Huang, J., Duan, W., Zhou, Q., and Zeng, H. (2022). Methodology for carbon emission flow calculation of integrated energy systems. Energy Rep. 8, 1090–1097. doi:10.1016/j.egyr.2022.05.263
Kang, C., Zhou, T., Chen, Q., Wang, J., Sun, Y., Xia, Q., et al. (2015). Carbon emission flow from generation to demand: A network-based model. IEEE Trans. Smart Grid 6, 2386–2394. doi:10.1109/tsg.2015.2388695
Kang, C., Zhou, T., Chen, Q., Xu, Q., Xia, Q., and Ji, Z. (2012). Carbon emission flow in networks. Sci. Rep. 2, 479–487. doi:10.1038/srep00479
Qin, P., Ye, J., Hu, Q., Song, P., and Kang, P. (2022). Deep reinforcement learning based power system optimal carbon emission flow. Front. Energy Res. 10, 1017128. doi:10.3389/fenrg.2022.1017128
Richey, J. E., Wissmar, R. C., Devol, A. H., Likens, G. E., Eaton, J. S., Wetzel, R. G., et al. (1978). Carbon flow in four lake ecosystems: a structural approach. Science 202, 1183–1186. doi:10.1126/science.202.4373.1183
Sun, K., Qiu, W., Dong, Y., Zhang, C., Yin, H., Yao, W., et al. (2022). Wams-based hvdc damping control for cyber attack defense. IEEE Trans. Power Syst. 38, 1. doi:10.1109/TPWRS.2022.3168078
Sun, T., Feng, D., Ding, T., Chen, L., and You, S. (2016). “Directed graph based carbon flow tracing for demand side carbon obligation allocation,” in 2016 IEEE Power and Energy Society General Meeting (PESGM), Boston, MA, USA, 17-21 July 2016 (IEEE), 1–5. doi:10.1109/PESGM.2016.7741580
Wang, Y., Qiu, J., and Tao, Y. (2021). Optimal power scheduling using data-driven carbon emission flow modelling for carbon intensity control. IEEE Trans. Power Syst. 37, 2894–2905. doi:10.1109/tpwrs.2021.3126701
Wei, X., Sun, Y., Zhou, B., Zhang, X., Wang, G., and Qiu, J. (2022). Carbon emission flow oriented multitasking multi-objective optimization of electricity-hydrogen integrated energy system. IET Renew. Power Gener. 16, 1474–1489. doi:10.1049/rpg2.12402
Xu, Y., Ding, T., Qu, M., Wen, Y., and Ning, Y. (2019). “Low-carbon power system economic dispatch considering renewable energy accommodation,” in 8th Renewable Power Generation Conference (RPG 2019), Shanghai, China, 24-25 Oct. 2019 (IEEE), 1–8. doi:10.1049/cp.2019.0464
Yan, Z., Zhou, T., Zhang, H., Dai, S., Li, X., and Wang, C. (2021). “Real-time carbon flow algorithm of electrical power systems based on network power decomposition,” in 2021 IEEE Conference on Telecommunications, Optics and Computer Science (TOCS), Shenyang, China, 10-11 Dec. 2021 (IEEE), 467–470. doi:10.1109/TOCS53301.2021.9688754
Yang, C., Liu, J., Liao, H., Liang, G., and Zhao, J. (2023). An improved carbon emission flow method for the power grid with prosumers. Energy Rep. 9, 114–121. doi:10.1016/j.egyr.2022.11.165
Zhang, W., Gu, Y., Zhang, Y., Zhang, J., Luo, F., and Yang, X. (2021). “A carbon emission flow analysis model and method of active distribution system based on power flow tracing,” in 2021 IEEE 5th Conference on Energy Internet and Energy System Integration (EI2), Taiyuan, China, 22-24 Oct. 2021 (IEEE), 1197–1202. doi:10.1109/EI252483.2021.9712910
Keywords: carbon flow, carbon metering, power flow, time deviation, time-synchronous
Citation: Zhou F, Yu J, Yin X, Yue C and Liang S (2023) Time-synchronized carbon flow metering scheme for electric power transmission, transformation, and distribution networks. Front. Energy Res. 11:1257354. doi: 10.3389/fenrg.2023.1257354
Received: 12 July 2023; Accepted: 03 August 2023;
Published: 29 August 2023.
Edited by:
Yuqing Dong, The University of Tennessee, United StatesReviewed by:
Jay Zarnikau, The University of Texas at Austin, United StatesHe Yin, The University of Tennessee, United States
Qiu Tang, Hunan University, China
Copyright © 2023 Zhou, Yu, Yin, Yue and Liang. This is an open-access article distributed under the terms of the Creative Commons Attribution License (CC BY). The use, distribution or reproduction in other forums is permitted, provided the original author(s) and the copyright owner(s) are credited and that the original publication in this journal is cited, in accordance with accepted academic practice. No use, distribution or reproduction is permitted which does not comply with these terms.
*Correspondence: Jicheng Yu, cGhvZW5peHlqY0AxMjYuY29t