 Changbin Hu1
 Xiaoqin Cai
95% of researchers rate our articles as excellent or good
Learn more about the work of our research integrity team to safeguard the quality of each article we publish.
Find out more
ORIGINAL RESEARCH article
Front. Energy Res. , 31 October 2023
Sec. Sustainable Energy Systems
Volume 11 - 2023 | https://doi.org/10.3389/fenrg.2023.1252414
With the increasing development of low-carbon economy, the coupling degree of electric thermal gas system is deepening day by day. The operation mode of traditional energy supply system using electric heating separation mode and hierarchical dispatching of transmission and distribution network has been difficult to mine the whole network resources and realize the global optimal operation strategy. In order to increase the consumption of new energy and solve the multi-energy current coupling system, this paper puts forward a layered optimization operation strategy for the electric-thermal multi-energy current coupling system with Concentrated solar power (CSP) plant and carbon trading mechanism. The upper layer is the solution layer of multi-energy coupled flow system. In order to solve the matrix values of complex multi-energy coupled flow system, Newton's method, improved Newton’s method and improved second-order cone collaborative solution methods are proposed. The lower layer is the multi-energy flow optimization layer. According to the system solution values obtained from the upper layer, the lower layer optimization aims at economic minimization of the total user cost. The carbon trading mechanism model is introduced to optimize the time sequence output of the electric thermal unit under different scenarios, and the mixed integer linear programming method is adopted. Finally, the validity is verified by a simulation example. The results show that this method can optimize the operation of the system, improve the accuracy and rapidity of the system, and “carbon trading and CSP power station” method can better constrain the carbon emission of the multi-energy flow coupling system, reduce the energy pressure of the device, and improve the economy of the total cost of the user.If this method is adopted, it can be used for reference in the future energy management and system decision of multi-energy flow coupling system.
With the development of the economy and society, the multi-stream coupling system is gradually gaining importance in China, and some scholars have put forward the concepts of regional energy internet, urban multi-stream systems, and smart grid. The energy consumption ratio of buildings has gradually increased in recent years, and the 14th Five-Year Plan emphasizes a modern energy system that is “clean, low-carbon, safe and efficient,” accelerates energy transformation, strengthens the combination of “wind, light, water, fire and storage” to enhance the utilization rate of energy, solves the problem of renewable energy consumption difficulties, and reduces energy consumption and energy efficiency. This addresses the problem of renewable energy consumption difficulties and reduces energy consumption and energy costs (Jiang et al., 2021). An important part of the energy structure of the society in recent years, the multi-stream coupling system mainly consists of the energy supply side, equipment coupling side, user load side, and energy supply line, combining various clean energy sources such as solar energy, geothermal energy, natural gas, and hydrogen energy; realizing the integrated system of the source network, load, and storage with the connection of the energy storage system and user side; and distributing the different kinds of energy contained in it for supply and demand to achieve important requirements such as rationalization, energy use, and low carbon (Hu et al., 2019; Wang et al., 2021).
The modeling of coupled multi-energy flow systems has received extensive attention from scholars as a research basis. Qaisrani et al. (2021) evaluated the development potential of photovoltaic power generation and pointed out that photovoltaic power generation has a significant contribution in reducing carbon emissions and environmental degradation. As a new type of power generation, the photovoltaic thermal concentrated solar power (CSP) plant can store photothermal energy and realize the complementary effect between the energy flows (Du et al., 2016; Liu et al., 2016). The application of a CSP power plant in the RIES is not only for energy supply but also needs to couple its operation characteristics with multiple energy supply devices to improve the rate of new energy consumption (Yun et al., 2020; Cui et al., 2023; Rahbari et al., 2023). To improve the effectiveness of CSP power plants in the regional integrated energy system (RIES), the CSP power plant model from Jin et al. (2016) is introduced, and scenarios are analyzed.
In the context of the “double carbon” goal, the use of coal is gradually reduced to reduce the high carbon emissions of the system, and the relatively clean natural gas and electricity are used as energy supply to meet the demand of the load, which can make full use of the carbon trading mechanism. Fang et al. (2018) explores the optimal dispatch by embedding carbon emissions into the electrical thermal model to determine the energy pricing problem to achieve green emission reduction. TSAI and YEN (2010); Wu et al. (2011) carries out carbon emission reduction with methods such as carbon emission penalty single target or carbon emission constraint, but there is a single target. The method is too easy, and the high cost of power generation can hardly enhance the positive effect. To address the aforementioned problems, Qu et al. (2018) mentions that carbon emissions from energy supply equipment are fully considered in the RIES to constrain carbon emissions and enhance environmental friendliness. Therefore, this paper establishes a comprehensive economic model of carbon trading cost to fit the complexity of total carbon emission modeling and the comprehensiveness of calculation for the application of the multi-stream coupled system and to fit the optimal operation of the multi-stream coupled system in this system.
In multi-energy flow tide calculation, the commonly used algorithms include the forward–back substitution method (Li et al., 2022), the Zbus Gaussian method (Ai et al., 2015), and the fast decoupling method (Hu et al., 2017), but the Newton–Raphson method is still the mainstream method for calculating tides (Li et al., 2018). Sun et al. (2020) introduced the electro–thermal coupling theory into the traction network tidal current calculation on the traditional Newton–Raphson method, which laid the foundation for further research on tidal current calculation under the complex traction network model considering the influence of electro–thermal coupling. Zhao et al. (2022) used the Newton–Raphson method and introduced the electric–water hybrid model under the integrated energy system architecture to verify the effectiveness of the electric–water hybrid tidal current calculation method. Chen (2021) explored the multi-energy flow calculation of integrated energy systems and the optimal tide problem based on the joint water–heat model of thermal networks, which provided an effective direction for economic analysis and steady-state operation. Liu et al. (2023) considers the use of second-order cone-convex optimization and the Big M approach for the optimization of economy and flexibility in the perspective of virtual power plants. In Zhou et al. (2022), second-order cone relaxation, linearization of product variables, and segmental linearization are applied to solve the system operation capacity to transform the electricity–gas dual-coupled integrated energy system into a mixed-integer second-order cone planning, which reduces the operation cost. In Li et al. (2021), CSP power plants are introduced and dispatched together with thermal power units to solve the problem of unreasonable dispatch of various power sources and difficulties in scenery consumption, and the results show the feasibility of this scheme. However, most of the relevant literature uses a single optimization approach for energy flow calculation of a single system and do not consider the multi-optimization approach coupling relationship of three or more systems with multi-energy flow coupling.
In this paper, carbon trading mechanism characteristics are introduced based on existing literature. First, a comprehensive multi-energy flow coupling system of the energy system including the CSP power plant is constructed. Second, when considering the influence of new energy output and different energy flow calculation methods of multi-energy flow coupling system hierarchical cooperative optimization operation, the multi-energy flow system operation scenarios are summarized and solved based on Newton’s method, improved Newton’s method, improved second-order cone solving method, and hybrid planning multi-energy flow coupling system hierarchical cooperative optimization operation. Finally, five simulation scenarios are set up to verify the low-carbon, economics, and feasibility of the mentioned model and the optimization operation method through the multi-energy-flow system example consisting of a 9-node regional electric power system, a 6-node regional natural gas system, and an 8-node regional thermal system. Compared with the traditional electric–thermal separation and hierarchical dispatch of the transmission and distribution networks, the introduction of the “carbon trading and CSP power plant” method to optimize the timing of the electric–thermal units in different scenarios has the following specific advantages:
(1) Using part of the electricity, heat, gas, and other loads as flexible loads can significantly reduce the load peak and valley differences, play the effect of “peak shaving and valley filling,” reduce the energy pressure on the device, optimize the system operation, and improve the economy of the system.
(2) Effectively promote new energy consumption, reduce the problem of grid power purchase for the system, improve the system economy, and enhance the stability of the system energy supply.
(3) Better constrain the carbon emission of the multi-energy flow coupling system and improve its economic and environmental benefits. Based on the demand-side dynamic load model, increasing the system’s ability to consume new energy and improving the energy use in the valley power hours can alleviate the pressure on the energy supply equipment during the peak energy use period, smoothen the electric and thermoelectric load curves under different moments, reduce the system’s operating costs and energy waste, and cause the energy to be more fully utilized.
The traditional RIES (regional integrated energy system) includes photovoltaic (PV), wind power (WP), P2G equipment (power to gas, PTG), gas turbine (GT), gas-fired boiler (GB), waste heat boiler (WH), and heat storage system (HS). To improve the energy utilization ratio, a CSP (concentrated solar power) power station has been added based on a traditional IES to compose the energy supply system, multi-energy current equipment coupling system, and load system. Figure 1 shows the specific energy flow direction and equipment coupling status relationship.
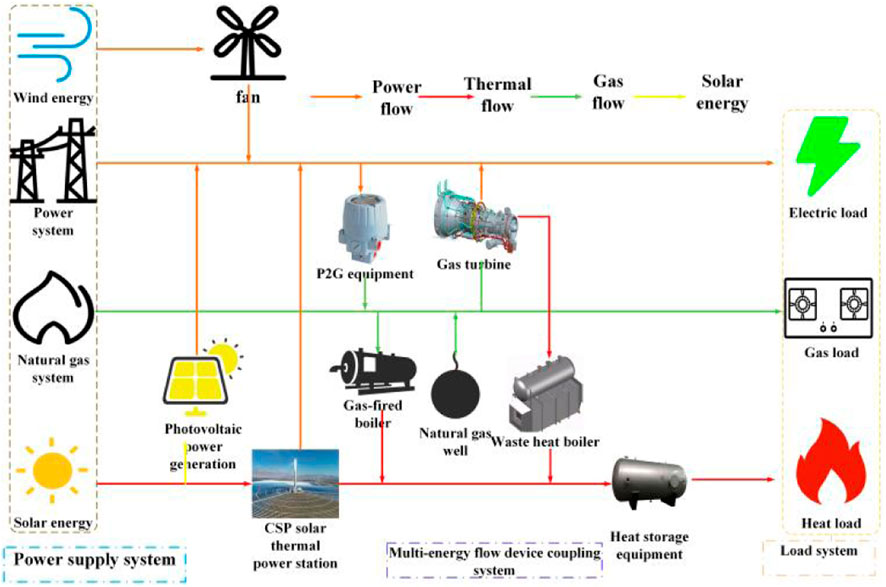
FIGURE 1. Electrical thermal multi-energy flow system topology.
The relation matrix of the multi-energy flow system can be obtained from Figure 1. The relation between input energy flow
where Cij is the constant matrix of the system coupling relation and
The system coupling relationship constant matrix
where
The input energy flow matrix
where
The system energy consumption coefficient matrix
where
The carbon trading policy is in the stage of comprehensive development in China. At present, the domestic power sector mainly adopts the way of free allocation for initial carbon emission allocation. This paper considers that the initial allocation of carbon emission rights in the multi-energy current coupling system mainly includes power grid purchase, gas turbine, gas boiler, and P2G. The specific representation is as follows:
where
The hot water from the heating system is transported to the user side through the water supply pipeline, and after heat exchange, it is transported back to the heat source side through the return pipeline for circulation heating. Hot water in the transmission process will lead to heat loss due to the long pipeline, and part of the heat will remain in the pipeline. The hot water will be in the transmission process, and the difference in temperature between the surrounding environment will cause heat exchange, resulting in a drop in temperature. The basic network equation of the heating network is constructed based on the flow characteristics of the thermal energy system and the principle of heat transfer. Generally, a thermal energy system is composed of a heating network and a return heat network, which transmits heat from the source to the load in the form of water or gas.
Flow balance equation:
where
Since there is friction in the pipeline, it leads to a pressure difference in it, which in turn leads to a pipe pressure drop, and the relationship between pipe flow and pipe pressure drop is as follows:
where Kp is the heating pipe resistance coefficient.
From Kirchhoff’s law, the equilibrium equation of pipe pressure drop can be obtained as
where
To ensure the accuracy of the tide of the heat pipe network, it is necessary to ensure the feasibility of the heating temperature as well as the heating power, so it is necessary to satisfy the nodal k temperature difference calculation model of the water supply pipeline:
The inlet and outlet heat loads of the heating system at node k are
The thermal power of node k is obtained by subtracting Equations 16, 17:
A multi-node flow-in and flow-out pipeline fluid temperature mixing model is given as follows:
where Tin and Tout are mixed before and after the node of the water temperature;
The natural gas pipeline uses the nonlinear model Weymouth equation to describe the relationship between the natural gas nodal pressure and the pipeline tide:
where
Natural gas wells are an important part of the natural gas system, which are underground or subsea extraction facilities for producing natural gas. In the overall system topology, the natural gas well is the starting point of the gas source and sends the extracted gas to the customer side through the transmission pipeline. The output of a natural gas well directly affects the supply capacity and stability of the entire natural gas system.
In the formula,
The optimal operation model of the coupled electrical–thermal multi-energy flow system implements the photovoltaic power plant and carbon trading mechanism to minimize the total cost. The objective function considers the cost of electricity purchase and sale
where
The equipment imbalance constraint mainly contains the CSP power plant operation constraint, P2G power constraint, heat storage device charging and discharging constraints, relevant start–stop marker bits, gas boiler constraint, and scenery constraint, etc. The specific constraint model is expressed as follows:
where
The equipment balance constraint includes the thermal power balance constraint, the CSP heat storage constraint capacity, the CSP operation constraint, the natural gas power balance, the electric power balance constraint, and the storage hot water tank differential constraint.
where
Given the deepening coupling of electricity, heat, and gas systems, the traditional operation mode of electricity and heat separation and hierarchical scheduling of transmission and distribution networks has been difficult in achieving the global optimal operation strategy. In order to improve the new energy consumption and solve the multi-energy flow coupling system at the same time, this paper designs the architecture of the system as a whole; divides the multi-energy flow coupling system into two parts, in order to improve the new energy consumption and solve the multi-energy flow coupling system at the same time; inputs the multi-energy flow system data, scenery prediction power, and multi-energy flow coupling relationship network into the system internally; gets the multi-energy flow coupling relationship matrix; and judges whether the system progress meets the requirements. The lower layer is the multi-energy flow optimization solution layer, and the data that meet the requirements are input to the multi-energy flow optimization solution layer, which unites the constraints, carbon trading mechanism, and the total target model to derive the multi-scene operation strategy, as well as the characteristics to regulate the overall environmental protection of the system, and then derive the multi-scene operation strategy. The hierarchical multi-energy flow coupling network co-optimization solution relationship is shown in Figure 2.
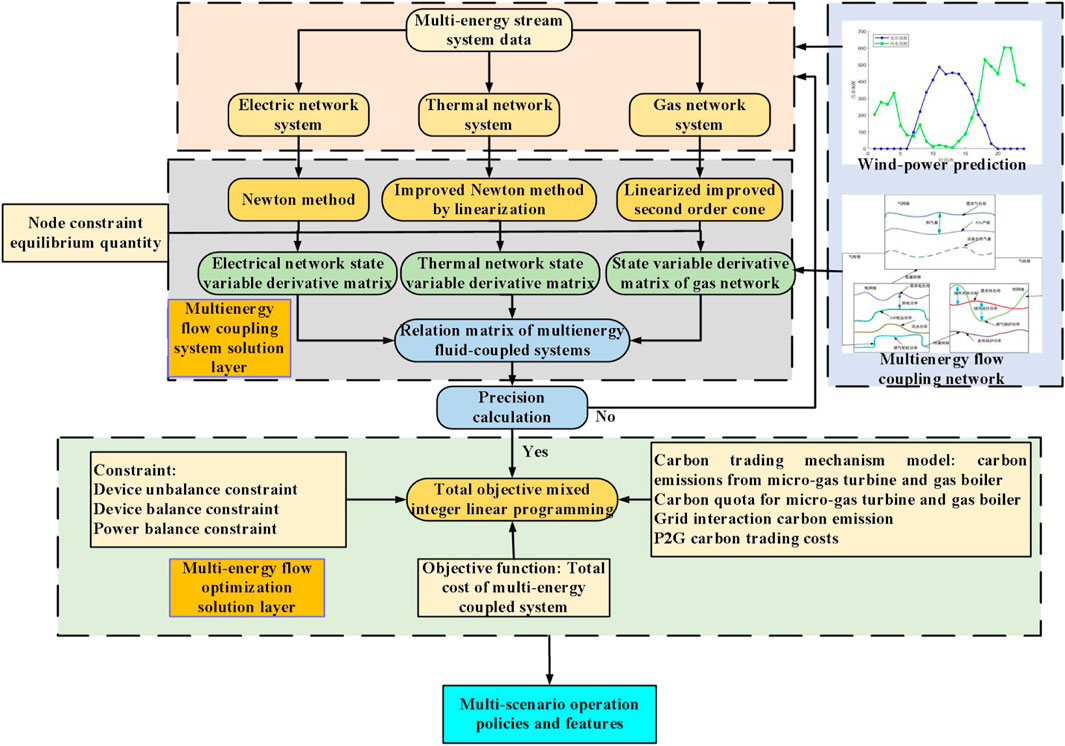
FIGURE 2. Block diagram of hierarchical multi-energy fluid-coupled network collaborative solution
The Newton–Raphson method, a common method in power systems, is very effective in solving nonlinear mathematical equations by solving a system of nonlinear equations to quickly linearize them for deriving the system node voltage and power.
A unified iterative approach is used to solve the state variables of the power system. The iterative equation for solving the power network currents of a multi-energy flow coupling system based on the unified solution method is
where
The second section of this paper is based on section 4. Hot water is used as the heat medium in the heating network area, and a part of the heat network factor is ignored in terms of the tide of the heating system, thus making the calculation simple. The heat network part is linearized and improved on the basis of the Newton–Raphson method to perform the optimal calculation of the heating and heat return network.
Compared to the observation in section 4, in this paper, to ensure the accuracy of the tide of the heat network, Kp becomes specifically
where
The expression for the heat transfer mass flow rate is as follows:
Substituting (27) and (28) into (12) yields the following linear expression:
Combining Eq. 14, (15), and (19) yields
From the aforementioned equation, the Newton–Raphson method total equation for the thermal system is
The derivative matrix of the thermal network equations concerning the state variables of the thermal network is
where
When the cost of the natural gas system is minimum, an improved linearized second-order cone programming method is used to enhance its constraint and fast convergence. Since the gas flow equation is nonlinear, the system operation is not accurate, and the running time is long, so the Taylor series expansion method is used to transform the nonlinear optimization problem into a mixed-integer optimization problem.
To ensure fast convergence in the iterative process, we introduce a minimal value auxiliary variable, resulting in the formula
The Taylor formula is introduced here for the first-order Taylor expansion as follows:
The introduction of the first-order Taylor expansion in the second-order cone optimization helps further improve the computational efficiency based on ensuring the high accuracy of the second-order cone. The system is computed until the difference between
The optimization problem for solving the model of the multi-energy flow coupling system in this paper is a mixed-integer linear programming problem, so the desired objective economic minimization is established and the following linear programming model is obtained by combining the aforeementioned equation constraints, inequality constraints, power networks, heat pipelines, and natural gas pipelines for comprehensive optimization:
where
In this paper, a standard IEEE 9-node electric system, 8-node thermal system, and 6-node natural gas system coupled into an electric, thermal, and gas multi-energy flow coupling system is used to analyze the calculations and verify the feasibility and effectiveness of the optimized operation method. The specific parameters of the equipment are shown in Table 1. The price of natural gas is 3.9 RMB/m3, and the civil time-of-use tariff is used as shown in Figure 3.
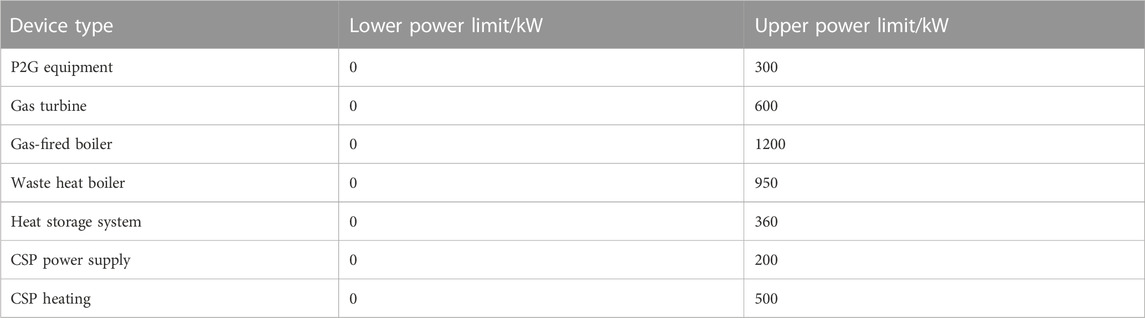
TABLE 1. Output parameters of equipment.
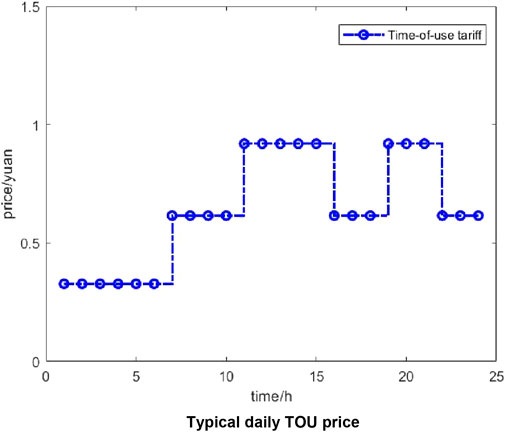
FIGURE 3. To ensure the reliability of this paper. Five different scenarios are designed: (1) only wind abandonment is considered; (2) only light abandonment is considered; (3) both wind and light abandonment are considered; (4) scenery complementarity is considered; (5) carbon trading and CSP solar thermal are not considered.
Table 2 shows the comprehensive consideration from the total cost of scenery scenarios considering scenery the most economical, while considering abandoned scenery scenes the least economical. The difference between the two is 5,428.392 yuan, and the overall economy can save 12.7%; from the perspective of interaction with the grid power, abandoned scenery scenes cost the most, considering scenery scenes the least, and the difference in cost 1,642.2 yuan, with an economic savings of 131.9%. This is because by reducing the scenery power generation, the multi-energy flow coupling system itself cannot meet the load-side demand; power must be supplied from the grid. From the perspective of equipment operation, the least abandoned scenery scenario, considering the scenery scenario the most, the economic difference is 6,756, and the economic increase is 29.6%. This is because the reduction of scenery equipment operation can eliminate the installation and operation costs, but the long-term benefits of reducing the installation cost are not considered. In the scenery penalty cost, the abandoned scenery and considered scenery difference is 8,132.8 yuan. Carbon transaction costs consider the scenery scenario the least and abandoned scenery scenario the most, with a difference of 269.3 yuan and an economic savings of 10.14%. This is because the increase of scenery access can reduce the purchase of electricity from the grid and reduce the behavior of gas turbine power generation, thus indirectly protecting the environment. From the comparison of scenario 4 and scenario 5, we do not consider the CSP power plant will increase the cost of electricity and gas purchases, which is not conducive to the overall economy and low carbon of the system in the long run.
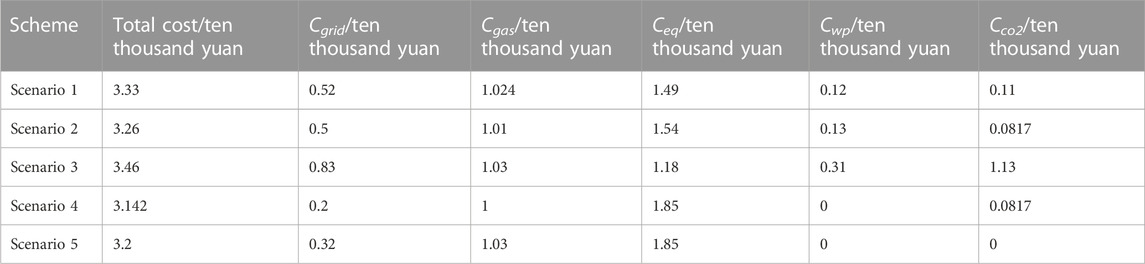
TABLE 2. System economic cost.
According to the aforementioned analysis, the CSP power plant and carbon trading mechanism can be effectively linked with the system electricity, heat, and gas cycle process to strengthen the complementary problem between energy sources in the coupled system, which can meet the new energy consumption of the system and reduce the operation cost of the system, making the user side economic and low-carbon optimal. As the basis of simulation analysis, scenario 5 is more realistic and complex, which can analyze the system operation status and problems more comprehensively and reflect the real situation better. Therefore, scenario 5 is used later to better simulate the actual situation and to find more reliable and specific scheduling strategies.
The wind and light prediction and its actual output fluctuation curve are shown in Figure 4. The predicted values in this paper are predicted from the system data, while the actual output fluctuation curve is based on the actual data required during the scenery operation of the system in this paper. According to the graph, the overall comparison between the predicted value of scenery and the actual output fluctuation curve is the same because the actual output fluctuation of scenery in the system does not exceed the predicted value. The actual result can be based on the predicted value for operation analysis, timely adjustment of scenery output operation strategy to ensure stable and efficient energy supply to the system, enhancing the reliability of the system, and improving the practical application value of the model.

FIGURE 4. Landscape prediction versus reality
Figure 5, Figure 6, and Figure 7 show the optimal electrical load, the optimal thermal load, and the CSP discard heat diagram of the solar thermal power plant system at different times of the day under the demand-side load, respectively. The gas turbine and the new energy equipment generate electricity, and the remaining insufficient power is purchased from the grid to reduce the cost of electricity purchase. In the heating system, the main sources of heat supply are waste heat boilers and gas boilers, and part of the heat from the CSP power station is used for power generation in addition to part of the heat storage system for heat charging. The remaining part of the heat will be discarded by the CSP system. Most of the time, the heat supply from GB and HS is sufficient to meet the load demand, and in the periods of 0–3 and 10, the heat supply from GB and WH is insufficient, and the HS system will exert heat to replenish heat. The heat storage system will replenish heat in the periods of 8 and 12; in connection with the graph of heat discarded from the CSP, the heat discarded from the CSP power plant at night is 0, mainly because the heat is stored in the tank during the daytime and used for heating at night, and the heat during the daytime is more abundant, and part of the heat will be dissipated. In summary, CSP power plants can effectively improve the temporal and spatial utilization of energy, enhance the economic feasibility of the system, reduce the unfavorable factors of using electricity to set heat as well as heat to set electricity, and ensure the demand response of the system load.
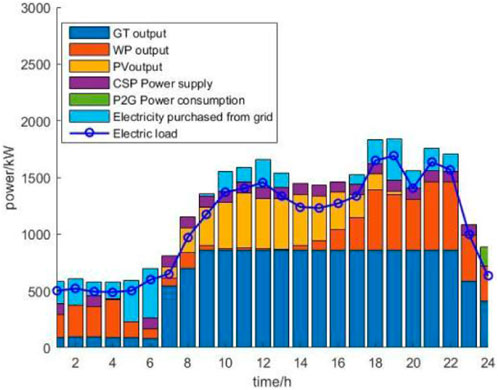
FIGURE 5. Optimal running state of electrical load.
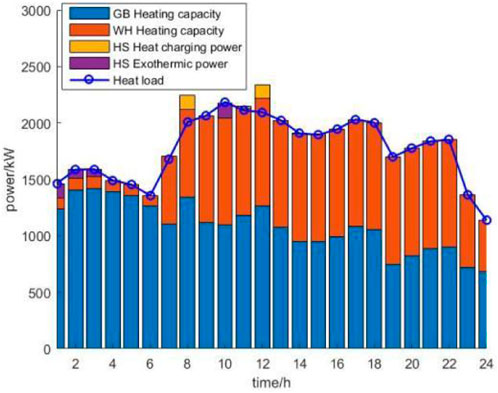
FIGURE 6. Optimal heat load running state.
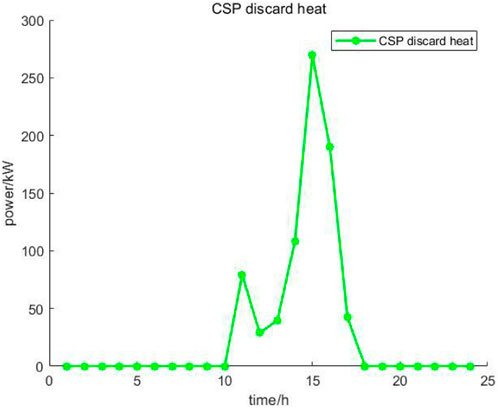
FIGURE 7. Discarded heat of CSP.
Figure 8 shows the heat load demand as well as the net heating power simulation comparison. In general, the net heating power in figures a, b, c, and e cannot meet the heat load power in time, and the net heating power in d can meet the heat load demand at all times. When the system is missing wind energy, the P2G equipment reduces energy consumption, the system gas boiler heat supply heat is reduced, and the heat supply is insufficient at 10 periods; when the system lacks light energy, the PV power generation system and the CSP power station’s energy supply is reduced, and the system increases the power purchase from the grid to meet the power supply of the equipment to meet the power balance, which leads to the waste or missing of heat supply energy of the gas boiler or the waste heat boiler at some moments; when the system does not consider carbon trading and the CSP solar thermal power plant, the power system and thermal system supply energy decreases so that the power output of energy storage, gas boiler, and waste heat boiler is increased or reduced to meet the thermal power and electric power balance, which makes the net power output unable to track the heat load power. Therefore, to ensure the reliability of the system energy supply, the introduction of the CSP power plant and carbon trading into the system can increase its effectiveness.

FIGURE 8. Comparison of heat load and net heating power in multiple scenarios.
The following Figure 9 shows the slope of the nodes of the gas network pipeline. The slope of the five nodes of the system changes from 2.2361 to 0.025 in 24 h, which indicates that the error of the system
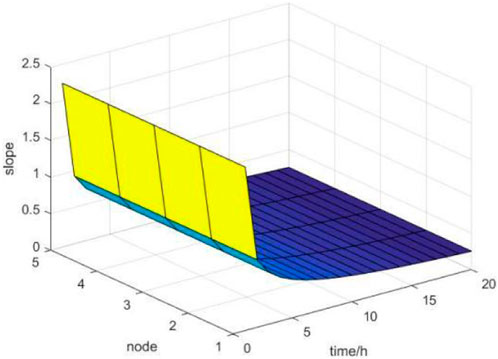
FIGURE 9. Slope of gas network pipeline nodes.
As shown in Figure 10 for the change in pipeline gas flow, natural gas network nodes 1 to 6 increase suddenly, mainly at 0,800, 1,100, 1,700, and between 2,100 and 2,300, which is due to the need to meet customer-side demand, resulting in higher gas consumption during this period, when gas turbines, gas boilers, and P2G equipment are concentrated in this period for power generation.
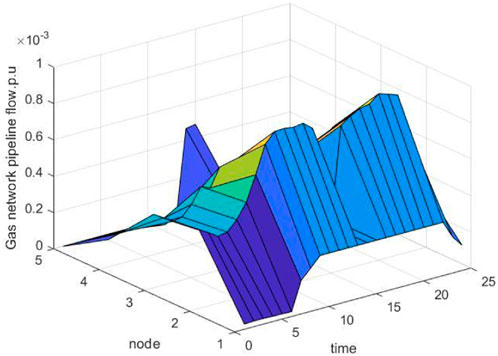
FIGURE 10. Gas network pipeline flow.
Figure 11 shows the comparison of multiple scenarios of gas output from gas wells in the gas network. Overall, the amount of change in gas wells b, c, and d is the same, and a and e change more obviously. Gas well a remains at 300 m3 at 12:00–15:00 for gas well 1 and fluctuates between 500 m3 and 600 m3 for gas well 2. This is due to a slight decrease in the power supply system power under abandoned wind conditions, which leads to a lower utilization rate of P2G equipment, and to ensure the power reliability of the heating system, thus increasing the amount of gas purchased from gas wells in the gas network; e in gas well 1 fluctuates within 20 m3–900 m3 and in gas well 2 fluctuates within 0 m3–600 m3. When carbon trading and CSP power plants are considered, it can be seen from a to d that the gas output from gas wells is smoother and less volatile, and carbon trading and CSP power plants fully supply the system electricity, effectively using P2G equipment to produce gas, reduce the frequency of frequent gas purchases from gas wells, and reduce volatility. However, when carbon trading and CSP power plants are not considered, the heating system is missing a part of the heating source, so to meet the heat load power, gas turbines and gas boilers frequently purchase gas from gas wells in the gas network to ensure the reliability of the system, and this will cause the economic cost of gas to increase. In summary, under the condition of wind and solar complementarity, it is not good to consider carbon trading and CSP power stations for the economy and environmental protection, and frequent gas supply from gas wells can increase the workload of the compressor and reduce its lifetime, so it is necessary to increase carbon trading and CSP power stations to improve the reliability of the system.

FIGURE 11. Comparison of gas output from gas wells in multiple scenarios of the gas network.
To enhance the new energy consumption of the system and strengthen the multi-energy complementary capability of the electric–heat–gas coupling system, this paper establishes a multi-energy flow coupling system structure model considering carbon trading and CSP photovoltaic power plant and puts forward a hierarchical optimization operation strategy of the electric–heat multi-energy flow coupling system, which aims at the minimization of the total cost of the user’s side, and introduces the model of the carbon trading mechanism for hierarchical optimization of the timing outputs of the electric–heat units in different scenarios, for achieving high accuracy and speed of the system, and verifying the rapidity and economy of the hierarchical optimization operation strategy of the system. In addition, some electric, heat, and gas loads are used as flexible loads to reduce the peak-to-valley difference of loads, alleviate the energy pressure of the unit, optimize the system operation, and improve the economy of the system.
The hierarchical multi-energy flow coupling network cooperative optimization solving algorithm can effectively improve the accuracy of the system to enhance the operation rate of the system. Wind and light can more effectively promote new energy consumption, reduce the system from the grid power purchase, reduce the frequency of grid power purchase in the multi-energy flow coupling system, and enhance the stability of the system energy supply to realize the efficient use of resources.
The combination of “carbon trading and CSP power plant” is applied to the optimal scheduling of the MFC system, which can better constrain the carbon emission of the MFC system and improve the economic and environmental benefits. Based on the demand-side dynamic load model, the system’s ability to consume new energy is increased, and the energy consumption in the valley power hours is improved, which can alleviate the pressure on the energy supply equipment during the peak period, make the load curves of electricity and thermoelectricity smooth at different moments, reduce the operation cost and energy waste of the system, and utilize the energy more fully.
With the increasing development of a low-carbon economy, the hierarchical multi-energy flow coupling network cooperative optimization solution algorithm used in this paper is of great significance for future development, which can improve resource utilization efficiency, optimize network performance, realize intelligent management, and promote innovation and development. It plays an important role in the future network system to promote social and economic progress. Meanwhile, the application of the combination of carbon trading and CSP power plant to the optimal scheduling of the multi-energy flow coupling system can promote sustainable energy development, reduce carbon emissions and environmental protection, improve the flexibility and reliability of the energy system, and promote energy transition and economic development. This application helps build a clean and sustainable energy system and promote sustainable social and economic development.
However, there is still room for exploration in the issue of static sensitivity analysis. Due to the existence of distributed power sources during the operation of the system, intermittent fluctuations in the output can be transmitted to the overall integrated energy system through coupling links, resulting in adverse effects and even safety issues. In the following work, static analysis methods based on power flow equations can be further explored to determine information related to weak nodes and critical branches of the system.
The original contributions presented in the study are included in the article/Supplementary Material; further inquiries can be directed to the corresponding author.
CH: mainly responsible for guidance; XC: mainly responsible for writing and building simulation; XZ: mainly responsible for some simulation. All authors contributed to the article and approved the submitted version.
This work was supported by the National Key R&D Program of China (2021YFE0103800) and the R&D Program of Beijing Municipal Education Commission (KM201710009002). The Organized Scientific Research Project of Norh China University of Technology (2023YZZKY05).
The authors declare that the research was conducted in the absence of any commercial or financial relationships that could be construed as a potential conflict of interest.
All claims expressed in this article are solely those of the authors and do not necessarily represent those of their affiliated organizations, or those of the publisher, the editors, and the reviewers. Any product that may be evaluated in this article, or claim that may be made by its manufacturer, is not guaranteed or endorsed by the publisher.
Ai, P., Zhang, X., and Wang, X. (2015). An improved implicit Z_(bus) Gaussian power flow calculation method based on compensation algorithm. Power Syst. Prot. Control 43 (21), 67–72.
Chen, S. (2021). Research on power flow and optimal power flow of integrated energy system based on unified energy path theory. Harbin, China: Harbin Institute of Technology.
Cui, Y., Zhang, J., Zhong, W., Wang, M., and Zhao, Y. (2023). Optimal Scheduling of solar thermal power plant with heat storage and wind power System considering electrothermal conversion. Proc. CSEE 20 (20), 6482–6494. doi:10.13334/j.0258-8013.pcsee.191635
Du, E., Zhang, N., Kang, C., and Miao, M. (2016). Review and prospect of grid-connected Operation and Optimization Planning of solar photovoltaic power generation. Proc. CSEE 36 (21), 5765–5775.
Fang, J., Zeng, Q., Ai, X., Chen, Z., and Wen, J. (2018). Dynamic optimal energy flow in the integrated natural gas and electrical power systems. IEEE Trans. Sustain. Energy 9 (1), 188–198. doi:10.1109/tste.2017.2717600
Hu, S., Yang, M., and Wang, F. (2017). A fast decoupling power flow calculation method for power distribution system based on coordinate rotation transformation. Power Syst. Prot. Control 45 (04), 40–44. doi:10.7667/PSPC160341
Hu, X., Wen, M., and Liu, Y. (2019). Reliability analysis of integrated energy system based on user-side energy conversion equipment. J. Electr. Power Sci. Technol. 34 (2), 11–19. doi:10.3969/j.issn.1673-9140.2019.02.002
Jiang, L., Yu, Y. L., Jiang, M., Cui, X. M., Liu, D. Q., and Ge, F. (2021). Suggestions on key issues in the "14th Five-Year Plan" energy planning. Enterp. Obs. 46 (01), 94–102. doi:10.19540/j.cnki.cjcmm.20201011.101
Jin, H., Sun, H., Guo, Q., Chen, R., and Li, Z. (2016). Multi-day self-dispatching method of solar thermal power-wind power combined system with large-scale heat storage. Automation Electr. Power Syst. 40 (11), 17–23. doi:10.7500/AEPS20150826012
Li, G., Zhao, Y., and Chan, J. (2018). Unified power flow calculation of AC-DC hybrid distribution network based on branch model. Power Grid Technol.
Li, Q., Deng, G., Zhang, J., Dong, F., Tian, L., Wan, W., et al. (2021). Two-stage scheduling Strategy for multi-source combined power generation System based on Solar thermal power generation. Acta Energiae Solaris Sin. 42 (12), 86–90. doi:10.19746/j.cnki.issn.1009-2137.2021.01.014
Li, W., Ma, J., Hu, X., Yu, R., and Li, P. (2022). Calculation method of push-back energy generation flow before unification of urban integrated energy network. Electr. Power Autom. Equip. 42 (09), 1–8. doi:10.16081/j.epae.202201023
Liu, L., Luo, N., Wu, T., and Zheng, W. (2023). Optimization of virtual power plant scheduling considering demand side response based on mixed integer second-order cone programming. Acta Energiae Solaris Sin. 42 (08), 96–104. doi:10.19912/j.0254-0096.tynxb.2020-0439
Liu, M., Tay, S., Bell, S., Belusko, M., Jacob, R., Will, G., et al. (2016). Review on concentrating solar power plants and new developments in high temperature thermal energy storage technologies. Renew. Sustain. Energy Rev. 53, 1411–1432. doi:10.1016/j.rser.2015.09.026
Qaisrani, M. A., Wei, J., and Khan, L. A. (2021). Potential and transition of concentrated solar power: a case study of China. Sustain. Energy Technol. Assessments 44, 101052. doi:10.1016/j.seta.2021.101052
Qu, K., Huang, L., Yu, T., and Zhang, X. (2018). Decentralized scheduling of multi-region integrated energy system under carbon trading mechanism. Proc. CSEE 38 (03), 697–707. doi:10.13334/j.0258-8013.pcsee.170602
Rahbari, H. R., Mandø, M., and Arabkoohsar, A. (2023). A review study of various High-Temperature thermodynamic cycles for multigeneration applications. Sustain. Energy Technol. Assessments 57, 103286. doi:10.1016/j.seta.2023.103286
Sun, L., Tuo, C., Tian, M., Xu, J., and Pan, C. (2020). Power Flow calculation Method of traction network considering the Influence of electrothermal Coupling. Power Grid Technol. 44 (07), 2665–2673. doi:10.13335/j.1000-3673.pst.2019.1557
Tsai, M. T., and Yen, C. W. (2010). “An improved particle swarm optimization for economic dispatch with carbon tax considerations,” in Proceedings of the IEEE International Conference on Power System Technology, Zhejiang, China, October 2010.
Wang, Y., Kang, L., and Zhang, J. (2021). Development history, typical forms and future trends of integrated energy systems. Acta Energiae Solaris Sin. 42 (8), 84–95. doi:10.19912/j.0254-0096.tynxb.2019-0763
Wu, Y., Lou, S., and Lu, S. (2011). A model for power system interconnection planning under low-carbon economy with CO2 emission constraints. IEEE Trans Sustain. Energy 2 (3), 205–214. doi:10.1109/TSTE.2011.2118241
Yun, Y., Dong, H., Chen, Z., Huang, R., and Ding, K. (2020). Two-stage stochastic Optimal Scheduling of multi-source power generation system considering randomness and participation of photothermal power station. Power Syst. Prot. Control 48 (04), 30–38. doi:10.19783/j.cnki.pspc.190380
Zhao, X., Tan, H., Sun, M., and Feng, X. (2022). Electric, gas-water hybrid power flow model for regional water-energy coupling system. Power Grid Technol. 44 (11), 4274–4284. doi:10.13335/j.1000-3673.pst.2020.0492
Zhou, B., Yao, X., and Zang, T. (2022). Optimization and reconstruction of comprehensive Energy Distribution Network considering power-gas bidirectional coupling. Electr. Meas. Instrum. http://kns.cnki.net/kcms/detail/23.1202.TH.20210518.1637.006.html.
Keywords: multi-energy flow system, carbon emission trading, Newton’s method, second-order cone solving, CSP power plant, layered optimization
Citation: Hu C, Cai X, Zhao X, Luo S, Lu H and Li X (2023) Carbon trading-based layered operation optimization of the electric–thermal multi-energy-flow coupling system with photothermal power stations. Front. Energy Res. 11:1252414. doi: 10.3389/fenrg.2023.1252414
Received: 03 July 2023; Accepted: 06 October 2023;
Published: 31 October 2023.
Edited by:
Chengguo Su, Zhengzhou University, ChinaReviewed by:
Hamid Reza Rahbari, Aalborg University, DenmarkCopyright © 2023 Hu, Cai, Zhao, Luo, Lu and Li. This is an open-access article distributed under the terms of the Creative Commons Attribution License (CC BY). The use, distribution or reproduction in other forums is permitted, provided the original author(s) and the copyright owner(s) are credited and that the original publication in this journal is cited, in accordance with accepted academic practice. No use, distribution or reproduction is permitted which does not comply with these terms.
*Correspondence: Xinyu Zhao, MTYyMTQ4MjM5NUBxcS5jb20=
Disclaimer: All claims expressed in this article are solely those of the authors and do not necessarily represent those of their affiliated organizations, or those of the publisher, the editors and the reviewers. Any product that may be evaluated in this article or claim that may be made by its manufacturer is not guaranteed or endorsed by the publisher.
Research integrity at Frontiers
Learn more about the work of our research integrity team to safeguard the quality of each article we publish.