 Fengzhe Dai
 Fei Jiang
 Lei Chen
 Changlin Xiao
- School of Electrical and Information Engineering, Changsha University of Science and Technology, Changsha, China
To alleviate the challenges posed by high energy consumption, significant carbon emissions, and conflicting interests among multiple parties in a community-level microgrid, the authors of this study propose a master–slave game-based optimal scheduling strategy for a community-integrated energy system (CIES). First, we analyze the decision variables and revenue-related objectives of each stakeholder in the CIES, and use the results to construct a framework of implementation. Second, we develop a model to incentivize peak regulation and a ladder-type carbon trading model that consider the correlation between the load owing to residential consumers, the load on the regional grid, and the sources of carbon emissions. Third, we propose a master–slave game-based mechanism of interaction and a decision-making model for each party to the game, and show that it has a Stackelberg equilibrium solution by combining genetic algorithms and quadratic programming. The results of evaluations showed that compared with an optimization strategy that considers only the master–slave game, the proposed strategy increased the consumption surplus of the user aggregator by 13.65%, the revenue of the community energy operator by 7.95%, increased the revenue of the energy storage operator, reduced CO2 emissions by 6.10%, and adequately responded to peak-cutting and valley-filling by the power grid company.
1 Introduction
The community-integrated energy system (CIES) is designed to meet the diverse energy-related needs of residential users by considering multiple types of energy production, conversion, and storage processes within the community (O’Dwyer et al., 2019; Wang et al., 2021). However, the high levels of energy consumption and carbon emissions in residential communities cannot be ignored. The ratio of energy consumption in the residential communities of China exceeded 30% of the country’s total energy consumption in 2022, and the total carbon emissions from residential houses accounted for about 17% of total emissions (Wu et al., 2023). This has led to growing interest in the construction of the CIES to integrate energy supply with the relevant information, multi-energy coupling, and efficient low-carbon energy use by taking into account the interactive characteristics of residential load and the energy market.
The degree of interactive coupling between energy supply and demand has gradually deepened with the reform of the electricity market and the continual development of the CIES, and has transformed the traditional top-down, integrated structure of the supply and demand for energy into an interactive structure (Sun et al., 2022; Veichtlbauer et al., 2022; Qiu et al., 2023). However, the presence of multiple interest groups in the CIES makes it difficult to accurately describe their interactions by using the traditional, centralized strategy for optimization because each player needs to coordinate its interests when interacting with the other players. Game theory has been widely used in various disciplines, including finance, and securities and economics as an effective means of resolving the associations or conflicts among multiple participating agents in the market (O’Dwyer et al., 2019).
Several scholars have conducted exploratory research on using game theory to optimize the scheduling of the CIES. Xu and Yi (2023) constructed a one master–multiple slaves game model to optimize distributed cooperation among multiple types of loads in the CIES, while Huang et al. (2022) proposed a method to optimize a thermal–electric energy system by considering dynamic pricing and the optimization of the operational strategy of a Stackelberg game. One study (Li et al., 2020) introduced a model of game-based interactions between electrically coupled systems and the load aggregator, and Li P. et al. (2021) proposed a framework to optimize a Stackelberg game involving the community energy operator and the aggregator of residential customers to achieve a comprehensive demand response for electric and thermal loads in the CIES. Li et al. (2022) proposed a hierarchical, partitioned approach to optimize multi-energy supply and demand in integrated energy systems in the framework of a master–slave game. Wang et al. (2023) develops an optimal energy bidding mechanism for the regional integrated electricity-hydrogen system considering complex electricity-hydrogen energy flow and further presents an electricity-hydrogen optimization management strategy based on Stackelberg game. Although the above studies have considered the game-based interactions among the community energy operator, the aggregator of residential customers, the energy storage operator, and other participants within the CIES, they have mostly focused on the collaborative optimization of such sources of energy such as electricity, heat, and cooling, and have not adequately addressed the joint optimization of coupling devices for heterogeneous sources of energy, such as electric heating and electric cooling on the side of the customer in the residential community. Moreover, relatively little research has been devoted to the optimal scheduling of flexible loads by considering grid peaking under the master–slave game-based framework.
1.1 Related work of demand response and carbon trading models for residential customers
Demand response (DR) gives more flexibility to modern smart grids to compensate for the variability of renewable sources. As the business model of the CIES matures and multiple such energy systems coexist in the same region, the aggregator of residential customers becomes an important resource for regional grid peaking. Yu et al. (2022) adjusted the timing of electricity consumption by residents to show that a smart home can improve the flexibility of the load and has significant potential to adequately respond to the demand for power. Building on this work, Gao et al. (2022) constructed a multi-objective model of optimal scheduling under constraints imposed by various uncertainties and the demand response to promote load shifting between the peak and valley areas. Guo et al. (2021) also constructed a model to optimize an integrated energy system by considering the DR with carbon emissions and the peak-to-valley ratio of load as the objectives of optimization. Wei et al. (2022) proposed an economic optimization method for depth peak regulation and the depth of the emergency of the energy storage accident on the demand side. Meanwhile, carbon trading mechanism, as one of the effective ways to realize the goal of “double carbon”, has been studied in depth in the integrated energy system. To achieve the objective of low-carbon emissions, Lv et al. (2022) introduced the reward and punishment carbon trading mechanism, and established a multi-actor low-carbon interaction model considering the carbon trading mechanism. Xiang et al. (2021) also established a low-carbon optimization model for the coupled electricity-gas system by comprehensively considering the carbon capture, carbon emission right trading and DR mechanism of the coupled electricity-gas system. While some studies have introduced a reward-and-penalty mechanism of carbon trading, and have established a multi-participant model of low-carbon interaction by considering carbon trading and game-based optimization, the relationships of energy trading involving multiple stakeholders has not been considered in the CIES.
1.2 Main outcomes of this work
The above review shows that most dispatching strategies for the CIES are based on the optimal dispatch of electricity, heating, and cooling, with little consideration of the potential for customer participation in the regulation of the DR, and the capability of regulation of customer-side energy coupling devices. In addition, the master–slave game for the CIES usually involves the leader setting the price and the follower adjusting the demand due to limitations of the end-use tariff-based mechanism of control. Prevalent work has not considered the role of incentive-based DR in regulating the system, and has not adequately explored the capacity for peak-shaving in case of flexible loads and energy storage devices. Moreover, most studies on game-based interactions in the context of the CIES have considered only the economic benefits of each player, and few have accounted for low-carbon emissions of the system as a boon.
To address the above issues, this study proposes an optimal dispatching strategy that considers the participation of the CIES in peak-shaving and carbon trading in the grid. The main contributions and innovations are as follows.
1) We create a peaking score-based model of incentives for the grid company that considers the correlation between loads, and coordinates a dynamic pricing strategy with a community energy operator to encourage the participation of the aggregator of residential consumers in peaking. Moreover, we propose a trading mechanism for carbon emissions in the CIES that balances economic and environmental benefits.
2) We propose a game model for multi-energy optimization in the CIES, with a revenue model for each stakeholder, that comprehensively considers customer-side energy equipment and storage. The community energy operator leads and the residential customers follow. We also prove the uniqueness of the Stackelberg equilibrium solution of the two-layer model by using the Cplex solution tool combined with the genetic algorithm.
3) The introduction of the peaking incentive and the ladder-type carbon trading mechanism can effectively improve the supply and consumption of energy for each stakeholder in the CIES.
2 Basic framework of community-integrated energy system
The CIES is a combination of the grid company, the community energy operator, the aggregator of residential customers, and the electric energy storage operator. The community energy operator is the leader, the aggregator of residential customers is the follower, and the two play a master–slave game. The grid company and the electric energy storage operator are not directly involved in the game, but participate in grid peaking and carbon trading in the market to obtain revenue, and achieve the optimal dispatch of the supply and consumption of energy in the CIES. Figure 1 illustrates the framework of implementation.
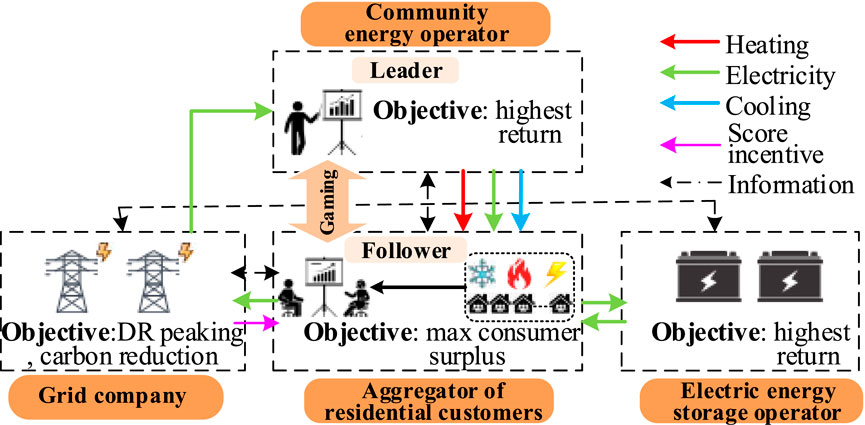
FIGURE 1. Framework for the master–slave game-based optimization of scheduling of the CIES.
The community energy operator purchases or produces its own energy from electricity, heating, and cooling from the “source” side, optimizes the pricing of the energy obtained through heating and cooling as well as the output of gas turbines and absorption chillers, and sells it to the aggregator of residential customers on the “load” side to benefit from the difference in price. The community energy operator enhances the flexibility of current residential tariff-based strategies to facilitate reasonable customer participation in the energy market. However, there is a risk of reduced efficiency or losses for the community energy operator in case of a mismatch between the supply and demand for sources and loads, or fluctuations in the purchase and sale prices.
The grid company aims to induce the aggregator of residential customers to participate in peaking and in reducing the carbon footprint of the system. However, if the game is played with only economic gains in mind, it may lead to new peak loads during low-tariff periods. The design of the incentive is a major factor influencing the effectiveness of the DR because end-use tariff in China is regulated, which makes it difficult to develop flexible tariff-based policies (Zhang et al., 2021). The DR score was introduced as an incentivization aid to quantify the capacity of the aggregator of residential customers to contribute to peak regulation based on the similarity between its curves of the electrical load and the regional grid load (Jebli et al., 2021).
The aggregator of residential customers aggregates individual residents at scale, receives the sale price of energy from the community energy operator, considers the grid company’s incentive for peak-shaving and its carbon trading mechanism, and accordingly adjusts the outputs of the electric cooling and heating equipment as well as the flexible demand for load to achieve maximum consumer surplus.
The electric energy storage operator provides energy storage services to the aggregator of residential customers to generate revenue, and adjusts the start/stop status of the equipment in real time. The distribution of the energy equipment as well as the distribution of the flow of energy in CIES are shown in Figure 2.
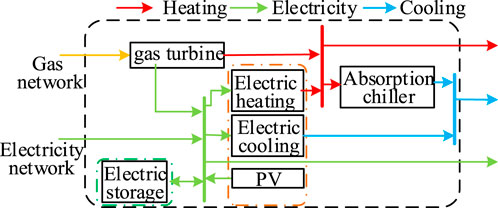
FIGURE 2. Distribution of energy flow and various types of energy equipment in the CIES.
3 Models of participants in the community-integrated energy system
3.1 Peaking model of community-integrated energy system by considering load correlation
Compared with the price-based DR model, the incentive-based DR model can better exploit the potential of the aggregator of residential customers for DR. However, it has the drawback of requiring a pre-signed agreement, and may not cover the participation of all residential customers. To combine the advantages of both models and overcome their disadvantages, we propose an improved incentive-based DR peaking model that considers the correlation in loads without the need to sign an incentive agreement.
We use curves of the intra-day load of the residential community and the regional load on the grid to construct a model of the parameters of correlation to calculate the incentive-related credit for the contribution of the aggregator of residential customers to DR peaking (Jebli et al., 2021). This model uses the Pearson correlation coefficient, which ranges from −1 to 1, to assess the correlation between the sets of variables M1 and M2. In contrast to the Euclidean distance, which is suitable for measuring the similarity between numerical data, the Pearson correlation coefficient is a measure of the strength of the linear relationship between variables, and can be used to measure the correlation between sets of curves of load consisting of time-series data. The correlation between these sets of variables can be calculated as follows:
where cov (M1,M2) is the covariance-based solution and σ is the standard deviation-based solution. Larger values of ρM1,M2 indicate greater correlation between M1 and M2.
By substituting the typical daily load power of the aggregator of residential consumers into M1 and that of the regional grid into M2, the standard deviation of the load of the aggregator of residential customers in the denominator can be simplified to a constant uPuser. The model of the product of the moment and the Pearson correlation coefficient can then be used to measure the correlation between them. This is set as the peaking factor of the curve of load:
where
The higher is the trend of correlation between the curves (the peaking factor of the curve of load of the community), the less effective is the DR peaking, the lower is the incentive score of the aggregator of residential consumers, and vice versa.
To ensure the uniformity of the objective function of the aggregator of residential customers, the benchmark value of the maximum peaking capacity is used as the denominator of the model of correlation. The coefficient of conversion of the incentive is multiplied by this value to convert the incentive for the aggregator of residential customers to participate in DR peaking of the grid in the formula for calculation:
where ε is the coefficient of conversion of the incentive for power integration.
3.2 Ladder-type carbon trading model
The carbon trading mechanism involves the allocation of allowances for carbon emission by the market regulator for the sources of such emissions. The carbon trading model of the CIES includes allowances for carbon emissions, actual carbon emissions, and a ladder-type carbon trading model. The carbon emissions of the absorption refrigeration unit are not considered as it directly uses heating energy to cool, and thus consumes a small amount of electricity. It is assumed that the grid purchases electricity generated by using coal to calculate carbon emissions.
Allowances for domestic carbon emission are typically used as unpaid allowances, and the allowance for carbon emissions by the aggregator of residential customers MCO2 is used as a reference (Sun et al., 2023).
The model to calculate actual carbon emissions of the CIES MCO2,f is as follows:
where MCO2,buy,f and MCO2,GT,f are the actual carbon emissions due to electricity purchase on the grid side and the gas turbine, A1, B1, and C1 and A2, B2, and C2 are the accounting factors for carbon emissions for the grid-side coal-fired unit and the gas-fired unit in the microgrid, respectively, and PGT,t is the sum of the electric and thermal power outputs of the gas turbine at time t.
M’CO2 is the difference between the actual carbon emissions of the CIES MCO2,f and the carbon allowances MCO2, and is used to calculate carbon credits for the aggregator of residential consumers to participate in the carbon trading market. Then, the CIES ladder-type carbon trading model refers to literature (Sun et al., 2023) and constructs a ladder-type carbon trading mechanism with “multiple intervals and multiple price levels”. Due to limitations of space, we will not elaborate on it for the time being.
3.3 Community energy operator
The coupled gas–heating equipment used by the community energy operator is a gas turbine that generates electrical and thermal energy from external natural gas sourced via a network. The relationship between the power generated by the gas turbine and that generated by the heating system is described as follows (Shuai et al., 2023):
where Ph,t and Pe,t are the outputs of the thermal power and the electrical power of the gas turbine at time t, respectively, ηM,loss is the rate of loss of the power of heat production of the gas turbine, and ηM,e and ηh are the efficiencies of power generation and heat production, respectively.
The relationship between the power generated by the gas turbine and the cost of natural gas is shown in Eq. 7:
where Qlhv is the low-level calorific value of natural gas in the gas turbine, set to 9.7 kWh/m3, and ch is the outsourced unit price of natural gas, set to 2.5 ¥/m3 (Shuai et al., 2023).
The community energy operator uses absorption refrigeration units and domestic electric refrigeration units to synergistically supply cooling energy to the building for cooling collection. The characteristics of the temperature of these units are determined by using an equivalent model of their thermal parameters (Zou et al., 2019):
where Temin,t is the indoor temperature of the community freezer building at time t, Temout,t is the outdoor temperature at time t, r and c are the equivalent thermal resistance and the heating capacity of the building, respectively, Pcol,t is the total power output of the refrigeration unit at time t, and Δt is the minimum interval (Zou et al., 2019).
The total intra-day revenue of the community energy operator is calculated as:
where Cm,grid and Cm,u are the gains obtained by the community energy operator in transactions with the grid company and the aggregator of residential consumers, respectively. The community energy operator also sets tariffs that fall between the surplus feed-in tariff and the market time-sharing tariff. The two returns are calculated as follows:
where Pej,t is the power purchased from the grid, cc, ch, and ce are the unit prices set by the community energy operator for the sale of cooling, heating, and electricity to residential customers, respectively, ce,gb is the feed-in tariff for surplus electricity from the community energy operator, and ce,gs is the price at which the community energy operator purchases electricity from the grid companies.
In the master–slave game, it is assumed that the community energy operator purchases electricity only from the grid company, and does not have direct contact with the power producer. The constraints on the master–slave game are provided in Supplementary Appendix SC.
3.4 Aggregator of residential consumers
The aggregator of residential customers adjusts flexible loads, optimizes the outputs of the coupled electricity–cooling and electricity–heating equipment based on the sale price of energy, and sells the surplus PV power to the grid company, or stores it in the energy storage operator to improve the flexibility of energy use and revenue from grid peaking.
The mathematical models of the electric load PeL,t, thermal load PhL,t, and cooling load PcolL,t for the aggregator of residential consumers are as follows:
where PeLs,t, PhLs,t, and PcolLs,t are the base loads of electricity, heating, and cooling, respectively, Pc,t and Pd,t are the charging and discharging of power from energy storage at time t, respectively, Pe,t, Pej,t, and Pejs,t are the powers generated by the gas turbines and purchased/sold from the grid at time t, respectively, ΔPeL,t is the change in the transferable electrical load at time t, λex,t, λhx,t, and λcolx,t are the coefficients of reduction in the electric, thermal, and cooling loads for the aggregator of residential customers at time t, respectively, Pex,t, Phx,t, and Pcolx,t are the maximum values by which the powers of the electric, thermal, and cooling loads can be reduced, respectively, νh and νcol are the coefficients of the coupled electricity–heating and the electricity–cooling equipment, respectively, and Phd,t and Pcooling,t are their respective power outputs.
The constraints on the transferable electrical load, curtailable electrical load, and curtailable heating and cooling loads for residential customers are as follows:
where θ is the ratio of power adjustment of the transferable load, θmax is its maximum ratio of power adjustment, λX denotes [λex,t, λhx,t, λcolx,t]T, and [λmin, λmax]T denotes [λex,min, λhx,min, λcolx,min; λex,max, λhx,max, λcolx,max]T.
The total daily revenue of the aggregator of residential customers, Cuser, consists of the revenue Cu,m from the master–slave game with the community energy operator, the incentive-related revenue CDR,grid from its participation in DR peaking with the grid company, the cost of trading rights to carbon emissions Cu,CO2, the cost of the loss of satisfaction Cusafe, and revenues from the sale of surplus power Cu,grid and trading with the energy storage operator Cest.
The respective gains can be expressed as follows:
We convert the score of the incentive for peaking provided by the grid company into economic benefits for the aggregator of residential customers by multiplying the factor of the scale of pricing for it kJ-C by the price of purchasing power for the grid company:
Utility theory is commonly used in microeconomics to determine the extent to which consumers derive satisfaction from a purchased good. The total utility of the aggregator of residential customers is the sum of satisfaction from the purchase of cooling, heating, and electricity. The objective function is designed to maximize the surplus for the consumer, and is calculated as follows:
where Cusee is the cost of energy purchased by the aggregator of residential customers, τpun is the coefficient of the loss of satisfaction, Cusafe is the reduction in residential satisfaction, and Cxy,t is the utility function of the aggregator that reflects the level of satisfaction of customers from purchasing energy for electricity, heating, and cooling (Li P. et al., 2021). The utility function is described by fitting a quadratic functional form:
where x is the type of energy, E = {cooling, heating, electricity}, denotes the set of types of energy demanded by the aggregator of residential customers, δL,x, ωL,x, and cL,x are the coefficients of preference for energy consumption of the aggregator of residential customers, and PxL,t is the actual demand for power based on energy x within the CIES at time t.
3.5 Community electricity storage operator
We assume that the electricity energy storage operator has a device to store electric energy in situ for the community, and that the residual power Ees,t of the configured storage device at time t is related to the charging and discharging at that time, as described by Shuai et al. (2023).
The station for the storage of electrical energy charges the aggregator of residential customers a service fee that is given by:
where ces is the unit price of charging and discharging for energy storage, ¥/kWh, and Cesg is the fixed daily cost of rent of energy storage. See Supplementary Appendix SC for the relevant constraints.
The service revenue of the electricity storage operator includes the service fee and the revenue for the supply of electricity. The total revenue is thus calculated as follows:
where ces,c and ces,cd are the unit prices of electrical energy for charging and discharging energy storage, respectively.
4 Strategy for operation of community-integrated energy system based on master–slave game
4.1 Game theory and models
By combining the revenue-related objectives of the community energy operator and the aggregator of residential customers, we determine that the optimal dispatch of the latter is based on the sale price of energy for the former, and is influenced by the incentivizing credit for DR and the cost of ladder-type carbon emissions trading of the grid company. The result of optimal dispatch then acts backward on the selling price of energy for the community energy operator. This process is consistent with the logical structure of the master–slave game, and the model can be represented as follows:
The master–slave game model consists of three components: participants
The strategy of the community energy operator involves setting the price for intra-day sales of energy for cooling, heating, and electricity, and is expressed in vector form as
The respective models of revenue of the community energy operator and the aggregator of residential customers are provided in Eqs 9, 21.
4.2 Equilibrium solution of master–slave game
The game is said to reach Stackelberg equilibrium when neither the leader nor the follower can unilaterally change the equilibrium solution to increase the gains of both parties.
Theorem: A unique Stackelberg equilibrium solution exists if the master–slave game satisfies the three conditions provided by Huang et al. (2022) and Xie et al. (2023).
Proof of Theorem 1: The strategic models of the leader and the follower, including Eqs 8–25, and Equations (C1)–(C6) in Supplementary Appendix SC, are used to obtain the non-empty and tightly convex set of strategies of all participants. Thus, Theorem 1 has been proved.
Proof procedure of Theorem 2: Taking the first-order partial derivatives of Eq. 21 for the payoff functions of the aggregator of residential customers with respect to ΔPeL,t and Pxx,t, and setting them to zero yields the following:
The second-order partial derivatives of ΔPeL,t and Pxx,t are then solved for as follows:
Because the coefficients of preference of all users are positive, this means that the second-order partial derivatives obtained from Eq. 30 are all smaller than zero, and Eqs 28, 29 can yield the maximum values of the target revenue of the aggregator of residential customers.
Thus, Theorem 2 has been proved.
Proof of Theorem 3: By considering the existence of multiple energy flows for the aggregator of residential customers, we assume that the power generated by the gas turbine of the microgrid is lower than the net demand for electricity, such that the community energy operator needs to purchase electricity from an external grid. The revenue of the community energy operator is then as follows:
The set of optimization strategies of the aggregator of residential customers are imported into Eq. 31, while first-order partial derivatives of ce, ch, and cc are calculated (Huang et al., 2022).
The Hessian parameter matrix of the above revenue function is negative definite, which implies the existence of an extreme value. Similarly, when the aggregator of residential customers is considered to be a follower in the other scenarios, it can be shown that there exists a unique optimal solution for the leader, and this does not require further elaboration.
Thus, Theorem 3 has been proved.
Theorems 1, 2, and 3 show that there is a unique Stackelberg equilibrium for the master–slave game model constructed here. The above process is shown in Supplementary Figure SA4 in. The pricing strategy of the leader is solved for by using a genetic algorithm, and the utility function of the aggregator of residential loads is solved for by using the MATLAB R2021b toolbox Yalmip, and calling Cplex 12.8. The algorithm solution flowchart is shown in Supplementary Figure SA5.
5 Algorithmic analysis
5.1 Basic data
The proposed optimization strategy was analyzed by using a scenario involving energy consumption by a typical residential community in southern China in winter. Scheduling was optimized over 1 day divided into 24 periods. The relevant parameters of the equipment of the residential community are shown in Supplementary Table SB1. The typical outdoor reference temperatures were taken from Zou et al. (2019). The curves of electrical and heating loads of the residential community, curve of load of the regional grid, and curves of the PV output and time-of-use tariff are shown in Supplementary Figure A1. We set the reducible cooling and heating loads to 20% of the total load, and the reducible and transferable electric loads to 10% and 20% of the total load, respectively. The coefficients of preference for the aggregator of residential customers for consuming energy for electricity, heating, and cooling were δL,x = 0.008, ωL,x = 7, and cL,x = 0, respectively (Li Y. et al., 2021). The intervals of the upper and lower bounds of the pricing strategy of the community energy operator for the sale of energy for cooling, heating, and electricity were [0.6, 1.2], [0.15, 0.5], and [0.35,ce, t], respectively (Shuai et al., 2023). The indoor equivalent thermal resistance and equivalent heating capacity of the cooled building were R = 1.85 C/MW and C = 0.54 MWh/°C (Zou et al., 2019).
The conversion factor ε was set to one, the scaling factor kJ-C was set to 10, uPuser = 1, and the factor of the loss of satisfaction τpun was set to 0.1 (Shuai et al., 2023). The base price of carbon trading was 0.25 ¥/kg (Sun et al., 2023), the length of the interval was M0 = 300 kg, the growth rate was əCO2 = 25%, and the accounting factor for carbon emissions from the coal-fired and the gas-fired units were A1 = 0.0034, B1 = 0.38, and C1 = 36, and A2 = 0.001, B2 = 0.004, and C2 = 3, respectively (Sun et al., 2023). SOC(0) of electric energy storage was set to 0.5, base fee for energy storage use was 500 ¥/d and surcharge for charging and discharging was 0.05 ¥/kVA (Shuai et al., 2023). Genetic number was 150, chromosome length was 72, variation rate was 6%, crossover rate was 90% and population number was 60 in Section 4.2. We established and comparatively analyzed four strategies to verify the effectiveness of the proposed strategy, as shown in Table 1.
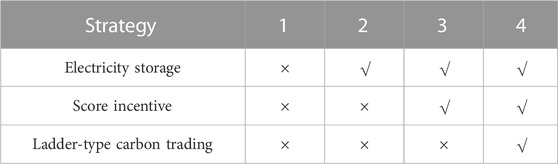
TABLE 1. Four operational strategies for the CIES.
5.2 Results of optimization
The four operational strategies were all based on the master–slave game mechanism involving the community energy operator and the aggregator of residential customers. The results of optimization are shown in Tables 2, 3. The gains of each participant in the game exhibited gradual convex convergence, as shown in Supplementary Figure SA2.
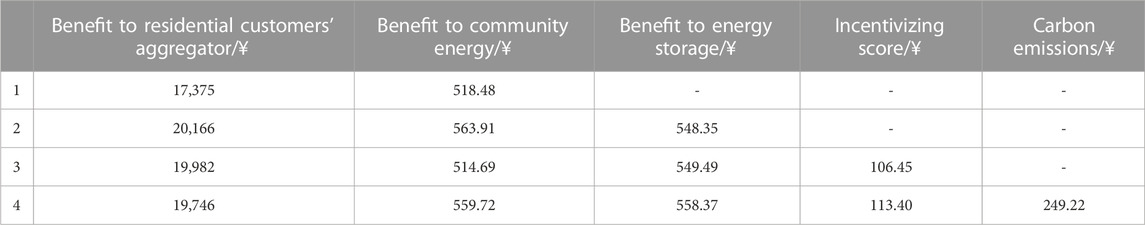
TABLE 2. Daily returns of the optimization of the strategy of each participant in the CIES under the four strategies.
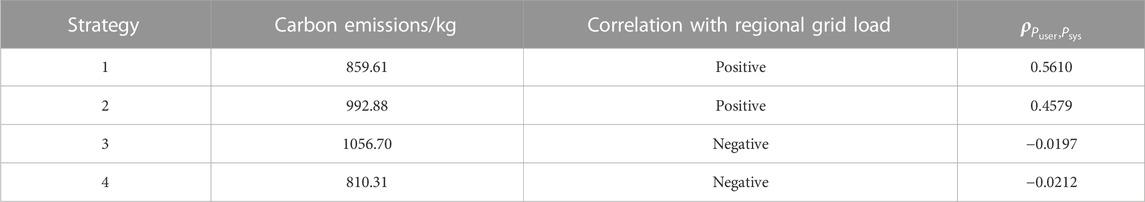
TABLE 3. Carbon emissions and coefficients of peak-shaving of the CIES under the four strategies.
Tables 2, 3 show that under strategy 2, the aggregator of residential customers paid an additional ¥548.35 for electricity storage and in fees for charging services compared with strategy 1. However, by participating in the time-of-use tariff and adjusting its load, the aggregator was able to reduce the peaks and fill the valleys, and this led to an increase of ¥2791 in the total revenue, with an increase of ¥45.43 in the revenue of the community energy operator. Despite this, the total production and supply of energy increased, leading to an increase of 133.27 kg in carbon emissions under strategy 2.
Under strategy 3, the aggregator of residential customers received incentivizing credit from the grid company that increased its overall revenue by ¥106.45. However, the revenues of the community energy operator and the operator of energy storage decreased by ¥184 and ¥49.22, respectively, due to adjustments in the load due to DR. By participating in the DR of the grid, the changes in energies for cooling, heating, and electricity due to load shedding and shifting increased, thus reducing the peaking factor of the load to −0.0197 (the lower the negative factor was, the better was the effect of peaking) but increasing carbon emissions by 63.82 kg.
By comparison, strategy 4 reduced carbon emissions by 246.39 kg compared with strategy 3, with a total cost of carbon emissions of ¥249.22. Strategy 4 yielded the highest reduction in carbon emissions by the community of the four strategies, and the parameter of the correlation between its curves was lower than those in the other three strategies, as shown in Figure 4A. This shows that the stronger the inverse correlation was between the curves of load of residential electricity and the load of the regional grid, the better was the extent to which the peak-to-valley difference in load could be smoothened, resulting in the best peak-shaving effect. The revenue of the community energy operator increased by ¥45.03 and that of the electric energy storage operator increased by ¥8.89, thus yielding a win–win situation for all participants in the CIES. Strategy 4 was thus superior to strategies 1, 2, and 3.
Due to limitations of space, we analyze only strategy 2 (which considered only the energy storage operator) and strategy 4 (the proposed model) here. The optimized sale prices of energy for cooling, heating, and electricity for the community energy operator under strategy 2 and strategy 4 are shown in Figures 3A–C.
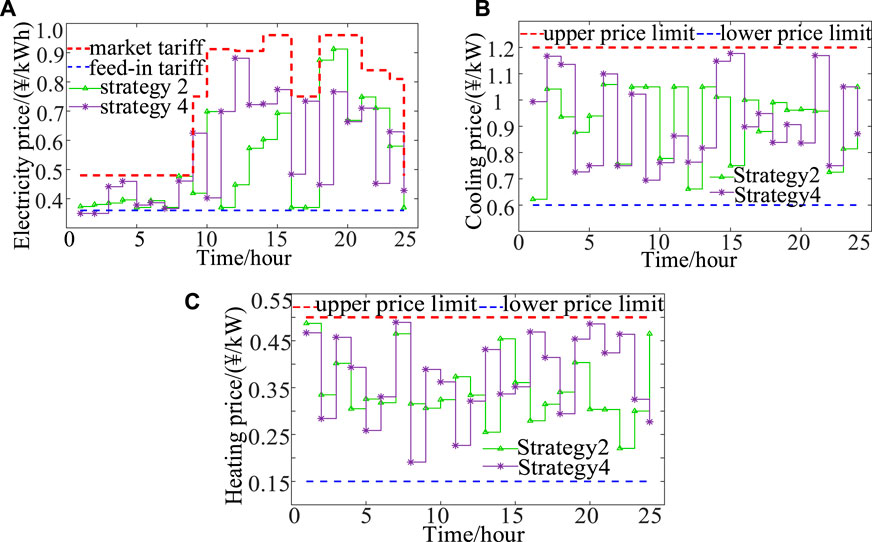
FIGURE 3. Optimized sale prices of energy for electricity (A), cooling (B), and heating (C) for the community energy operator.
The analysis in Figure 3 reveals that strategy 4, which considered the DR peak-shaving incentive of the grid company and the ladder-type mechanism of carbon emissions, led to greater differences in the sale prices of energy for cooling, heating, and electricity for the community energy operator than in strategy 2. Specifically, strategy 4 involved a rise in the sale price of electricity from 10:00 to 15:00 h to reduce power purchases from the grid company, and thus promoted peak load shedding and the consumption of PV power. The sale price of energy for cooling was raised from 1:00 h to 3:00 h, 14:00 h to 16:00 h, and at 21:00 h to reduce the use of energy for cooling by the absorption refrigeration units and increase the output of electric chillers during valley-induced tariffs.
Strategy 4 involved raising the sale price of energy for heating from 3:00 h to 7:00 h to reduce the purchase of natural gas and the generation of heat by the gas turbines, and to increase the output of electric heating generators during valley-induced tariffs. Moreover, the sale price of energy for heating was raised from 19:00 h to 23:00 h to increase the revenue of the community energy operator.
Figure 4A show the curves of the load due to electricity under strategies 2 and 4 to illustrate the impact of the peaking incentive and the mechanism of carbon emissions on outcomes of the game. Compared with strategy 2, strategy 4 retained the trend of the original curve of the electrical load. However, it involved higher electricity consumption during the valley hours from 0:00 to 7:00 h and decreased electricity consumption during the peak hours from 18:00 to 24:00 h. This period corresponded to that during which a higher sales price of electricity was set by the community energy operator as shown in Figure 3. The negative correlation between the curves of residential load and the load on the regional grid in strategy 4 is evident, and reflects the improved capacity for load regulation after optimization.
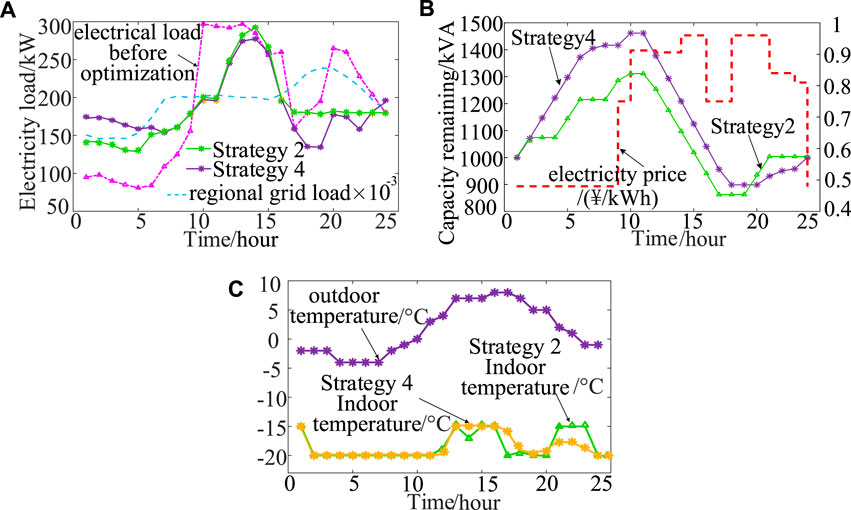
FIGURE 4. Curves of the optimized electrical load (A). Curves of change in the capacity for storage of electricity (B). Curves of change of the cooling temperature of the building (C).
Figure 5 shows that under strategy 2, the aggregator of residential customers increased the output powers of the electricity–cooling and electricity–heating units during 12:00–15:00 h to increase the consumption of PV power and, thus, its own revenue and that of the community energy operator. However, under strategy 4, the loads due to cooling and heating decreased from 12:00 to 15:00 h and at 22:00 h, resulting in a reduction in carbon emissions. Moreover, strategy 4 took advantage of the low price of energy for electricity, and the high prices of that for heating and cooling from 0:00 to 5:00 h to increase the output powers of the electricity–cooling and the electricity–heating units. It also increased the rate of consumption of PV power from 12:00 to 15:00 h to reduce the cost of energy and increase the revenue for the aggregator of residential customers.
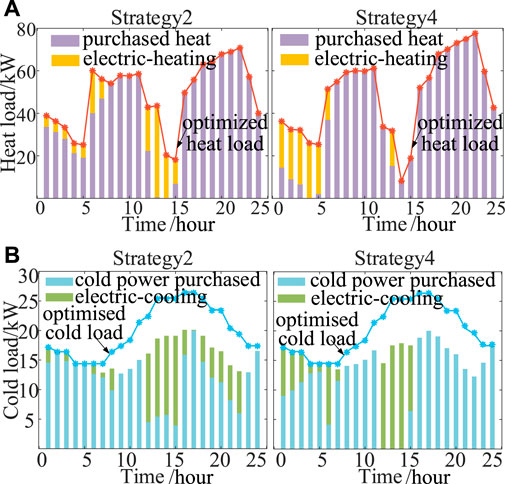
FIGURE 5. Optimization of curves of loads due to heating (A) and cooling (B).
Figure 4B illustrates that strategy 4 increased the peaking incentive for DR, in line with the peak-to-valley law of market tariffs. The participation of the electric storage operator increased the negative correlation between the curves of the loads of the aggregator of residential customers and the regional grid, thus enhancing peak and valley reduction. Figure 4C shows that the temperature profile of strategy 4 was stable in comparison with that of strategy 2. Cooling under this strategy was ideal from 19:00 to 22:00 h, and corresponded to the insufficient output from the absorption refrigeration unit in strategy 2, as shown in Figures 5A,B. Supplementary cooling by the electric refrigeration unit was thus required.
The authors also analyze in detail the output of the coal-fired unit and the gas turbine with carbon emissions in strategies 2 and 4 in the manuscript, and the simulation results are shown in the Supplementary Figure A3.
5.3 Discussion and limitations
Overall, Our study establishes a master-slave game-based optimal scheduling strategy for a CIES. Additionally, we have developed a model to incentivize peak regulation, which considers the correlation between the load from residential consumers and the load on the regional grid. The evaluation results show that the proposed strategy enhances the consumption surplus of the aggregator of residential customers and the revenue of the community energy operator, enabling the energy storage operator to capture some revenue simultaneously. More importantly, the proposed strategy is also beneficial to the grid company in achieving the goals of energy saving, carbon reduction, and peak-shaving.
Our study has some limitations. Specifically, we have not been able to extend the study further to the energy network with multi-CIES interconnection, which could further improve the economic benefits of energy trading within CIES. To address this problem, the authors recommend introducing PV power generation enterprises to become the second follower in the master-slave game model, which belongs to the unified hierarchy of the aggregator of residential customers. Additionally, the authors intend to construct a new model of multiple CIESs sharing the energy storage device to realize multi-CIES interconnection, so that the proposed model can be closer to real-world scenarios.
On the other hand, regarding the information flow set up by the above process, it belongs to the public and ideal state by default, and the authors have not investigated the methods and mechanisms for the interoperability of the signals of each participant for the time being. The Section 1 of this paper constructs the framework for the master-slave game-based optimization of scheduling of the CIES. The framework clarifies that energy trading includes both the community energy operator (leader) energy pricing strategy and the aggregator of residential customers (follower) load rationing response. The points trading in the first chapter references incentive-based DR, which rewards points credits in combination with the amount of customer load response. For communication between participants of CIES, Menniti et al. (2022) used enabling technologies for energy communities to realize flexibility service request interaction and information sharing, such as smart meters and improved electrical installations (Jiang et al., 2021). Additionally, Górski (2023) established an integrated services architectural view and two methods of modeling messaging flows at the service and business levels, realizing the sending of orders and confirmations between the business applications and then achieving message-friendly interactions.
In the next step of the research program, the authors will introduce advanced enabling technologies and algorithmic models for information interconnection and considerthe new mechanism of shared energy storage under the participation of multiple CIESs to make the proposed strategy more practically valuable. This will involve integrating load DR peaking mathematical models based on the game framework to better take advantage of the interaction between the master-slave game model and the DR model and realize the complementarity of the two models. The authors also intend to investigate methods and mechanisms for the interoperability of the signals of each participant to ensure effective communication and information sharing. By introducing these new elements to the model, the proposed strategy can be made more robust and better suited to real-world scenarios.
6 Conclusion and future work
In this study, the authors proposed an optimal scheduling strategy for the master–slave game in a CIES by considering incentives for peak-shaving and a ladder-type mechanism of carbon trading. The key findings of this research are as follows: 1) We constructed a Pearson’s correlation coefficient-based model of an incentive for peak regulation by the grid company through DR and a ladder-type model of carbon trading that are applicable to the CIES, with the aim of optimizing the allocation of scores for coupled multi-energy devices to participate in saving energy and reducing carbon emissions while taking into account both economic and environmental benefits. 2) The existence and uniqueness of a Stackelberg equilibrium solution for the proposed game model were demonstrated. In this solution, the sale price of energy is determined by the community energy operator and the demand for energy is adjusted in real time by the aggregator of residential customers. The iterative interaction between them was represented by using the Cplex solution tool combined with the genetic algorithm. 3) The synergistic optimization of energy for cooling, heating, and electricity within the CIES was comprehensively considered. The equipment for electric energy storage, electric cooling, and electric heating supplemented by the absorption chiller and gas turbine were considered in order to improve the flexibility of coupling between the supply of energy and the demand for it in the master–slave game.
At present, this paper mainly studies the day-ahead operation of the single-region CIES. In the follow-up work, the whole process of ladder-type mechanism of carbon trading and incentives for peak-shaving will be further extended to the energy network with multi-CIES interconnection by considering the effects of source-load uncertainty on optimal scheduling to realize the coordinated and stable operation of different energies.
Data availability statement
The original contributions presented in the study are included in the article/Supplementary Material, further inquiries can be directed to the corresponding authors.
Author contributions
FD: data analysis and writing. FJ: methodology. LC and CX: formal analysis. YW: validation. All authors contributed to the article and approved the submitted version.
Funding
This work was supported by the National Social Science Foundation of China (22CJY064), and by General Project of Hunan Natural Science Foundation (2021JJ30715).
Conflict of interest
The authors declare that the research was conducted in the absence of any commercial or financial relationships that could be construed as a potential conflict of interest.
Publisher’s note
All claims expressed in this article are solely those of the authors and do not necessarily represent those of their affiliated organizations, or those of the publisher, the editors and the reviewers. Any product that may be evaluated in this article, or claim that may be made by its manufacturer, is not guaranteed or endorsed by the publisher.
Supplementary material
The Supplementary Material for this article can be found online at: https://www.frontiersin.org/articles/10.3389/fenrg.2023.1247803/full#supplementary-material
References
Gao, F., Gao, J., Zhang, Y., Huang, N., and Wu, H. (2022). Community decision-makers’ choice of multi-objective scheduling strategy for integrated energy considering multiple uncertainties and demand response. Sustain. Cities Soc. 83, 103945. doi:10.1016/j.scs.2022.103945
Górski, T. (2023). Integration flows modeling in the context of architectural views. IEEE Access 11, 35220–35231. doi:10.1109/ACCESS.2023.3265210
Guo, Z., Zhang, R., Wang, L., Zeng, S., and Li, Y. (2021). Optimal operation of regional integrated energy system considering demand response. Appl. Therm. Eng. 191, 116860. doi:10.1016/j.applthermaleng.2021.116860
Huang, Y., Wang, Y., and Liu, N. (2022). A two-stage energy management for heat-electricity integrated energy system considering dynamic pricing of Stackelberg game and operation strategy optimization. Energy 244, 122576. doi:10.1016/j.energy.2021.122576
Jebli, I., Belouadha, F. Z., Kabbaj, M. I., and Tilioua, A. (2021). Prediction of solar energy guided by pearson correlation using machine learning. Energy 224, 120109. doi:10.1016/j.energy.2021.120109
Jiang, F., Peng, X., Tu, C., Guo, Q., Deng, J., and Dai, F. (2021). An improved hybrid parallel compensator for enhancing PV power transfer capability. IEEE Trans. Industrial Electron. 69 (11), 11132–11143. doi:10.1109/TIE.2021.3121694
Li, H., Yu, T., Zhu, H., Chen, Y., and Yang, B. (2020). Interactive equilibrium of electricity-gas energy distribution system and integrated load aggregators considering energy pricings: a master-slave approach. IEEE Access 8, 70527–70541. doi:10.1109/ACCESS.2020.2987035
Li, P., Wu, D., Li, Y., and Liu, H. (2021). Optimal dispatch of multi-microgrids integrated energy system based on integrated demand response and stackelberg game. Proc. CSEE 41 (4), 1307–1321+1538. doi:10.13334/j.0258-8013.pcsee.201845
Li, S., Zhang, L., Nie, L., and Wang, J. (2022). Trading strategy and benefit optimization of load aggregators in integrated energy systems considering integrated demand response: a hierarchical stackelberg game. Energy 249, 123678. doi:10.1016/j.energy.2022.123678
Li, Y., Wang, C., Li, G., and Chen, C. (2021). Optimal scheduling of integrated demand response-enabled integrated energy systems with uncertain renewable generations: a stackelberg game approach. Energy Convers. Manag. 235, 113996. doi:10.1016/j.enconman.2021.113996
Lv, G., Cao, B., Li, J., Liu, G., Ding, Y., Yu, J., et al. (2022). Optimal scheduling of integrated energy system under the background of carbon neutrality. Energy Rep. 8, 1236–1248. doi:10.1016/j.egyr.2022.02.295
Menniti, D., Pinnarelli, A., Sorrentino, N., Vizza, P., Barone, G., Brusco, G., et al. (2022). Enabling technologies for energy communities: some experimental use cases. Energies 15 (17), 6374. doi:10.3390/en15176374
O’Dwyer, E., Pan, I., Acha, S., and Shah, N. (2019). Smart energy systems for sustainable smart cities: current developments, trends and future directions. Appl. Energy 237, 581–597. doi:10.1016/j.apenergy.2019.01.024
Qiu, Y., Li, Q., Ai, Y., Chen, W., Benbouzid, M., Liu, S., et al. (2023). Two-stage distributionally robust optimization-based coordinated scheduling of integrated energy system with electricity-hydrogen hybrid energy storage. Prot. Control Mod. Power Syst. 8 (1), 33–14. doi:10.1186/s41601-023-00308-8
Shuai, X., Ma, Z., and Wang, X. (2023). Research on optimal operation of shared energy storage and integrated energy microgrid based on leader-follower game theory. Power Syst. Technol. 47 (2), 679–690. doi:10.13335/j.1000-3673.pst.2021.2191
Sun, H., Sun, X., Kou, L., Zhang, B., and Zhu, X. (2023). Optimal scheduling of park-level integrated energy system considering ladder-type carbon trading mechanism and flexible load. Energy Rep. 9, 3417–3430. doi:10.1016/j.egyr.2023.02.029
Sun, J., Hu, C., Liu, L., Zhao, B., Liu, J., and Shi, J. (2022). Two-stage correction strategy-based real-time dispatch for economic operation of microgrids. Chin. J. Electr. Eng. 8 (2), 42–51. doi:10.23919/CJEE.2022.000013
Veichtlbauer, A., Praschl, C., Gaisberger, L., Steinmaurer, G., and Strasser, T. I. (2022). Toward an effective community energy management by using a cluster storage. IEEE Access 10, 112286–112306. doi:10.1109/ACCESS.2022.3216298
Wang, L., Hou, C., Ye, B., Wang, X., Yin, C., and Cong, H. (2021). Optimal operation analysis of integrated community energy system considering the uncertainty of demand response. IEEE Trans. Power Syst. 36 (4), 3681–3691. doi:10.1109/TPWRS.2021.3051720
Wang, Q., Wang, Y., and Chen, Z. (2023). Stackelberg equilibrium-based energy management strategy for regional integrated electricity-hydrogen market. Front. Energy Res. 11. doi:10.3389/fenrg.2023.1169089
Wei, W., Ye, Z., Wang, Y., Dai, S., Chen, L., and Liu, X. (2022). An economic optimization method for demand-side energy-storage accident backup assisted deep peaking of thermal power units. Chin. J. Electr. Eng. 8 (2), 62–74. doi:10.23919/CJEE.2022.000015
Wu, S., Hu, S., Frazier, A. E., and Hu, Z. (2023). China's urban and rural residential carbon emissions: past and future scenarios. Resour. Conserv. Recycl. 190, 106802. doi:10.1016/j.resconrec.2022.106802
Xiang, Y., Wu, G., Shen, X., Ma, Y., Gou, J., Xu, W., et al. (2021). Low-carbon economic dispatch of electricity-gas systems. Energy 226, 120267. doi:10.1016/j.energy.2021.120267
Xie, D., Liu, M., Xu, L., and Lu, W. (2023). Multiplayer nash–stackelberg game analysis of electricity markets with the participation of a distribution company. IEEE Syst. J., 1–12. doi:10.1109/JSYST.2023.3240993
Xu, J., and Yi, Y. (2023). Multi-microgrid low-carbon economy operation strategy considering both source and load uncertainty: a nash bargaining approach. Energy 263, 125712. doi:10.1016/j.energy.2022.125712
Yu, B., Sun, F., Chen, C., Fu, G., and Hu, L. (2022). Power demand response in the context of smart home application. Energy 240, 122774. doi:10.1016/j.energy.2021.122774
Zhang, K., Yao, Y. F., Liang, Q. M., and Saren, G. (2021). How should China prioritize the deregulation of electricity prices in the context of carbon pricing? A computable general equilibrium analysis. Energy Econ. 96, 105187. doi:10.1016/j.eneco.2021.105187
Keywords: community-integrated energy system, master-slave game, peak-shaving incentive, ladder-type carbon trading, demand response
Citation: Dai F, Jiang F, Chen L, Wu Y and Xiao C (2023) Master–slave game-based optimal scheduling of community-integrated energy system by considering incentives for peak-shaving and ladder-type carbon trading. Front. Energy Res. 11:1247803. doi: 10.3389/fenrg.2023.1247803
Received: 26 June 2023; Accepted: 23 August 2023;
Published: 05 September 2023.
Edited by:
Liansong Xiong, Xi’an Jiaotong University, ChinaCopyright © 2023 Dai, Jiang, Chen, Wu and Xiao. This is an open-access article distributed under the terms of the Creative Commons Attribution License (CC BY). The use, distribution or reproduction in other forums is permitted, provided the original author(s) and the copyright owner(s) are credited and that the original publication in this journal is cited, in accordance with accepted academic practice. No use, distribution or reproduction is permitted which does not comply with these terms.
*Correspondence: Fei Jiang, amlhbWc4NTUyMUAxMjYuY29t