 Daohua Zhang
 Xinxin Jin1*
94% of researchers rate our articles as excellent or good
Learn more about the work of our research integrity team to safeguard the quality of each article we publish.
Find out more
ORIGINAL RESEARCH article
Front. Energy Res. , 04 August 2023
Sec. Smart Grids
Volume 11 - 2023 | https://doi.org/10.3389/fenrg.2023.1245495
Introduction: This paper proposes a power system fault prediction method that utilizes a GA-CNN-BiGRU model. The model combines a genetic algorithm (GA), a convolutional neural network (CNN), and a bi-directional gated recurrent unit network Bidirectional Gated Recurrent Unit to accurately predict and analyze power system faults.
Methods: The proposed model employs a genetic algorithm for structural search and parameter tuning, optimizing the model structure. The CNN is used for feature extraction, while the bi-directional gated recurrent unit network is used for sequence modeling. This approach captures the correlations and dependencies in time series data and effectively improves the prediction accuracy and generalization ability of the model.
Results and Discussion: Experimental validation shows that the proposed method outperforms traditional and other deep learning-based methods on multiple data sets in terms of prediction accuracy and generalization ability. The method can effectively predict and analyze power system faults, providing crucial support and aid for the operation and management of power systems.
The electric power system is one of the important infrastructures for the operation of modern society, and its safe and stable operation is crucial for the normal production and life of the country and its people (Rizeakos et al, 2023). However, failures and accidents occur occasionally because the power system is affected by various factors, such as natural disasters, aging equipment, and human operation errors. Therefore, power system fault prediction has become one of the important means for the safe operation of power systems.
In recent years, the rapid development of deep learning technology has provided new solutions for power system fault prediction research (Cheng and Yu, 2019). The GA-CNN-BiGRU model, a deep learning algorithm with the advantages of adaptivity, strong feature extraction power, and high classification, has achieved good results in power system fault data analysis and prediction. There still needs to be more in-depth research and exploration on the GA-CNN-BiGRU model for power system fault prediction (Cheng L. et al, 2022). Therefore, this paper propose a power system fault prediction algorithm based on the GA-CNN-BiGRU model, which can fully exploit the features in each power system fault data, thus improving the modeling accuracy of the model; our model can also handle the charge load and energy consumption involved in power system fault prediction and can model the complex relationship between these factors, thus improving the prediction accuracy and reliability (Hassani et al, 2022). And it can make predictions based on historical fault data and other related indicators in different cities and regions, providing customized power system fault prediction services for different cities and regions. Most importantly, the prediction results of the model can be visually analyzed and interpreted to help power system operators and managers better understand and interpret the prediction results to formulate more effective power system fault response measures.
The main methods commonly used to predict power system fault prediction are statistical models, regression models, time series models, and deep learning models.
Statistical model is a mathematical model based on statistical theory and methods used to describe and explain the relationships and laws between variables and predict the future trends of variables. Common statistical models include the ARIMA model, nonlinear regression model, generalized linear model, decision tree model (Cheng et al, 2021). The advantage of statistical models applied to power system fault prediction is that they are highly interpretable. They can predict the changing trend of faults occurring in the power system by analyzing the relationship between variables and provide a scientific basis for power system operators to formulate fault response strategies. And its applicability is wide and can be applied to different types of cities. However, the disadvantages of the statistical model are also obvious, such as this model needs to assume a definite relationship between the occurrence of power system failures and other factors, ignoring the complexity of the power system being affected by a variety of factors together, and can only consider known variables and factors, ignoring the impact of unknown factors and variables on the power system, which has certain limitations in the prediction of power system failures.
A regression model is a mathematical model based on statistical theory and methods to describe the relationships and patterns between variables. It aims to predict the trend of the dependent variable by establishing a mathematical relationship between the independent and dependent variables. Common regression models include linear regression models, nonlinear regression models, generalized linear models, etc., which can be applied in economics, management, environmental science, etc. Regression models have the following advantages in applying power system fault prediction (Bai et al, 2021). Regression models require fewer data, can fit the model based on a small amount of historical data, predict future fault incidence, and are suitable for cities with fewer data. However, the prediction results of regression models are greatly influenced by data quality, model assumptions, variable selection, and other factors, and there are large prediction errors. Coupled with the data for power system fault prediction involving multiple dimensions, the regression model is less effective in dealing with problems with complex data distribution and strong nonlinear relationships.
A time series model is a statistical model used to analyze time series data, which is a method of predicting future values based on the past values of time series data (Cheng et al, 2020). Time series data are arranged chronologically and usually include seasonal, cyclical, trend, and stochastic components. Common time series models include ARIMA models, seasonal autoregressive moving average models (SARIMA), exponential smoothing models, etc. Time series models can identify and isolate the seasonal and periodic variation patterns in time series data, which is conducive to developing more refined and effective power system fault prediction strategies (Du et al, 2023). However, time series models have obvious disadvantages in applying power system fault prediction. Time series models need to determine the model parameters, conduct sample analysis and model testing, and the data required for power system fault prediction are diverse and complex, which requires more workload and time, making the data analysis process time-consuming and laborious.
Deep learning is a machine learning approach based on a multilayer neural network model that learns and discovers complex features and patterns from data. The model usually consists of multiple layers, each containing multiple neurons, with data input through the input layer, computed and mapped through multiple hidden layers, and output (Chen X. et al, 2022). Common deep learning models include Generative Adversarial Networks (GAN), Autoencoders, Deep Reinforcement Learning, etc. In power system fault prediction, deep learning models have the following advantages: deep learning models can automatically learn and discover patterns and relationships from large amounts of data, can handle complex nonlinear and high-dimensional data without manually designing features, and can be used to make sense of large amounts of sensor data and various environmental variables, e.g., deep learning models can be used to predict the trend of load changes in power systems. However, the deep learning model requires a large amount of data and computational resources for training, and the training time and cost are high (Sun et al, 2022). Also, this model is more sensitive to the selection and adjustment of hyperparameters, which requires several trials and adjustments to obtain the optimal model. Its training time is long, and its interpretability is poor, so it is not easy to be convincing.
Based on the advantages and disadvantages of the above models, a GA-CNN-BiGRU prediction model for power system fault prediction is proposed in this paper. Firstly, the historical power system fault data are processed and normalized, including dividing the data into training and test sets; the hyperparameters of the model are searched and optimized using a genetic algorithm in the second step, then a convolutional neural network is used to extract features from the power system fault data, such as convolutional kernel size, number of convolutional layers, number of cyclic layers, etc. to obtain a series of convolutional feature maps, and finally a bidirectional gated recurrent neural network to model the convolutional feature maps serially to obtain the prediction results on time series.
The contributions of this paper are as follows:
• Compared with statistical models, our proposed model can handle nonlinear relationships that statistical models cannot handle, and its applicability is also broader and more generalized compared to statistical models;
• Compared with the time series model, the model has more powerful integration ability and feature extraction ability, and its stability and interpretability are also stronger compared with the time series model;
• Compared with deep learning models such as GNN, GAN (Cheng Y. et al, 2022), and BiLSTM models, the BiGRU model is not only simple in structure but also can process data more quickly, and the GA model and CNN model are added to further improve the prediction accuracy, robustness, and convincing conclusions are also greatly improved.
In the remainder of this paper, we present recent related work in Section 2. Section 3 presents our proposed methods: overview, GA model; CNN model; BiGRU model. The fourth part introduces the experimental part, including experimental details, group experiment comparison, etc. The fifth part is the summary.
Logistic Regression is a linear model for classification problems (Lv, 2022), which predicts the probability of classification by linearly combining input features with weights and transforming the results with a sigmoid function.
As a linear models commonly used in classification problems, it has the following advantages: First, it is simple and easy to use. The Logistic Regression model only needs to know the historical values of time series data to perform modeling and forecasting and does not need data analysis. Complex feature engineering and processing are easier and more convenient to use. Second, it is efficient and fast. The training and prediction process of the model is relatively fast, and the prediction results can be obtained in a short period, which is suitable for real-time prediction and application. Third, there are a few parameters. Compared with other deep learning models, this model has fewer parameters and can be trained on a smaller data set to avoid problems such as overfitting. However, in the data prediction process of power system faults, it is necessary to deal with nonlinear data. Still, because the model can only handle linear data, the modeling and prediction effect on nonlinear data is poor, so it is not easy to achieve expectations using this model Effect. And this model is sensitive to outliers. If there are outliers in the data, it may affect the model’s prediction accuracy. In addition, the Logistic Regression model has high requirements for data stability. If the data is not stable, it needs to be processed by difference, which will increase the complexity of the model and the difficulty of training.
Gradient Boosting Trees is an ensemble learning algorithm that achieves predictions by combining multiple decision trees (Mitrentsis and Lens, 2022). The basic idea of the gradient boosting tree is to gradually reduce the loss function by iteratively training the decision tree. Each tree is trained on the residual of the previous tree, and finally the prediction results of multiple models are weighted and combined to obtain Final Results.
As a machine learning model commonly used in classification and regression, this model has the following advantages. First, it has strong interpretability. The decision-making process reflected in the Gradient Boosting Trees model can be visualized and explained, which can help users better understand the decision-making process and prediction results of the model. Second, it has a wide range of applicability. The Gradient Boosting Trees model can be applied to various types of data, including discrete data and continuous data, and can also be applied to various tasks such as classification and regression. Third, the training speed is fast. The training speed of this model is fast, and the prediction result can be obtained in a short period of time, which is suitable for real-time prediction and application. However, the Gradient Boosting Trees model has the following obvious disadvantages when it is applied to power system fault prediction: it is easy to overfit, and the Gradient Boosting Trees model is prone to overfitting problems during data processing, and methods such as pruning are required Avoid overfitting; sensitive to data distribution, the model is highly sensitive to data distribution, if the data distribution is unbalanced, it may affect the prediction accuracy of the model; it is difficult to deal with continuous features, Gradient Boosting Trees model is difficult to deal with continuous features, Operations such as discretization are required, and some information may be lost during this process.
LSTM (Long Short Term Memory) is a Recurrent Neural Network (RNN) variant that can process and predict sequential data with long-term dependencies (Agga et al, 2022). This model has three advantages: first, long-term memory ability, LSTM can remember long-term dependencies by controlling the flow of information, which enables it to avoid the gradient disappearance problem of traditional RNN when processing long sequences. Second, the network structure is clear, and the network structure of this model is relatively simple, which can be easily trained and adjusted. Third, it has a wide range of applicability. LSTM can be used for processing and predicting various sequence data, such as speech recognition, natural language processing, time series prediction, etc.
However, the shortcomings of LSTM in power system fault prediction are also obvious, such as high data quality requirements, low model interpretability, long training time, and high computing resources. LSTM models require a large amount of high-quality data for training. In a power system environment, data quality may be affected by noise and missing values, which can affect the model’s predictive ability. Moreover, the internal structure of this model is relatively complex, and it is difficult to intuitively explain the prediction results of the model, which may reduce the trust of decision-makers in the model. In addition, the training of this model requires a long time and high computing resources, which will limit its use in practical applications.
The GA-CNN-BiGRU model proposed in this paper is applied to power system prediction. It can effectively predict power system faults and provide a safe and stable power system operation through preprocessing, feature extraction, sequence modeling, and classification of historical data. Strong guarantee.
First, historical power system fault data, including fault occurrence time, fault type, and fault duration, are input into the model, which enters the pre-processing data stage and performs operations such as cleaning, normalization, and feature extraction on these data for subsequent model training and prediction. Then, our model uses the GA algorithm to decompose the time series data to obtain the principal component feature information of the original data. This step aims to improve the performance and accuracy of the model for subsequent modeling. The time series data is then modeled and feature classified using CNN, and finally, the extracted feature data is fed into BiGRU to complete the model construction. Training is performed using historical data to optimize the parameters and loss functions of the model. After the model training is completed, the model can be used to make predictions about future situations and make intelligent prediction decisions. The algorithm can select the optimal prediction solution based on the prediction results and the real-time system state to maximize the reliability and safety of the power system. Also, during operation, the algorithm can update and adjust the data in real-time to adapt to the changing power system environment and state.
The GA-CNN-BiGRU model includes three parts: GA module, the CNN module, and the BiGRU module. The three parts complete the application to power system fault prediction through their advantages. The overall structure of the model is shown in Figure 1.

FIGURE 1. GA-CNN-BiGRU structural unit.
Our GA-CNN-BiGRU model is based on a convolutional neural network and a bidirectional gated recurrent unit, where the convolutional neural network is used for feature extraction, and the bidirectional gated recurrent unit is used for sequence modeling. The mathematical description of the model is as follows:
The output of the convolutional layer is Yconv, which is calculated as
where Wconv is the weight of the convolution kernel, bconv is the bias vector, * denotes the convolution operation, σ is the activation function, and X is the input feature image.
By inputting the output Yconv of the convolution layer into the bidirectional gated cyclic unit, the output of the forward cyclic unit is Yrnn_f and the output of the reverse cyclic unit is Yrnn_b:
where BiGRUf and BiGRUb denote the forward and reverse bi-directional gating loop units, respectively.
Finally, we stitch together the outputs of the forward and reverse cyclic units to obtain the final prediction:
We use the genetic algorithm to optimize the model’s hyperparameters, including the number of convolution kernels, recurrent units, the learning rate, the optimizer, and other parameters. The genetic algorithm’s objective function is the model’s classification accuracy.
Figure 2 shows the iterative curve of the loss function of the training set for the experiments in this paper.
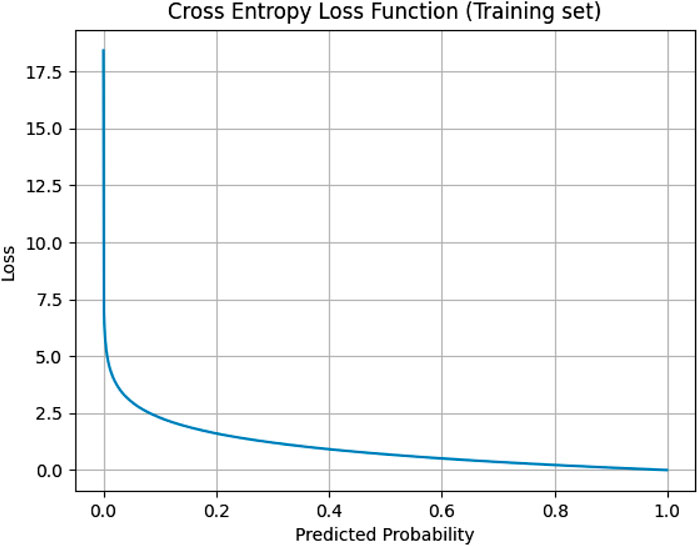
FIGURE 2. The iterative graph of the training set loss function.
Figure 3 shows the iterative curve of the loss function of the test set for the experiments in this paper.
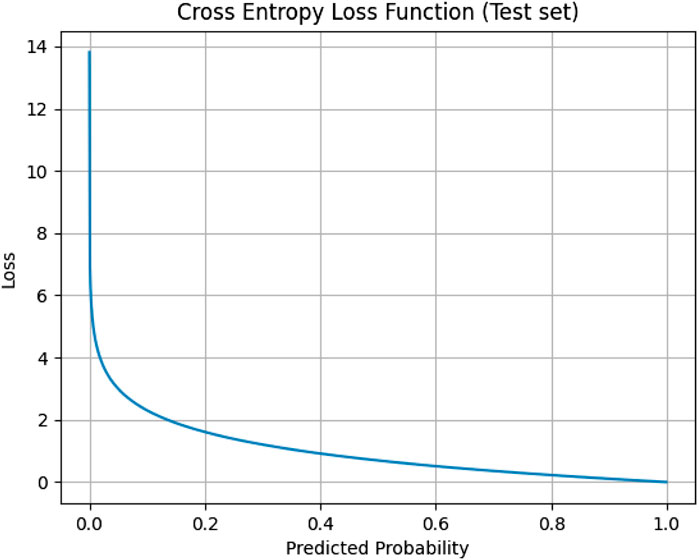
FIGURE 3. The iterative graph of the test set loss function.
The Algorithm 1 is the flowchart of the algorithm for the power system fault prediction model. First, different power system fault data are input, pre-processed, and normalized, and then the data set is input to the GA module for feature classification and output. The feature sequences are input to the CNN module for pooling classification. Finally, the optimal parameters of the model are obtained by BiGRU to improve the prediction accuracy and the final output of the prediction results.
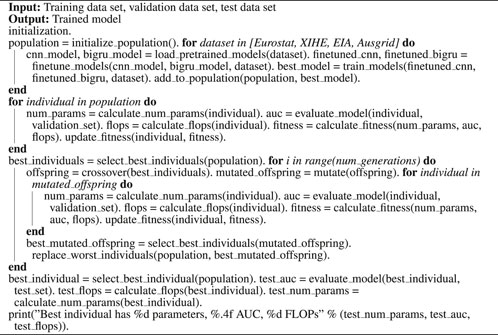
Algorithm 1. Training process of GA-CNN-BiGRU network.
GA (Genetic Algorithm) model is a search optimization algorithm based on the biological genetic evolution process. It searches and optimizes the problem space by simulating basic genetic operations such as natural selection, crossover, and mutation to find the optimal or near-optimal solution (Yuan et al, 2022). GA as a search optimization algorithm has the following advantages: first, it has the advantage of strong global search capability; the GA model has a global search capability, which can search the whole problem space in a short time and find the optimal global solution or near-optimal solution; second, the GA model has strong parallel processing capability, the search process of this model can be processed in parallel to make full use of computational resources and speed up the search speed; third, the model has strong robustness, the GA model can handle the noise and nonlinear relationships in the problem space, so it has strong robustness (Lu and Wu, 2022). In power system fault prediction, the GA model can be used to capture the spatiotemporal characteristics of the data to reflect the operation of the power system better to improve the prediction effect and provide a strong guarantee for the safe and stable operation of the power system; it can also be used to optimize the design of power system operation and reduce energy consumption and carbon emission, etc. In addition, the GA model can also be applied to load prediction, grid stability In addition, the GA model can be applied to load prediction, power grid stability analysis, power quality analysis, and other fields to provide a strong guarantee for the safe and stable operation of the power system. Its model structure diagram is shown in Figure 4.

FIGURE 4. GA structural unit.
Eq. 1 is the fitness function operation procedure in the genetic algorithm (GA).
where f(x) is the fitness value of the candidate solution x. m1(x), m2(x), …mn(x) are the evaluation metrics used to assess the quality of solution x. w1, w2, … wn are the weights assigned to each evaluation metric.
The CNN (Convolutional Neural Network) model is a deep learning model commonly used to process image and video data, also known as a convolutional neural networks (Thomas et al, 2023). It is mainly composed of a convolutional layer, a pooling layer, and a fully connected layer. It can automatically extract the features of image and video data by learning the parameters of the convolution kernel so as to realize image classification, object detection, speech recognition, and other tasks. As a commonly used deep learning model, CNN has the following advantages: First, the convolution kernel in the convolution layer can perform convolution operations on the entire image, thereby sharing parameters, which greatly reduces the number of parameters in the model and improves the performance of the model (Xu et al, 2022). Training efficiency and generalization ability; second, the convolution kernel in the convolutional layer only focuses on the local features of the input data, thereby improving the model’s perception of local changes and spatial relationships in the data; third, the CNN model through multi-layer Convolution and pooling operations can gradually extract feature representations of different levels of input data, thereby achieving multi-layer abstraction and improving the classification performance of the model.
Based on the characteristics of the power system, the inception model was selected. Inception is a CNN model developed by Google that aims to improve the efficiency of the network by using multiple convolutional kernel sizes and pooling sizes while reducing the number of model parameters. The model is designed to solve the problem of the number of parameters and computational complexity in deep convolutional neural networks.
The Inception model uses a modular structure called “Inception Module,” which consists of convolutional kernels of different sizes and pooling operations. This structure allows the network to capture features of different sizes simultaneously, thus improving the performance and efficiency of the model. In addition, the Inception model introduces a structure called the “Bottleneck Layer” that reduces the number of parameters in the model and increases the computational efficiency of the model. This structure reduces the number of channels in the input feature map by using a 1 × 1 convolutional layer, thus reducing the computational and storage overhead.
In helping power system fault prediction, CNN models can be used to classify and target detection of images of power equipment, to achieve real-time monitoring and scheduling of equipment status; CNN models can also be used to analyze power system tide data to evaluate the load situation and stability of the power system and make optimization suggestions. CNN models can also be applied to power market prediction and power quality analysis to help power systems predict and identify different operational information more accurately by automatically extracting data features to achieve the power system fault prediction goal. The diagram is shown in Figure 5. The process of CNN processing the input image is shown in Figures 6, 7; Figure 8.
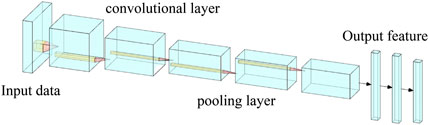
FIGURE 5. CNN structural unit.

FIGURE 6. CNN processing input image process.
FIGURE 7. CNN processing input image process.
FIGURE 8. CNN processing input image process.
This Formula 2 represents the convolution process of CNN.
In the Formula 2,
This Formula 3 is the pooling process of the CNN model
In the formula, plis the output after the pooling layer, Maxpool is the maximum pooling rule, and yl is the input of the pooling layer.
The BiGRU (Bidirectional Gated Recurrent Unit) model is a deep learning model based on a recurrent neural network (RNN). Tasks such as sequence labeling (Wang et al, 2022). As a deep learning model based on a recurrent neural network (RNN) (Satheesh et al, 2022), the BiGRU model has the following advantages: First, it can learn long-term dependencies. The RNN model can remember the previously input information through the memory unit, thereby learning long-term dependencies; the modeling effect for sequence data is better; second, it can realize two-way information flow, and the BiGRU model can learn the information of the front and rear directions in the input sequence at the same time through the GRU (Zhang et al, 2020) unit in the forward and backward directions, thereby improving The classification performance of the model is improved; thirdly, the number of parameters is small. Compared with other deep learning models, the number of parameters of the BiGRU model is less, and it can be trained on a smaller data set to avoid problems such as overfitting.
GRU (Gated Recurrent Unit) is a recurrent neural network (RNN) variant for processing sequential data. Compared with traditional RNNs, GRU introduces a gating mechanism to make it more effective in learning sequential data. The key to GRU is its two internal gating units: reset gate and update gate. The reset gate determines whether the information from the previous time step is retained in the current time step. In contrast, the update gate determines the effect of the information from the previous time step and the current input on the output in the current time step. These gating mechanisms allow GRU to handle long sequences better and capture long-range dependencies in time series. BiGRU has the following advantages over GRU: First, compared to the GRU model, the BiGRU model can process input sequences in both directions, enabling it to capture contextual information from past and future timestamps. Thus, it performs better than GRU in tasks that require a comprehensive understanding of the input sequence. Second, compared to the GRU model with better representation learning, BiGRU can learn a better representation of the input sequence by capturing both forward and backward dependencies, which can help the model better capture complex patterns in the data. In addition, BiGRU can improve accuracy. The bi-directional nature of BiGRU can enable accuracy improvements for various tasks such as speech recognition, natural language processing, and image captioning.
Thus, It is clear that BiGRU is a more powerful variant of GRU that can provide better performance in tasks requiring capturing complex dependencies in continuous data, so BiGRU is selected as part of our model in this paper.
In this research, the BiGRU model can be used to predict and model the fault data of the power system to achieve fault prediction and optimal scheduling of the power system; it can also be used to analyze and predict the power load data to achieve load scheduling and optimal management of the power system. In addition, the BiGRU model can also be applied in power market prediction and power quality analysis to help the power system predict and identify different operation information more accurately by learning the feature representation of sequence data to achieve the goal of power system fault prediction.
Its structure diagram is shown in Figure 9.
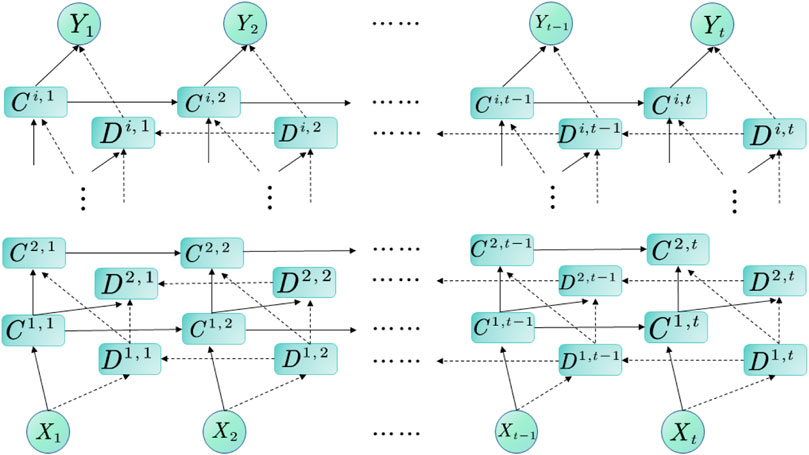
FIGURE 9. BiGRU structural unit.
Formulas 4–8 are the expression of multilayer BiGRU.
In the above formulas, ci,j is the j-th GRU neural network memory unit in the i-th layer of the forward sequence, di,j is the j-th GRU neural network memory unit in the i-th layer of the reverse sequence; t is the total number of neurons in the current layer,g(⋅) represents the activation function, usually using functions such as Sigmoid and ReLU.
In this paper, the data we use come from Eurostat, XIHE, EIA, and Ausgrid databases as the original data.
The Eurostat database is the official statistical database of the European Union, managed and maintained by the Statistical Office of the European Union (Eurostat) (Chen Q. et al, 2022).The database provides statistical data in various fields of the European Union, including economic, social, environmental, and sustainable development data, covering the 28 member states of the European Union and other European countries and regions. The database contains many data and indicators, covering statistics in various fields. These include data on national accounts, economic structure, employment, population, social security, environment, energy, transport, technology, and innovation. These data can be used to analyze and study the economic, social, and environmental conditions of the European Union and formulate related policies and strategies.
The Eurostat database provides various data query and analysis tools, including online query, data visualization, and data download functions. Users can use these tools to quickly query and analyze data to understand better the situation of various aspects of the European Union and formulate corresponding decisions and policies. In addition, the Eurostat database also provides a variety of research reports and analyses to help users better understand the economic, social, and environmental conditions of the European Union and formulate related policies and strategies. These reports and analyses cover various topics and areas, including sustainable development, environmental protection, economic growth, society, and employment.
Xihe Energy Big Data Platform Database is a powerful big data platform database developed by Xihe Energy Technology Co., Ltd. under the State Grid Corporation of China (Yuan et al, 2023). It aims to provide comprehensive, accurate, and real-time data support for the energy industry to help users better Accurately understand the operation and trends of the electricity market to optimize energy management and decision-making. The database contains rich data resources, including power market data, equipment data, energy consumption data, etc. The database ensures the data’s accuracy, completeness, and reliability through multiple links such as data collection, cleaning, storage, and management.
Users can conduct data queries, statistical analyses, and visual displays through the Xihe Energy Big Data Platform database to better understand the operation and trend of the power market and make corresponding management and decision-making. The database also provides various data mining and analysis tools, such as machine learning, artificial intelligence, big data analysis, etc., to help users quickly discover associations and regularities in the data and provide corresponding prediction and decision support. In addition to providing database services, Xihe Energy Big Data Platform also provides customizable data reports and data services to meet the needs of different users. In addition, the platform also includes a series of API interfaces, which can be easily integrated with other systems.
The U.S. Energy Information Administration (Energy Information Administration, EIA) is an independent statistical and analytical agency under the U.S. Department of Energy (Yoon and Yoon, 2022). Its main task is to collect, analyze and publish data and information on energy production and consumption, energy prices, energy policies, and environmental impacts to support policy formulation, business decision-making, and academic research.
EIA’s data and information cover multiple energy sectors, including oil, natural gas, coal, nuclear, and renewable energy. It provides a variety of reports, databases, tools, and analyses to government agencies, academic institutions, businesses, and the general public to facilitate an in-depth understanding and analysis of energy markets and policies. EIA provides the public with easy-to-understand and uses energy data and information through its website, reports, press releases, social media, and other channels.
EIA’s data and information are significant to U.S. and global energy policymaking, market forecasts, and investment decisions. At the same time, it also provides opportunities for academics, researchers, and the public to gain an in-depth understanding and analysis of global energy markets and environmental impacts.
The Ausgrid database is the database of Ausgrid, an Australian electricity supplier, used to manage and maintain its electricity network (Shakiba et al, 2022). Ausgrid is one of Australia’s largest electricity providers, providing electricity services to most New South Wales, including central Sydney and surrounding areas.
The Ausgrid database contains a large amount of power network data, including the location, capacity, status, and other information of power lines, substations, distribution stations, and other facilities, as well as the operation data of power equipment. These data can be used for the planning, maintenance, and optimization of the power network and the operation monitoring and troubleshooting of power equipment. Among other things, the database includes a range of applications and tools to help Ausgrid’s engineers, technicians, and managers better manage and maintain the electricity network. These applications and tools include power network simulation, power equipment monitoring, maintenance, planning, etc., which can help Ausgrid improve the power supply’s reliability, efficiency, and safety.
We use the cross-entropy loss function to measure the difference between the model predictions and the true labels, which is calculated as
where N denotes the number of samples, C denotes the number of categories,
We use the Adam optimization algorithm to update the model parameters with the following update formula.
where θt denotes the model parameters of the tth epoch element, η denotes the learning rate, and ϵ is a very small constant to prevent division errors.
Where mt and vt denote the first-order moment estimate and second-order moment estimate of the gradient, respectively, and β1 and β2 are the decay coefficients used to compute the first-order moment and second-order moment estimates, respectively.
We also use an early stopping technique to prevent overfitting and calculate the loss values for the training and validation sets at the end of each epoch. Specifically, if the loss value of the validation set does not decrease for k consecutive epochs, training is stopped. Finally, we use the test set to evaluate the model’s performance and compute various evaluation metrics.
Here use four databases as raw data, the following is our database Table 1.

TABLE 1. Selected dataset data.
We used four different datasets, including Eurostat, XIHE, EIA, and Ausgrid. Each dataset contains a different number of samples which contains about 100,000 samples. Types of power system faults considered: We considered different types of faults, including voltage fluctuations, line faults, transformer faults, etc. Training-validation-test partition: we divided the dataset into training, validation, and test sets. Among them, the training set accounts for 70% of the total data set, the validation set accounts for 15%, and the test set accounts for 15%. Number of epochs: Our model was trained with 100 epochs. Batch size: We used a batch size of 128 for training. Learning rate: Our learning rate was set to 0.001. Optimizer: We used the Adam optimizer. Experimental setup and methodology: Our study used a GA-CNN-BiGRU model for power system fault prediction. We optimized the model parameters by genetic algorithm, used a convolutional neural network (CNN) for feature extraction, and combined them with the bi-directional gated recurrent unit (BiGRU) for sequence modeling. We also employ techniques such as cross-validation and early stopping to improve the model’s generalization ability and prevent overfitting. Meanwhile, we use various evaluation metrics, including accuracy, precision, recall, F1 score, AUC, and ROC curve, to evaluate our model performance.
This study chose a variety of models to verify their applicability to power system fault prediction and their potential to lead to better applications. A series of experiments were designed to validate the models, focusing on metrics such as Flops, inference time, accuracy, parameters, mAP, and AUC. In the first step of the study, four datasets were preprocessed including Eurostat, XIHE, EIA, and Ausgrid, which involved data cleaning and feature extraction. In the second step, the GA-CNN-BiGRU model was designed and trained while adjusting the model’s hyperparameters such as learning rate, batch size, optimizer, etc., in accordance with the experimental requirements and data features to improve the training effect of the model. Based on the experimental results, the performance of the selected model was found to vary in the face of different datasets and data volumes. However, the model developed in this study was the least affected and outperformed other groups of models. To identify the key role played by each part of the model, ablation experiments were designed, and the CNN module in their fusion model was found to have the greatest impact on the overall model. The conclusions of several sets of experiments demonstrate that the model developed in this study can be well applied in the field of power system fault prediction, accurately identifying and classifying different power system operation states, predicting power system faults, optimizing power system scheduling and management, and helping power systems achieve fault prediction and optimal operation.
Figure 10 compares the selected models based on their Flops. FLOPs represent the number of floating-point operations required by a model during inference and are usually used to evaluate the computational efficiency of the model. Based on the experimental results, it was found that the performance of each model varied depending on the dataset used. However, the impact of this variation was minimal. It was observed that our model required fewer Flops compared to the models selected by other groups. In practical scenarios, fewer FLOPs imply that the model reasoning tasks can be completed faster, allowing more data to be processed within a shorter time. This is particularly crucial for tasks that require high real-time performance, making our model suitable for power system fault prediction applications.
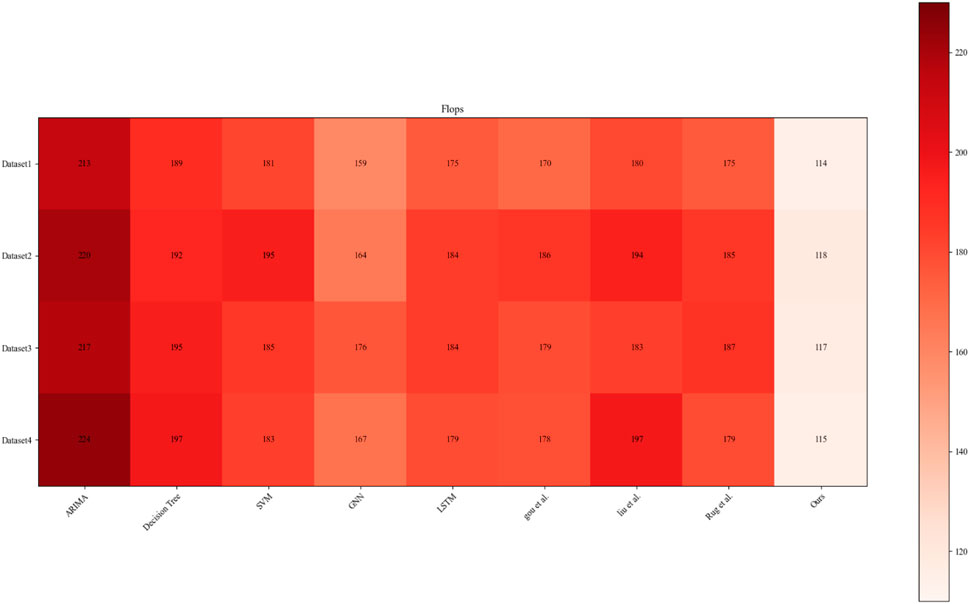
FIGURE 10. Flops comparison experiment results chart required for each model operation.
Figure 11 compares the number of parameters required for each model to run. Parameters refer to the number of parameters that must be learned in the neural network model and are typically used to evaluate the complexity and storage requirements of the model. It was observed that different datasets required different parameters for each model, resulting in a significant impact. Although Decision Tree and SVM exhibited better performance, our model required the least number of parameters when dealing with different datasets. Furthermore, the number of parameters required by our model did not vary significantly across the datasets. Hence, our model outperformed other models in terms of the number of parameters. Fewer parameters indicate a smaller model size, which can be trained and reasoned more quickly while requiring less storage space. Therefore, our model can be better applied to power system fault prediction.
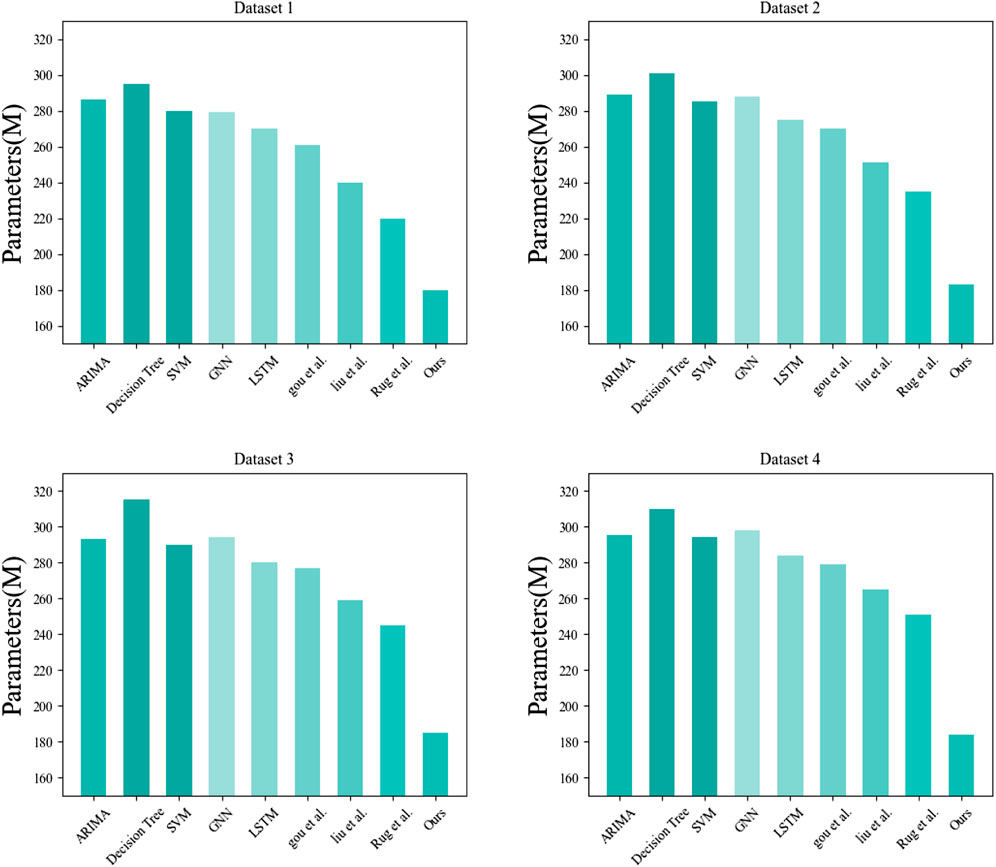
FIGURE 11. Comparison of the experimental results of the parameters required for each model operation.
Figure 12 compares the accuracy of each model. Accuracy refers to the proportion of samples correctly predicted by the model on a given data set and is typically used to evaluate the model’s accuracy. The results show that the performance of the Decision Tree model is the worst and is significantly affected by the dataset used. However, our model exhibits the most stable and highest accuracy across different datasets. Higher accuracy indicates that the model can perform tasks more accurately, which also implies that our model has reliable performance in practical application scenarios.
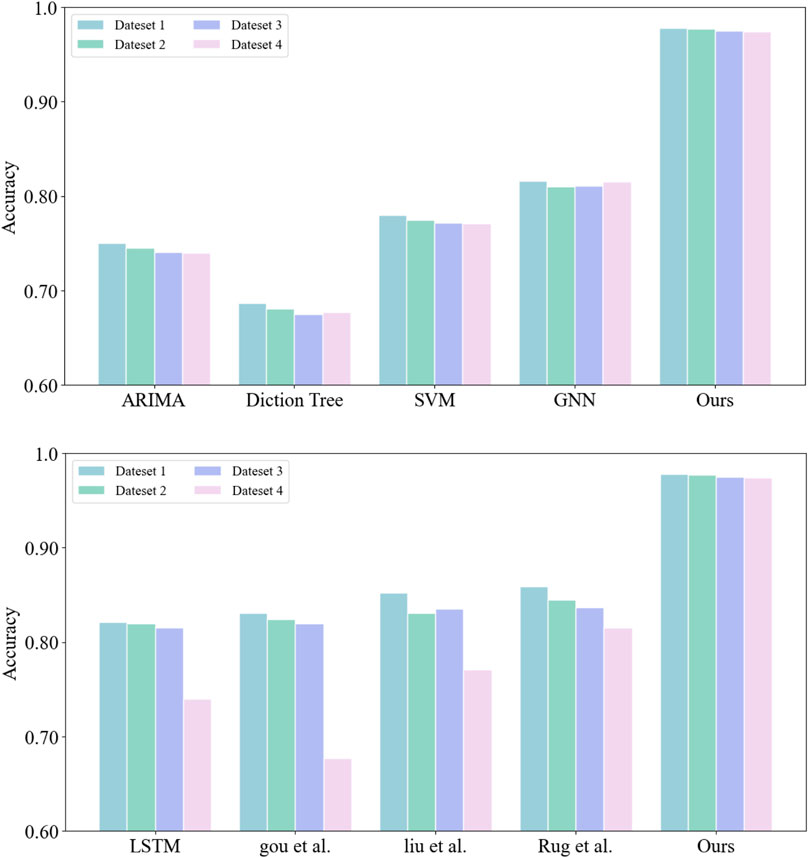
FIGURE 12. Accuracy comparison chart of each model.
Figure 13 compares the inference time indicators of each model. Inference time refers to the time required by the model for inference and is typically used to evaluate the computational efficiency of the model. It was observed that our model had the lowest inference time compared to other models when facing different datasets. Reducing inference time can improve the model’s computational efficiency, response speed, and user experience, resulting in better performance and higher user satisfaction in practical applications.
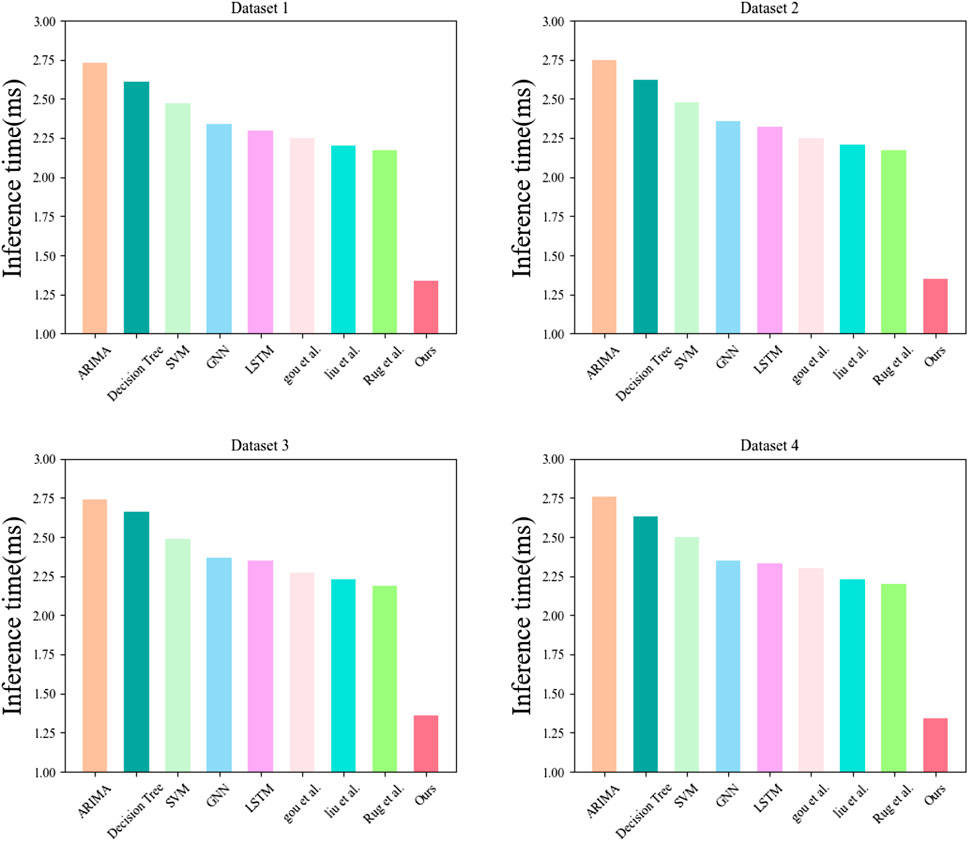
FIGURE 13. Comparison chart of inference time of each model.
Figure 14 compares the AUC and mAP performance of each model across different datasets. The selected models were found to be affected by changes in the dataset to a certain extent. However, our model exhibited excellent and stable performance with the highest AUC and mAP. Higher AUC and mAP indicate better performance in classification tasks. Therefore, our model can be better applied to power system fault prediction.
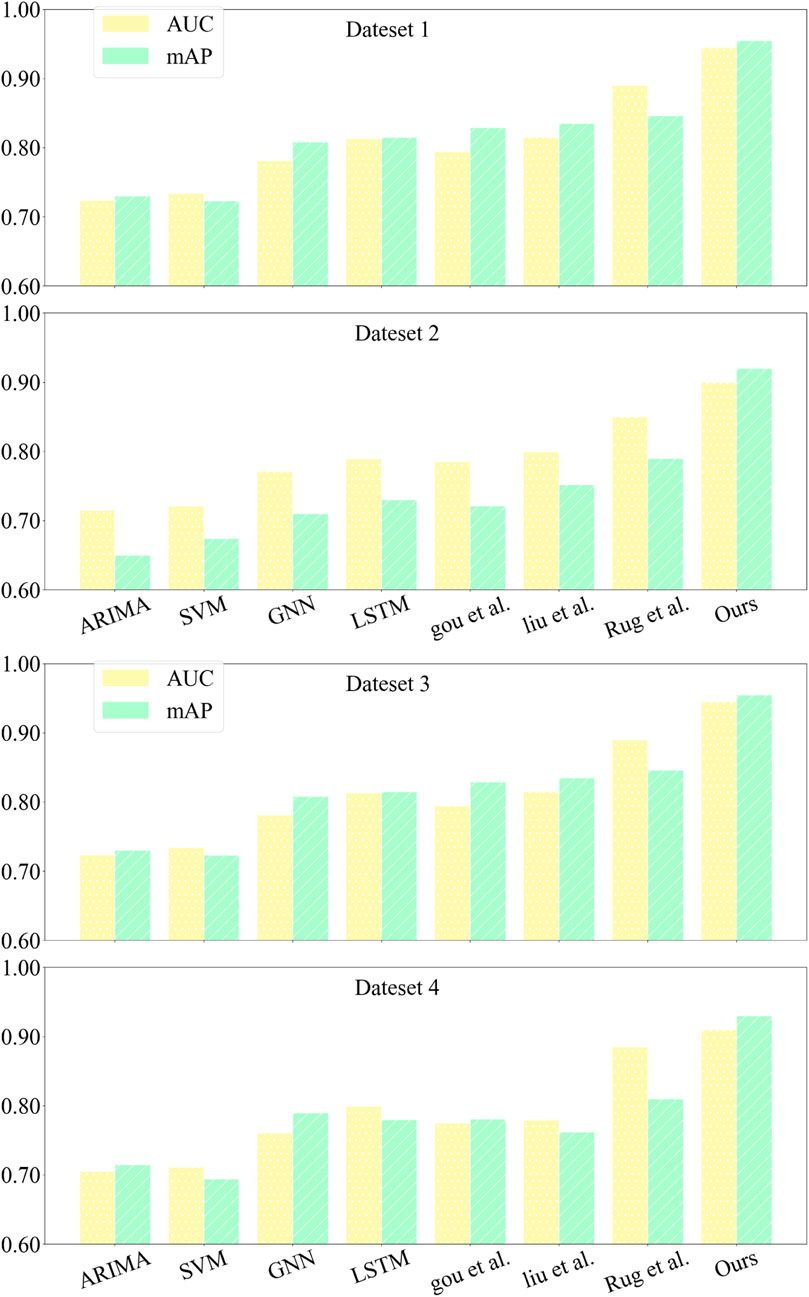
FIGURE 14. Comparison chart of AUC and mAP experimental results of each model.
To identify the most important part of our model, ablation experiments for recall, precision, and other indicators were designed. Figure 15 shows the recall comparison test of each model, Figure 16 shows the precision comparison test of each model, and Figure 17 presents the experimental results of other indicators. In these experiments, GA-CNN, GA-BiGRU, CNN-BiGRU, and our model were compared and tested to determine which part was the most important. The results of the recall and precision experiments showed significant differences between the models with and without the CNN module, indicating that the CNN module played the most significant role in our model. The CNN module’s primary function is to extract and classify input data, and it has excellent feature extraction ability and versatility. Therefore, we used the CNN model to adjust the network structure and parameters to adapt to different tasks and datasets, improving power system fault prediction. The results of our ablation experiments are presented in Table 2.
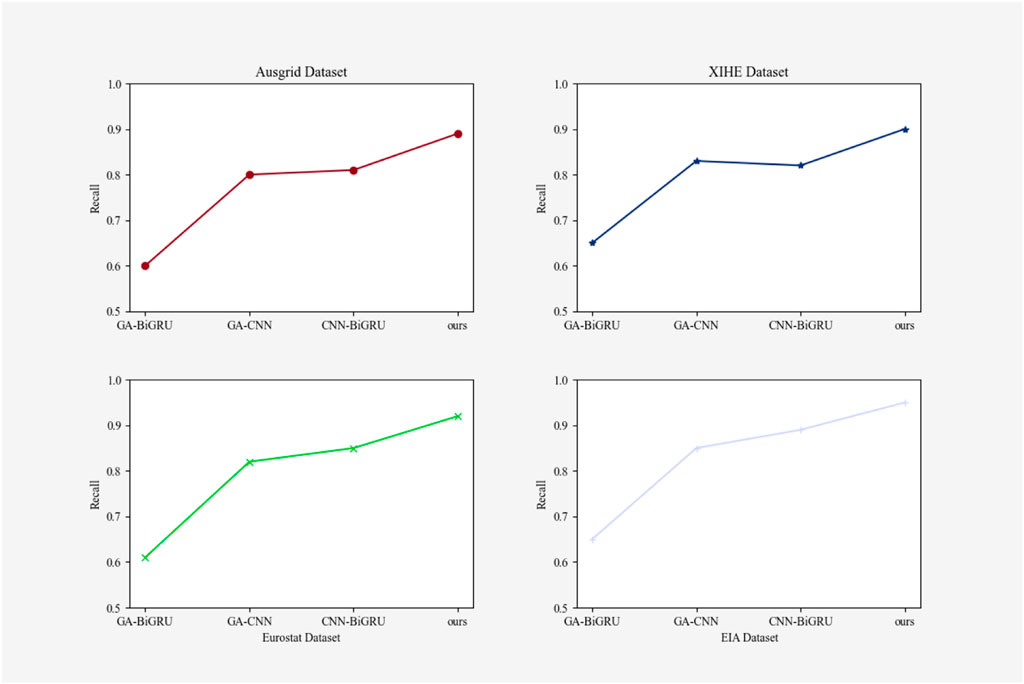
FIGURE 15. Ablation experiment Recall indicator result graph.
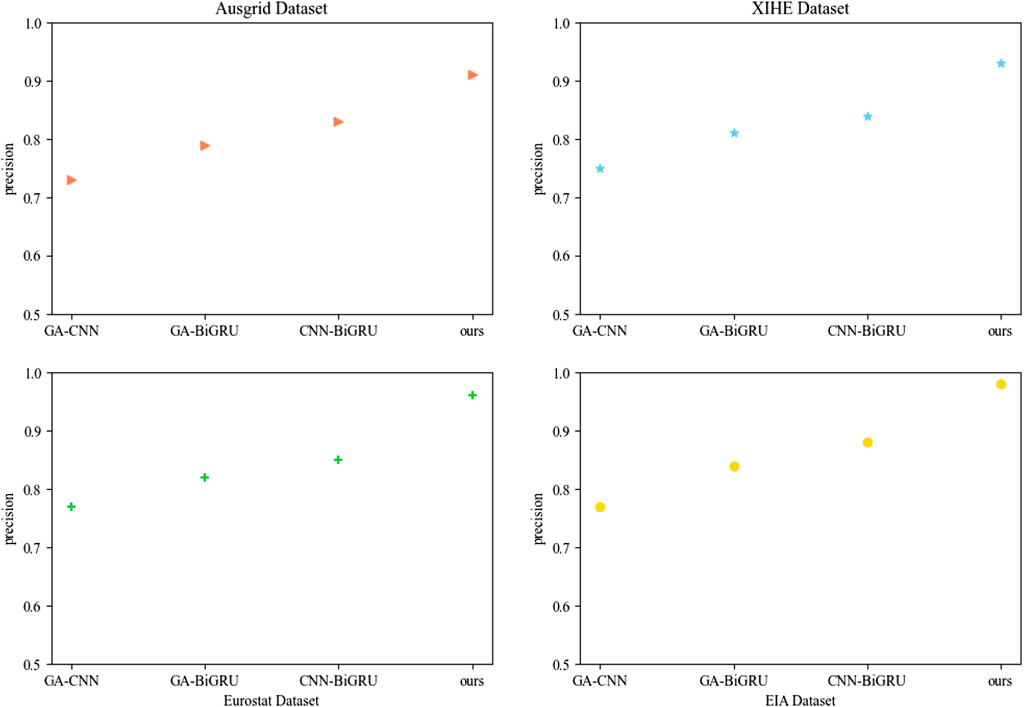
FIGURE 16. Precision indicator result graph of ablation experiment.
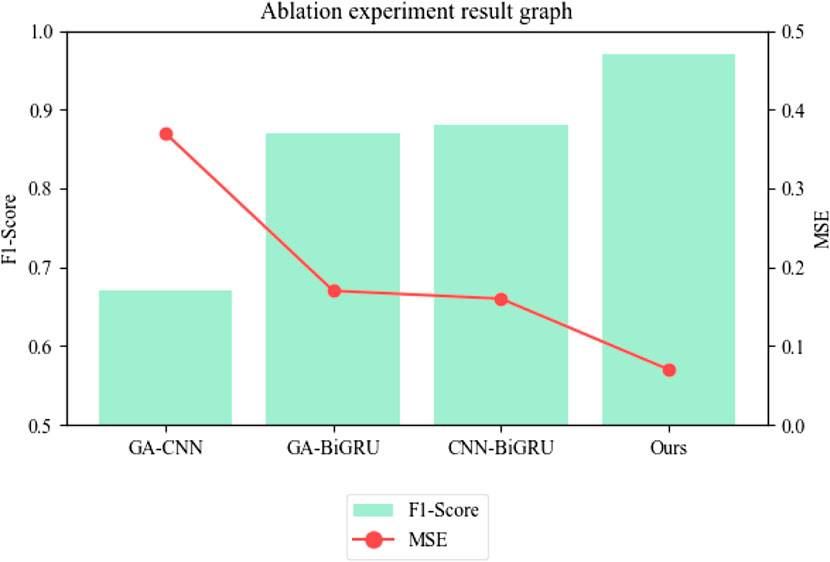
FIGURE 17. Ablation experiment F1-score and MSE index result graph.
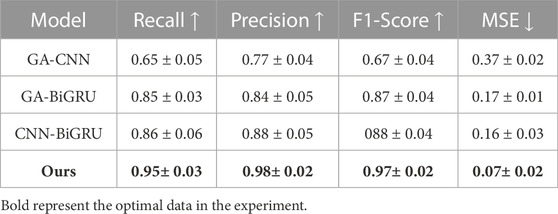
TABLE 2. Ablation experiment comparison experiment data result graph.
This is the general data table of our experiments. In Table 3, we have selected several important metrics and the best data values for each group of models to visualize the results of our experiments.
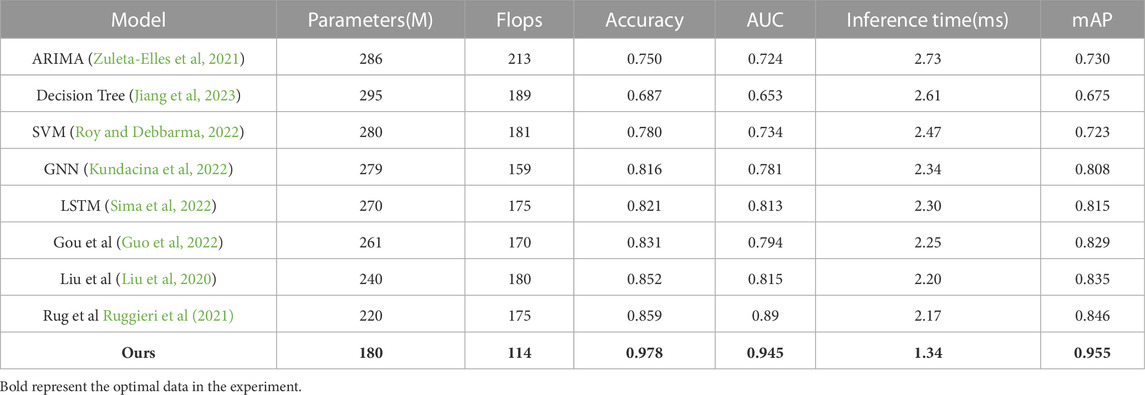
TABLE 3. Summary chart of experimental results.
This study propose a model combining a genetic algorithm (GA), convolutional neural network (CNN), and bi-directional gated recurrent unit (BiGRU) for solving the power system fault prediction problem. Using a dataset containing a large amount of power load, voltage, current, and environment data, we trained and tested the model and compared it with traditional machine learning models and other deep learning models.
The experimental results show that our proposed GA-CNN-BiGRU model performs well on the power system fault prediction problem. Our model significantly improves prediction accuracy and generalization ability compared to traditional machine learning models. Compared with other deep learning models, our model performs better when dealing with time series data and has better feature extraction and classification capabilities. Therefore, our model can effectively solve the power system fault prediction problem. These results provide important references and guidance for further exploration and optimization of power system fault prediction solutions.
It should be noted that although the GA-CNN-BiGRU model proposed in this paper has achieved good results in sequence data processing, it also has the disadvantages of very long training time, which requires a large number of computational resources and time for training as well as poor interpretation, which makes it difficult to understand and explain its internal operation mechanism, so further optimization and improvement are still needed in practical applications. For example, more data and complex models can improve the model’s performance. In addition, the quality and availability of data and the interpretability and reliability of the model in practical applications need to be considered.
The study of power system fault prediction is of great significance to ensuring power systems’ safe and stable operation. With the power systems’ increasing scale and cocomplexityprethe diction has become an important topic for power system management and operation. By studying power system fault prediction, we can improve the reliability and stability of the power system, reduce fault loss and guarantee the continuity and safety of the power supply. Specifically, the study of power system fault prediction can bring the following implications:
• The power system fault prediction can guarantee the safe and stable operation of the power system. The electric power system is a vital infrastructure of modern society, and its safe and stable operation is crucial to social and economic development and people’s life. The study of power system fault prediction can help power system managers discover potential fault risks earlier and take corresponding measures to prevent or reduce the possibility of faults to guarantee the safe and stable operation of the power system.
• The research can improve the reliability and stability of the power system. The reliability and stability of the power system is a key factor for the power supply. By studying power system fault prediction, the reliability and stability of the power system can be improved, the impact caused by faults can be reduced, and the quality and efficiency of the power supply can be improved.
• Reduce fault losses. Power system failure may cause huge losses to society and the economy. By studying power system fault prediction, potential fault risks can be detected earlier, and corresponding measures can be taken to prevent or reduce the possibility of faults and reduce the losses caused by faults.
• To promote the development of the intelligence and automation of the power system. The research of power system fault prediction requires the use of a large amount of data and advanced technical means, which can promote the development of the intelligence and automation of the power system and improve management and operation efficiency.
• To promote the development of energy saving, emission reduction, and environmental protection of the power system. The study of power system fault prediction can help power system managers better understand the operation condition and fault situation of the power system to take more effective measures to guarantee the safe and stable operation of the power system and promote the development of energy conservation, emission reduction and environmental protection of the power system.
The original contributions presented in the study are included in the article/Supplementary material, further inquiries can be directed to the corresponding author.
DZ and PS contributed to conception and formal analysis of the studey. DZ and XJ contributed to investigation, resources, and data curation. DZ wrote the original draft of the manuscript. DZ and PS performed the visualization and project administration, XJ provied the funding acquisition. All authors contributed to the article and approved the submitted version.
The research is funded partially by Excellent Young Talents Support Program of Anhui Universities (gxyq2021233), Key Science Research Project of Industry-University Research (BYC2021Z01), Teaching Quality Engineering of Anhui Province (2021xsxxkc181, 2019sxzx24), and Teaching Demonstration Course Project of Anhui Province (2020jxsfk002), Key Science Research Project of Anhui Universities (2022AH052413), Scientific and technological innovation team project (BKJCX202202).
The authors declare that the research was conducted in the absence of any commercial or financial relationships that could be construed as a potential conflict of interest.
All claims expressed in this article are solely those of the authors and do not necessarily represent those of their affiliated organizations, or those of the publisher, the editors and the reviewers. Any product that may be evaluated in this article, or claim that may be made by its manufacturer, is not guaranteed or endorsed by the publisher.
Agga, A., Abbou, A., Labbadi, M., El Houm, Y., and Ali, I. H. O. (2022). Cnn-lstm: An efficient hybrid deep learning architecture for predicting short-term photovoltaic power production. Electr. Power Syst. Res. 208, 107908. doi:10.1016/j.epsr.2022.107908
Bai, M., Yang, X., Liu, J., Liu, J., and Yu, D. (2021). Convolutional neural network-based deep transfer learning for fault detection of gas turbine combustion chambers. Appl. Energy 302, 117509. doi:10.1016/j.apenergy.2021.117509
Chen, Q., Li, Q., Wu, J., Mao, C., Peng, G., and Wang, D. (2022a). Application of knowledge graph in power system fault diagnosis and disposal: A critical review and perspectives. Front. Energy Res. 10, 988280. doi:10.3389/fenrg.2022.988280
Chen, X., Long, S., He, L., Wang, C., Chai, F., Kong, X., et al. (2022b). Performance evaluation on thermodynamics-economy-environment of pemfc vehicle power system under dynamic condition. Energy Convers. Manag. 269, 116082. doi:10.1016/j.enconman.2022.116082
Cheng, L., Chen, Y., and Liu, G. (2022a). 2pns-eg: A general two-population n-strategy evolutionary game for strategic long-term bidding in a deregulated market under different market clearing mechanisms. Int. J. Electr. Power & Energy Syst. 142, 108182. doi:10.1016/j.ijepes.2022.108182
Cheng, L., Liu, G., Huang, H., Wang, X., Chen, Y., Zhang, J., et al. (2020). Equilibrium analysis of general n-population multi-strategy games for generation-side long-term bidding: An evolutionary game perspective. J. Clean. Prod. 276, 124123. doi:10.1016/j.jclepro.2020.124123
Cheng, L., Yin, L., Wang, J., Shen, T., Chen, Y., Liu, G., et al. (2021). Behavioral decision-making in power demand-side response management: A multi-population evolutionary game dynamics perspective. Int. J. Electr. Power & Energy Syst. 129, 106743. doi:10.1016/j.ijepes.2020.106743
Cheng, L., and Yu, T. (2019). A new generation of ai: A review and perspective on machine learning technologies applied to smart energy and electric power systems. Int. J. Energy Res. 43, 1928–1973. doi:10.1002/er.4333
Cheng, Y., Yu, N., Foggo, B., and Yamashita, K. (2022b). Online power system event detection via bidirectional generative adversarial networks. IEEE Trans. Power Syst. 37, 4807–4818. doi:10.1109/tpwrs.2022.3153591
Du, Z., Chen, K., Chen, S., He, J., Zhu, X., and Jin, X. (2023). Deep learning gan-based data generation and fault diagnosis in the data center hvac system. Energy Build. 289, 113072. doi:10.1016/j.enbuild.2023.113072
Guo, Q., Wang, Y., and Dong, X. (2022). Effects of smart city construction on energy saving and co2 emission reduction: Evidence from China. Appl. Energy 313, 118879. doi:10.1016/j.apenergy.2022.118879
Hassani, H., Razavi-Far, R., and Saif, M. (2022). Real-time out-of-step prediction control to prevent emerging blackouts in power systems: A reinforcement learning approach. Appl. Energy 314, 118861. doi:10.1016/j.apenergy.2022.118861
Jiang, J., Huang, M., Ling, H., and Wang, D. (2023). Power system stability margin prediction based on gradient lifting decision tree. J. Phys. Conf. Ser. (IOP Publ. 2495, 012016. doi:10.1088/1742-6596/2495/1/012016
Kundacina, O., Cosovic, M., and Vukobratovic, D. (2022). State estimation in electric power systems leveraging graph neural networks. Available at: https://arxiv.org/abs/0704.4001 (arXiv preprint arXiv:2201.04056).
Liu, Z., Hu, B., Huang, B., Lang, L., Guo, H., and Zhao, Y. (2020). Decision optimization of low-carbon dual-channel supply chain of auto parts based on smart city architecture. Complexity 2020, 1–14. doi:10.1155/2020/2145951
Lu, K.-D., and Wu, Z.-G. (2022). Genetic algorithm-based cumulative sum method for jamming attack detection of cyber-physical power systems. IEEE Trans. Instrum. Meas. 71, 1–10. doi:10.1109/tim.2022.3186360
Lv, J. (2022). Transient stability assessment in large-scale power systems using sparse logistic classifiers. Int. J. Electr. Power & Energy Syst. 136, 107626. doi:10.1016/j.ijepes.2021.107626
Mitrentsis, G., and Lens, H. (2022). An interpretable probabilistic model for short-term solar power forecasting using natural gradient boosting. Appl. Energy 309, 118473. doi:10.1016/j.apenergy.2021.118473
Rizeakos, V., Bachoumis, A., Andriopoulos, N., Birbas, M., and Birbas, A. (2023). Deep learning-based application for fault location identification and type classification in active distribution grids. Appl. Energy 338, 120932. doi:10.1016/j.apenergy.2023.120932
Roy, S. D., and Debbarma, S. (2022). A novel oc-svm based ensemble learning framework for attack detection in agc loop of power systems. Electr. Power Syst. Res. 202, 107625. doi:10.1016/j.epsr.2021.107625
Ruggieri, R., Ruggeri, M., Vinci, G., and Poponi, S. (2021). Electric mobility in a smart city: European overview. Energies 14, 315. doi:10.3390/en14020315
Satheesh, R., Chakkungal, N., Rajan, S., Madhavan, M., and Alhelou, H. H. (2022). Identification of oscillatory modes in power system using deep learning approach. IEEE Access 10, 16556–16565. doi:10.1109/access.2022.3149472
Shakiba, F. M., Shojaee, M., Azizi, S. M., and Zhou, M. (2022). Real-time sensing and fault diagnosis for transmission lines. Int. J. Netw. Dyn. Intell., 36–47. doi:10.53941/ijndi0101004
Sima, W., Zhang, H., Yang, M., and Li, X. (2022). Diagnosis of small-sample measured electromagnetic transients in power system using drn-lstm and data augmentation. Int. J. Electr. Power & Energy Syst. 137, 107820. doi:10.1016/j.ijepes.2021.107820
Sun, J., Mihret, M., Cespedes, M., Wong, D., and Kauffman, M. (2022). Data center power system stability—Part ii: System modeling and analysis. CSEE J. Power Energy Syst. 8, 420–438. doi:10.17775/CSEEJPES.2021.02020
Thomas, J. B., Chaudhari, S. G., Shihabudheen, K., and Verma, N. K. (2023). Cnn based transformer model for fault detection in power system networks. IEEE Trans. Instrum. Meas. 72, 1–10. doi:10.1109/tim.2023.3238059
Wang, Z., Li, H., Liu, Y., and Wu, S. (2022). An improved deep learning algorithm in enabling load data classification for power system. Front. Energy Res. 10, 988183. doi:10.3389/fenrg.2022.988183
Xu, X., Sun, J., Wang, C., and Zou, B. (2022). A novel hybrid cnn-lstm compensation model against dos attacks in power system state estimation. Neural Process. Lett. 54, 1597–1621. doi:10.1007/s11063-021-10696-3
Yoon, D.-H., and Yoon, J. (2022). Deep learning-based method for the robust and efficient fault diagnosis in the electric power system. IEEE Access 10, 44660–44668. doi:10.1109/access.2022.3170685
Yuan, H.-B., Zou, W.-J., Jung, S., and Kim, Y.-B. (2022). Optimized rule-based energy management for a polymer electrolyte membrane fuel cell/battery hybrid power system using a genetic algorithm. Int. J. Hydrogen Energy 47, 7932–7948. doi:10.1016/j.ijhydene.2021.12.121
Yuan, Z., Xiong, G., Fu, X., and Mohamed, A. W. (2023). Improving fault tolerance in diagnosing power system failures with optimal hierarchical extreme learning machine. Reliab. Eng. Syst. Saf. 236, 109300. doi:10.1016/j.ress.2023.109300
Zhang, F., Liu, Q., Liu, Y., Tong, N., Chen, S., and Zhang, C. (2020). Novel fault location method for power systems based on attention mechanism and double structure gru neural network. IEEE Access 8, 75237–75248. doi:10.1109/access.2020.2988909
Zuleta-Elles, I., Bautista-Lopez, A., Cataño-Valderrama, M. J., Marín, L. G., Jiménez-Estévez, G., and Mendoza-Araya, P. (2021). “Load forecasting for different prediction horizons using ann and arima models,” in 2021 IEEE CHILEAN Conference on Electrical, Electronics Engineering, Information and Communication Technologies (CHILECON), Valparaiso, Chile, 6-9 December 2021 (IEEE), 1–7.
Keywords: GA, CNN, BiGRU, power system, fault prediction
Citation: Zhang D, Jin X and Shi P (2023) Research on power system fault prediction based on GA-CNN-BiGRU. Front. Energy Res. 11:1245495. doi: 10.3389/fenrg.2023.1245495
Received: 23 June 2023; Accepted: 13 July 2023;
Published: 04 August 2023.
Edited by:
Praveen Kumar Donta, Vienna University of Technology, AustriaReviewed by:
Lefeng Cheng, Guangzhou University, ChinaCopyright © 2023 Zhang, Jin and Shi. This is an open-access article distributed under the terms of the Creative Commons Attribution License (CC BY). The use, distribution or reproduction in other forums is permitted, provided the original author(s) and the copyright owner(s) are credited and that the original publication in this journal is cited, in accordance with accepted academic practice. No use, distribution or reproduction is permitted which does not comply with these terms.
*Correspondence: Xinxin Jin, amlueGlueGluQHN0dWRlbnQudXNtLm15
Disclaimer: All claims expressed in this article are solely those of the authors and do not necessarily represent those of their affiliated organizations, or those of the publisher, the editors and the reviewers. Any product that may be evaluated in this article or claim that may be made by its manufacturer is not guaranteed or endorsed by the publisher.
Research integrity at Frontiers
Learn more about the work of our research integrity team to safeguard the quality of each article we publish.