 Junjian Wu1
 Wei Liu
95% of researchers rate our articles as excellent or good
Learn more about the work of our research integrity team to safeguard the quality of each article we publish.
Find out more
ORIGINAL RESEARCH article
Front. Energy Res. , 21 September 2023
Sec. Process and Energy Systems Engineering
Volume 11 - 2023 | https://doi.org/10.3389/fenrg.2023.1240764
This article is part of the Research Topic Advances in Flexibility Exploration and Utilization for Low Carbon Power Systems View all 6 articles
The daily output of wind power is inversely proportional to the load demand in most situations, which will lead to an increase in peak-to-valley difference and fluctuation. To solve this problem, this study proposes a long short-term memory prediction–correction-based multi-timescale optimal control strategy for energy storage. First, the proposed strategy performs a long short-term memory (LSTM) prediction on the power of wind power and load. Then, it establishes a predictive planning model to improve the effect of peak shaving and the operating income of energy storage. Finally, it uses the method of online correction of power lines for peak shaving to further optimize the energy storage power according to the error between the residual energy of energy storage and the planned residual energy in the actual peak shaving process. By comparing with traditional strategies, the proposed strategy is found to be significantly better than the constant power strategy and the power difference strategy in the peak shaving effect and operating income.
In light of China’s ongoing modernization process, energy has been a major concern. In the current scenario, new energy sources have experienced substantial growth, characterized by their unpredictable and volatile output patterns. As the penetration rate of new energy increases, the influence of wind power further exacerbates the difference between peak and off-peak periods in the system net load. Consequently, numerous scholars have conducted research on the accurate prediction of renewable energy output characteristics and implementing effective peak-cutting and valley-filling strategies.
The use of energy storage for peak shaving is one of the current research hotspots at home and abroad. Li et al. (2022) proposed a distributed battery energy storage station optimal scheduling model that considers the movement of peak loads, which can enhance the voltage distribution of the distribution network. Wei et al. (2022) proposed an economic optimization method for depth peak regulation and the depth of the emergency of the energy storage (ES) accident on the demand side. Engels et al. (2020) proposed a peak shaving strategy for coordinated control of multiple batteries with the goal of net profit. Shiwei et al. (2020) established a flexible resource optimization allocation model aiming at economic optimization. This model combines the transformation of thermal power units, energy storage, and the characteristics of the load-side demand response. Guo et al. (2021) proposed a comprehensive collaborative optimization framework to schedule distributed power sources and batteries for peak shaving with the goal of minimizing operating costs. Energy storage plays a vital role in enhancing grid flexibility and maintaining a balance between the supply and demand. The ability to anticipate and fulfill peaks and troughs in demand by adjusting generation levels in a timely manner is crucial. With the growing utilization of intermittent wind and solar electricity, higher capacities of energy storage are necessary to ensure grid flexibility, grid stability, and effective management of the intermittent nature of these energy sources (Górski, 2022; Menniti et al., 2022).
On the other hand, relevant researchers have proposed using dynamic programming or optimization algorithms to find the optimal solution for the energy storage output (Ahmed et al., 2022; Zhang et al., 2020; Dayarathna et al., 2022; Colonetti et al., 2023), relying on the predicted net load to formulate the output plan of the energy storage for the next day (Riffonneau et al., 2011; Rowe et al., 2014; Jing et al., 2015; Kodaira et al., 2020). Hwang et al. (2020) carried out load prediction based on deep learning and formulated an optimal control strategy for peak shaving based on cost minimization. Zheng et al. (2018) proposed a two-layer scheduling strategy based on prediction and correction, aiming at improving profits to peak shaving. Bennett et al. (2015) proposed an online control algorithm based on load prediction to reduce the impact of prediction error.
The majority of existing literature predominantly emphasizes only one of the impact of prediction error, the effect of peak shaving or the economic benefits. In this paper, we aim to fill this gap by considering multiple factors to provide a more comprehensive analysis. Thus, it effectively enhances the efficacy of peak shaving and increases the operating income of lithium batteries.
According to the aforementioned discussions, the main contributions of this study can be summarized as follows:
• By employing LSTM forecast planning and an online correction optimization control strategy, we forecast wind power and load data, ultimately obtaining the predicted net load data.
• Proposal of the predictive planning model, which considers the peak shaving effect and energy storage operation income as a goal.
• Proposal of the strategy for online correction of the peak shaving power line, according to the error between the residual energy of energy storage and the planned residual energy in the actual peak shaving process.
• The proposed strategy significantly enhances the effect of peak cutting and increases the operating earnings of the lithium battery.
The long short-term memory (LSTM) network is a special kind of recurrent neural network (RNN). Compared with RNNs with long-term dependence problems, LSTM shows a structure of the cell state, and this cell state can be modified by the input gate, the output gate, and the forgetting gate to realize the long-term storage of state information. LSTM is suitable for dealing with highly time series-related problems, such as wind power prediction (Wang et al., 2019). Supplementary Figure S1 shows its basic structure.
Forgetting gate nk can read the entered information of mk-1 and xk and then selectively retain or delete some information of ck-1 using the sigmoid function; their functional relationship is shown in formula (1). The candidate value of cell state
where an, ae, ac, and ao denote the weight values; dn, de, dc, and do denote the bias values; and
The following two indicators are used to measure the prediction effect of LSTM prediction, the formulas of which are shown in (4) and (5):
where M denotes the sample quantity of the prediction dataset; Preal,t and Ppre,t represent the real value and the predicted value at time t, respectively; MAPE denotes the main absolute percentage error; and RMSE denotes the root mean square error.
We calculate the predicted net load using Eq. 6:
where Pw,pre,t and Pl,pre,t denote the predicted wind power and the predicted load, respectively, at time t. Pnl,pre,t denotes the predicted net load.
We take the sum of the minimum value of the predicted net load (Pnl,pre,min) and the rated power of energy storage (Pb) as a valley-filling power line to calculate the planned charging quantity (Ec,plan) of the energy storage and take the difference of the maximum value of the predicted net load (Pnl,pre,max) and the rated power of the lithium battery as the peak shaving power line to calculate the planned discharging quantity of the energy storage Ed,plan. The formulas are given as follows:
where t1 and t2 denote the charging periods corresponding to the intersection of the valley-filling power line and the predicted net load, respectively; t3 and t4 denote the charging periods corresponding to the intersection of the peak shaving power line and the predicted net load, respectively; and ηc and ηd denote the charging and discharging efficiency, respectively.
If the planned charging quantity cannot meet the capacity constraint relationship shown in formula (9), we move the valley-filling power line downward in steps of ΔP, until the constraints are met. If the planned discharging quantity cannot meet the capacity constraint relationship shown in formula (10), we move the valley-filling power line upward in steps of ΔP, until the constraints are met.
where SOCmax and SOCmin denote the upper and lower limits of SOC, respectively. Eb denotes the rated capacity; ε0 denotes the positive number close to 0. The value of ΔP should be set according to the specific situation.
According to formulas (7) and (8), the basic charging and discharging time of energy storage can be planned, respectively. To meet the balance of the charging quantity and the discharging quantity within the operating day (T), the power of the energy storage in the remaining inoperative period Ts is planned with the objective of reducing the fluctuation of the predicted net load and improving the operation income.
If Ec,plan is greater than Ed,plan, we take the discharging income (Id) and the maximum of the standard deviation improvement of the predicted net load (Sd) as the objective function F1. Formula (11) was used for normalization, and formulas (12) show the results after normalization:
where xi denotes the initial value of the feature sequence; xi* denotes the normalized feature sequence value; xmin denotes the minimum value in the feature sequence. xmax denotes the maximum value in the feature sequence.
where pt denotes the electricity price at time t and pmin denotes the minimum electricity price.
If Ec,plan is less than Ed,plan, we take the charging cost (Ic) and the minimum of the standard deviation of the predicted net load Sc as the objective function F2. The following formulas are the results after normalization:
where pmax denotes the maximum electricity price; n denotes the number of time periods in Ts; Snl,pre and Pnl,pre,av denote the power standard deviation and the average value of the predicted net load, respectively; Pc,t and Pd,t denote the charging power and the discharging power to be planned in Ts, respectively.
Because the dimensions of the energy storage operation income and the load standard deviation are different, it is necessary to normalize them and then use particle swarm optimization to find the optimal solution. * represents normalized processing. Particle swarm optimization is already well-known, and due to reasons of space, this study will not repeat it.
The prediction error easily leads to the early or delayed action of energy storage, which affects the output of energy storage. Therefore, in this study, the peak shaving line is corrected online by comparing the planned residual energy Eres,pre with the actual residual energy Eres, real.
where Pc,pre and Pd,pre, respectively, denote the planned charging power and the planned discharge power of energy storage at time t. Pc,real and Pd,real denote the actual charging power and the actual discharge power of the energy storage at time t, respectively. The actual charging and discharging power of the energy storage can be calculated according to the difference between the planned peaking power line and the actual net load.
We calculate the difference of planned residual energy and actual residual energy, named Es:
When Es >ε and if Pb,pre ≤0, the value of the valley-filling power line increases 5% Pb; otherwise, the value of the peak shaving power line decreases 5% Pb.
When Es <-ε and if Pb,pre ≤0, the value of the valley-filling power line decreases 5% Pb; otherwise, the value of the peak shaving power line increases 5% Pb.
When |Es| ≤ε, it does not change, where ε denotes the allowable error range of the electric quantity, and the value is 5% of the rated capacity, and Pb,pre denotes the planned power of energy storage.
The block diagram of the multi-timescale energy storage optimization control strategy based on LSTM prediction and correction is shown in Supplementary Figure S2.
The system power balance constraint is given as follows:
where Pg denotes the tie-line power, Pwind denotes the grid-connected power of wind power, Pload denotes the load power, and Pbat denotes the power of the lithium battery.
The power constraints of energy storage are shown in formula (18), and the SOC constraints of energy storage are shown in formula (19):
where Pc and Pd denote the charge and discharge power of energy storage days, respectively.
where SOCt denotes the SOC of t time energy storage.
The formulas for calculating the peak–valley difference α and the peak–valley difference rate β are as follows:
where Pload,max and Pload,min denote the maximum and minimum values of the load, respectively.
We calculate the standard deviation S using Eq. 21:
where Pload,i denotes the load power of the ith sampling point and Pav denotes the average value of the load curve.
We calculate the operation income I by using Eq. 22:
This study verifies the proposed strategy in MATLAB according to the actual data in a certain place in China and compares it with the other two strategies. The relevant wind power and load data are shown in Supplementary Figure S3. The sampling period is Δt = 15 min, and the total daily sampling points are n = 96; Table 1 shows the relevant parameters of the lithium battery.
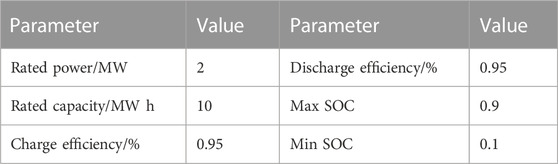
TABLE 1. Parameters of the lithium battery energy storage.
The predicted curves and index are shown in Supplementary Figure S3 and Table 2, respectively. The predicted net load is shown in Supplementary Figure S4.

TABLE 2. Evaluation index of prediction.
Supplementary Figure S3 illustrates that there exists one valley and two peaks in the typical daily actual load in this area, but the wind power value is larger in the valley and smaller in the peak. Therefore, the peak–valley difference of the actual load will increase. Table 2 indicates that the MAPE of the wind power and load are 3.7% and 0.53%, respectively, and their NRSE values are 0.029 and 0.17 MW, respectively. According to Wang et al. (2019), the prediction error is within a reasonable range, so the predictive planning model based on the predicted net load curve has a certain rationality.
Supplementary Figure S4 shows a comparison of the effect before and after the correction of the actual peak shaving. Supplementary Figure S5 shows the changes in the SOC and power before and after correction during the actual operation of energy storage.
Supplementary Figures S5A, B indicate that the SOC of the lithium battery before correction will exceed its maximum value of 0.9 at 8 o’clock and is finally maintained at 0.21; the charge quantity within the day is significantly greater than the discharge quantity. It can be seen that if the actual charge and discharge of the lithium battery are controlled only according to the predictive planning strategy, it is easy to cause overcharge of energy storage. After the correction, the maximum value of the energy storage SOC will not exceed 0.9 and the minimum value will remain as approximately 0.1. This phenomenon just proves that the action of the lithium battery meets the requirement of power balance during peak shaving.
Supplementary Figure S6 illustrates that the effect of peak shaving for the multi-timescale optimal control strategy proposed in this study is notably superior to that for the other two strategies. Table 3 illustrates the evaluation index results of the three strategies.
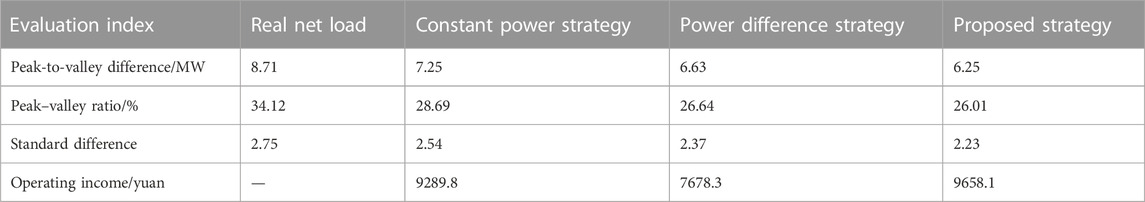
TABLE 3. Evaluation index results of the three strategies.
From the peak shaving effect perspective, the peak–valley difference rate of the real net load is 34.12%, and that of the strategy proposed in this study is 26.01%, reduced by 8.11%, which is the largest reduction among the three strategies, while those of the constant power and power difference strategies are 28.69% and 26.64%, respectively, reduced by 5.43% and 7.48%, and the reduction effect is only 66.9% and 92.2% of the multi-timescale optimal control strategy, respectively. Furthermore, the standard difference of the proposed strategy is 2.23, reduced by 0.52, while the other two strategies only reduce by 0.21 and 0.38. It shows that this strategy can also effectively reduce the volatility of the load.
From an economic perspective, the energy storage operating income of the proposed strategy is 9658.1 yuan, while those of the constant power strategy and the power difference strategy are 9289.8 yuan and 7678.3 yuan, respectively. The operating incomes are 103.9% and 125.8%, respectively, for the other two strategies.
Through the comparison of the charging and discharging power of lithium batteries under the three strategies and combined with the theory of the control strategy, it becomes evident that the power difference strategy primarily focuses on achieving the charge–discharge balance without considering the available capacity of the lithium batteries. The charging capacity and discharge capacity may be close to or consistent in the early stage of energy migration, resulting in the failure to maximize the charge and discharge role of lithium batteries and improve the peak-filling effect. The constant power strategy, from the point of view of the charge and discharge time, makes the lithium battery always run at a high power, the charge and discharge time becomes short, and the operation income of energy storage becomes high; however, the effect of peak cutting and valley filling is poor.
In summary, while the power difference strategy outperforms the constant power strategy in peak clipping and valley filling, it lags slightly behind in terms of economic benefits. The results obtained from the strategy proposed in this paper surpass those of the traditional constant power strategy and the power. With the increasing penetration rate of new energy and the increasing responsibility weight of renewable energy in each region, the reasonable peak cutting and valley filling strategy is an important measure to effectively adjust the load.
This study proposed a multi-timescale optimal control strategy for lithium batteries based on LSTM prediction–correction. Compared with the other two strategies, the proposed strategy can cut back the peak-to-valley difference to 6.25 MW, reduce the peak-to-valley difference rate to 26.01%, and increase the income by 9658.1 yuan. Combined with the relevant theory of the power difference strategy, it is found that this strategy mainly aims at the balance of the charge and discharge and cannot fully utilize the energy storage capacity for peak regulation. In addition, this strategy can make full use of its own capacity and power, takes the maximum valley value increase and peak value reduction as the goal, and considers the operating benefits, increases the charging capacity during valley hours, and then improves the power supply capacity of lithium batteries during peak hours, thus leading to an improved peak shaving efficacy and economic gains.
In future research, it is advisable to utilize a more effective prediction method for implementing the strategy. Moreover, since the current approach relies on the traditional PSO algorithm for its solution, exploring alternative methods to replace it should be considered to enhance the overall efficiency of the strategy.
The datasets presented in this article are not readily available but data can be provided on reasonable request. Requests to access the datasets should be directed to d2xpdUBuanVzdC5lZHUuY24=.
JW: conceptualization, methodology, investigation, formal analysis, and writing—original draft; YC: data curation and writing—original draft; JZ: visualization and investigation; CJ: data curation; WL: writing—review and editing and funding acquisition. All authors contributed to the article and approved the submitted version.
This work was supported by the National Natural Science Foundation of China (no. 52077103).
Authors JW was employed by State Grid Wenzhou Electric Power Supply Company, YC was employed by State Grid Rui’an Electric Power Supply Company, and JZ was employed by State Grid Zhejiang Electric Power Co., Ltd.
The remaining authors declare that the research was conducted in the absence of any commercial or financial relationships that could be construed as a potential conflict of interest.
All claims expressed in this article are solely those of the authors and do not necessarily represent those of their affiliated organizations, or those of the publisher, the editors, and the reviewers. Any product that may be evaluated in this article, or claim that may be made by its manufacturer, is not guaranteed or endorsed by the publisher.
The Supplementary Material for this article can be found online at: https://www.frontiersin.org/articles/10.3389/fenrg.2023.1240764/full#supplementary-material
Ahmed, I. Z., Sadjadpour, H. R., and Yousefi, S. (2022). Information-assisted dynamic programming for a class of constrained combinatorial problems. IEEE Access 10, 87816–87831. doi:10.1109/ACCESS.2022.3198964
Bennett, C. J., Stewart, R. A., and Lu, J. W. (2015). Development of a three-phase battery energy storage scheduling and operation system for low voltage distribution networks. Appl. Energy 146, 122–134. doi:10.1016/j.apenergy.2015.02.012
Colonetti, B., Finardi, E., Brito, S., and Zavala, V. (2023). Parallel dual dynamic integer programming for large-scale hydrothermal unit-commitment. IEEE Trans. Power Syst. 38 (3), 2926–2938. doi:10.1109/TPWRS.2022.3187059
Dayarathna, S., Senanayake, R., and Evans, J. (2022). Optimal routing for multi-user multi-hop relay networks via dynamic programming. IEEE Wirel. Commun. Lett. 11 (8), 1713–1717. doi:10.1109/LWC.2022.3177187
Engels, J., Claessens, B., and Deconinck, G. (2020). Optimal combination of frequency control and peak shaving with battery storage systems. IEEE Trans. Smart Grid 11 (4), 3270–3279. doi:10.1109/TSG.2019.2963098
Górski, T. (2022). Reconfigurable smart contracts for renewable energy exchange with Re-use of verification rules. Appl. Sci. 12 (11), 5339. doi:10.3390/app12115339
Guo, Y., Zhang, Q., and Wang, Z. (2021). Cooperative peak shaving and voltage regulation in unbalanced distribution feeders. IEEE Trans. Power Syst. 36 (6), 5235–5244. doi:10.1109/TPWRS.2021.3069781
Hwang, J. S., Fitri, I. R., Kim, J.-S., and Song, H. (2020). Optimal ESS scheduling for peak shaving of building energy using accuracy-enhanced load forecast. Energies 13 (21), 5633. doi:10.3390/en13215633
Jing, S., Nengning, T., and Qi, L., (2015). Load shifting scheme of battery energy storage system based on interval controlling. Trans. China Electrotech. Soc. 30 (16), 221–229. doi:10.19595/j.cnki.1000-6753.tces.2015.16.028
Kodaira, D., Jung, W., and Han, S. (2020). Optimal energy storage system operation for peak reduction in a distribution network using a prediction interval. IEEE Trans. Smart Grid 11 (3), 2208–2217. doi:10.1109/TSG.2019.2949573
Li, X., Ma, R., Gan, W., and Yan, S. (2022). Optimal dispatch for battery energy storage station in distribution network considering voltage distribution improvement and peak load shifting. J. Mod. Power Syst. Clean. Energy 10 (1), 131–139. doi:10.35833/MPCE.2020.000183
Menniti, D., Pinnarelli, A., Sorrentino, N., Vizza, P., Barone, G., Brusco, G., et al. (2022). Enabling technologies for energy communities: some experimental use cases. Energies 15 (17), 6374. doi:10.3390/en15176374
Riffonneau, Y., Bacha, S., Barruel, F., and Ploix, S. (2011). Optimal power flow management for grid connected PV systems with batteries. IEEE Trans. Sustain. Energy 2 (3), 309–320. doi:10.1109/TSTE.2011.2114901
Rowe, M., Yunusov, T., Haben, S., Singleton, C., Holderbaum, W., and Potter, B. (2014). A peak reduction scheduling algorithm for storage devices on the low voltage network. IEEE Trans. Smart Grid 5 (4), 2115–2124. doi:10.1109/TSG.2014.2323115
Shiwei, D., Xiuyu, Y., and Renyong, C., (2020). Optimal configuration method of flexibility resources of high-penetration renewable energy. J. Northeast Dianli Univ. Sci. Ed. 40 (6), 45–51. doi:10.19718/j.issn.1005-2992.2020-06-0045-07
Wang, Y. L., and Xi, D., (2019). Prediction of interaction between grid and wind farms based on PCA-LSTM model. Proc. CSEE 39 (14), 4070–4079. doi:10.3390/en11113221
Wei, W., Ye, Z., Wang, Y., Dai, S., Chen, L., and Liu, X. (2022). An economic optimization method for demand-side energy-storage accident backup assisted deep peaking of thermal power units. J. Chin. J. Electr. Eng. 8 (2), 62–74. doi:10.23919/CJEE.2022.000015
Zhang, S., Liu, H., Wang, F., Miao, Y., and Dong, J. (2020). Dual-stage operation strategy of BESS for frequency regulation considering planned peak shaving. Energy Rep. 6, 502–508. doi:10.1016/j.egyr.2020.11.206
Keywords: peak shaving, energy storage, LSTM, prediction-correction, multi-time-scale
Citation: Wu J, Chen Y, Zhou J, Jiang C and Liu W (2023) Multi-timescale optimal control strategy for energy storage using LSTM prediction–correction in the active distribution network. Front. Energy Res. 11:1240764. doi: 10.3389/fenrg.2023.1240764
Received: 15 June 2023; Accepted: 30 August 2023;
Published: 21 September 2023.
Edited by:
Tianqi Hong, Argonne National Laboratory (DOE), United StatesReviewed by:
Zhao Luo, Kunming University of Science and Technology, ChinaCopyright © 2023 Wu, Chen, Zhou, Jiang and Liu. This is an open-access article distributed under the terms of the Creative Commons Attribution License (CC BY). The use, distribution or reproduction in other forums is permitted, provided the original author(s) and the copyright owner(s) are credited and that the original publication in this journal is cited, in accordance with accepted academic practice. No use, distribution or reproduction is permitted which does not comply with these terms.
*Correspondence: Wei Liu, d2xpdUBuanVzdC5lZHUuY24=
Disclaimer: All claims expressed in this article are solely those of the authors and do not necessarily represent those of their affiliated organizations, or those of the publisher, the editors and the reviewers. Any product that may be evaluated in this article or claim that may be made by its manufacturer is not guaranteed or endorsed by the publisher.
Research integrity at Frontiers
Learn more about the work of our research integrity team to safeguard the quality of each article we publish.