 Zhanhong Wei
 Xuebo Sun
 Wei Chen1
 Jinhui Shi
- 1College of Electrical and Information Engineering, Lanzhou University of Technology, Lanzhou, China
- 2Wuwei Power Supply Company of State Grid Gansu Provincial Electric Power Company, Wuwei, China
The large-scale integration of wind power into the power grid can cause a new type of sub-synchronous power oscillation, different from traditional thermal power generation. The oscillation energy will spread extensively in the grid, causing power oscillation and even grid-cascading events. To address this issue, this article proposes a method for quantitatively analyzing the propagation characteristics of oscillation energy based on branch oscillation energy. Firstly, analyzing the oscillation energy shared by different branches in the network based on transient energy function. Next, a method is proposed to identify the dominant propagation path of sub-synchronous oscillation by defining the oscillation energy of branches under the dominant oscillation mode and the oscillation energy distribution coefficient of each branch. The oscillation partition set formed by the dominant propagation path can be used to locate the high-risk oscillation area of the system. Finally, the effectiveness of the method proposed in this paper for studying the wide-area propagation characteristics of sub-synchronous oscillations was verified through time-domain simulation analysis.
1 Introduction
Currently, series compensation devices are widely used in the transmission lines of large-scale wind power grid-connected systems in China. However, in recent years, sub-synchronous oscillations caused by large-scale wind power being connected to the grid through series compensation have occurred multiple times (Li and Peng, 2016; Xie et al., 2017; Zhao et al., 2019), seriously affecting the large-scale transmission of new energy wind power and the safe and stable operation of the power grid (Chen et al., 2018). Multiple accidents have occurred globally where power transmission through series-compensated transmission lines from wind farms has caused sub-synchronous oscillations. In 2009, the Double Fed Wind Power Plant in Texas, United States, experienced sub-synchronous power oscillations due to the series-compensated transmission lines. The detection revealed sub-synchronous components of 20 Hz in the wind farm output current, leading to many wind turbines tripping and causing damage to the crowbar circuit (Adams et al., 2012). In 2011, Ontario, Canada also experienced sub-synchronous power oscillations of 9–13 Hz due to a double-fed wind power system connected through series compensation (Narendra et al., 2011). In 2012, the Guyuan Wind Farm in Hebei, China also experienced sub-synchronous oscillations of 6–8 Hz multiple times, resulting in a large number of wind turbines tripping and seriously affecting the safe operation of power grid equipment (Li et al., 2017). In 2015, a wind farm in Hami, Xinjiang, China experienced sub-synchronous oscillations of 20–40Hz, leading to the tripping of the generator rotor protection of a thermal power plant located 300 km away due to torsional vibration, causing it to be disconnected from the grid and shut down (Wang et al., 2015; Xie et al., 2016; Liu et al., 2017). These oscillation incident reports indicate that compared to direct-drive permanent magnet generator units, double-fed units are more susceptible to sub-synchronous oscillations incidents when series-compensated capacitors are present in the transmission line.
This type of sub-synchronous oscillation issue is typically believed to be caused by the sub-synchronous control interaction between the power electronic converter of the double-fed wind turbine generator and the series-compensated capacitor in the power system (Ostadi et al., 2009). Sub-synchronous oscillations caused by large-scale wind power grid integration typically involve multiple regions, units, and equipment. The sub-synchronous oscillation energy permeates from the wind farm side to the remote power system and spreads widely across multiple levels of the power system. Preliminary research results indicate that sub-synchronous oscillation energy has the characteristic of wide-area propagation in the power system (Ma et al., 2020).
Currently, research on disturbance energy propagation leading to system oscillations mainly focuses on the scope of electromechanical transients in power systems. In reference (Thorp et al., 1998), a mathematical model was established for the propagation of electromechanical disturbance energy. The concept of electromechanical waves was used to describe the evolution process of disturbance energy in the system. Reference (Ma and Wang, 2016) studied the dynamic characteristics of electromechanical wave reflection and transmission in a continuum model and explained from an energy perspective that the oscillation nature of power systems is the dynamic superposition of different frequency electromechanical waves during their propagation. The research in reference (Wang et al., 2017) showed that the dynamic characteristics of disturbance energy during its propagation are greatly influenced by the oscillation frequency. However, it remains to be further verified and explored whether the existing theory on electromechanical wave disturbances propagation applies to the wide-area propagation of sub-synchronous oscillations caused by large-scale wind power integration. Although phasor measurement units (PMUs) can provide wide-area measurement information, in practice, the PMUs only collect fundamental electrical quantities, and the electrical quantities of sub-synchronous frequency and various harmonic and inter harmonic components are filtered out by the filters. The traditional power frequency measurement method of PMUs is difficult to accurately measure the oscillating electrical quantities (Xie et al., 2019).
In reference (Ren et al., 2018), the transient energy flow method was applied to the study of sub-synchronous oscillations, and its physical meaning was discussed in depth, explaining the relationship between transient energy flow in oscillations and the power and damping in the system. However, the study was limited to sub-synchronous oscillations involving the generator shaft system. In reference (Cao et al., 2020), the transient energy flow method was used for oscillation source localization, and the transient energy flow of a doubly-fed wind turbine was derived. The direction of the energy flow during system oscillations was determined by the energy flow power index, and thus the forced oscillation source of the system was located. However, there was no research on the influence of the control parameters of the system inverter on the transient energy flow. Reference (Maslennikov et al., 2017) proposed a dissipation energy flow method to locate weakly-damped oscillation sources in the system using measured PMU data. However, network losses and load characteristics can affect the accuracy of the dissipation energy flow method, and further verification is needed to determine whether this method can be used for studying oscillation propagation characteristics. Reference (Ma et al., 2022) proposed an analysis method that combines the dissipation energy flow method with signal processing to locate and identify sub-synchronous oscillation sources. However, it is not possible to determine the diffusion and propagation path of oscillation energy in the system based solely on the branch dissipation energy flow.
Reference (Wen et al., 2019) proposed a sub-synchronous oscillation propagation factor that characterizes the propagating characteristics of sub-synchronous oscillations based on frequency domain methods. This factor is obtained from the transfer function matrix of the system, but no analysis was performed on the factors that affect the propagation factor during the study. Reference (Zhang et al., 2017) proposed a branching coefficient method to locate the propagation path of sub-synchronous oscillations caused by wind power integration into weak grids. However, this method did not consider the effect of oscillation power and can only characterize the propagation path of sub-synchronous currents in the system. In addition, the branching coefficients depend on the frequency characteristics and network structure of the system. Reference (Xie et al., 2020) proposed criteria and a framework for identifying sub-synchronous and super-synchronous oscillation sources based on measurements but did not provide a clear explanation of the specific form of oscillation power. Reference (Yang et al., 2021) analyzed the spreading characteristics of sub-synchronous oscillation power in different branches of the network through the proposed branching coefficient. However, it is difficult to determine the propagation strength of oscillation power at each node through quantitative analysis. Reference (Gong et al., 2019) studied the propagation characteristics of oscillating current along a weakly damped path based on an RLC circuit model under the condition of a single oscillation frequency. However, it did not consider the situation where different frequency components coexist and the propagation mechanism in complex networks. In the study presented in reference (Yang et al., 2019), a propagation factor was proposed to quantify the amplitude of oscillations propagated from one point to other points through a multi-input multi-output transfer function. However, it cannot identify the critical nodes and branches for the propagation of oscillation power in the network. Reference (Zhan et al., 2019) used frequency-domain modal analysis to identify the stability and propagation paths of oscillation modes in renewable energy-integrated systems. However, there was no specific quantitative analysis of the propagation paths of oscillation power at specific oscillation frequencies.
Exploring the evolution path of sub-synchronous oscillations can provide early warning of critical equipment and lines, and effectively interrupt the propagation path of sub-synchronous oscillations by adding damping control devices at weak nodes in the power grid, thereby mitigating its further development in the power grid. Currently, the wide-area propagation mechanism of sub-synchronous oscillation is still unclear, and its wide-area propagation characteristics need to be further explored from different perspectives.
In summary, studying the wide-area propagation characteristics of sub-synchronous oscillations, and tracking and locating the propagation path of sub-synchronous oscillations are the basis for effectively suppressing and blocking the development and evolution of sub-synchronous oscillations. Obtaining the propagation characteristics of oscillation power caused by large-scale wind power integration can deepen our understanding of the oscillation propagation mechanism, provide the basis for the location of oscillation propagation paths and regions, and ensure the warning, control, monitoring, and suppression of oscillations, ensuring the safe, stable, and economic operation of the “double high” power system for efficient export and integration of large-scale renewable energy power in China. This study will provide the foundation for enhancing the stability of new-generation high-penetration renewable energy power systems. Therefore, studying the wide-area propagation characteristics of sub-synchronous oscillations in the power grid has profound research significance.
The main contribution of this paper is to address the challenge of quantitatively analyzing the propagation characteristics of sub-synchronous oscillations generated by large-scale wind farms during grid integration. A quantitative analysis method is proposed based on branch oscillation energy to identify the dominant propagation paths of sub-synchronous oscillations. This method aims to determine the propagation and distribution patterns of oscillation energy within the system after oscillation occurrence. The research provides a foundation for the subsequent real-time monitoring, control, and wide-area warning and suppression of sub-synchronous oscillations. The specifc research process of the paper is shown in Figure 1.
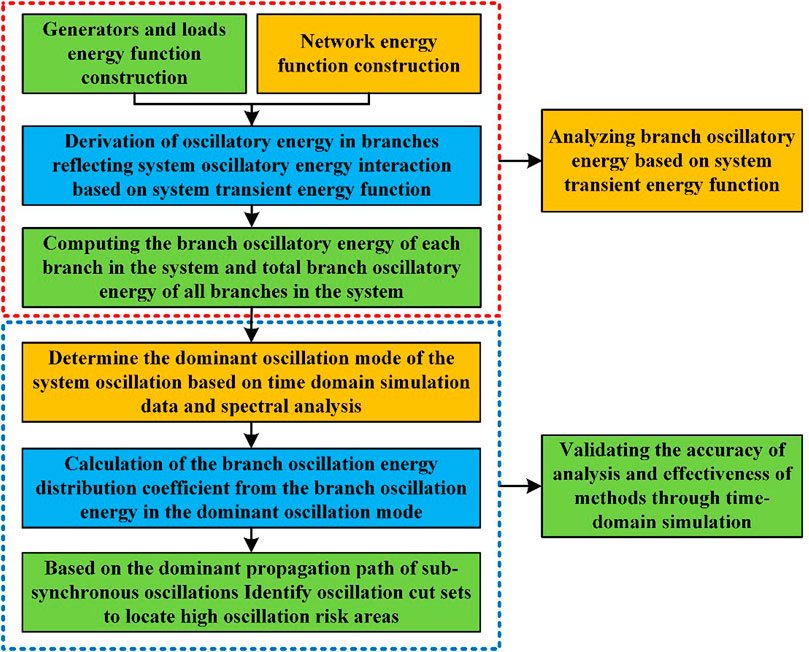
FIGURE 1. Block diagram of the research process.
2 Construction of system transient energy function
The method based on energy function construction is used to derive and construct the system’s transient energy function. Assuming there are N nodes in a certain power system, according to Kirchhoff’s current law in circuit theory, the system node voltage equation can be written as:
Where
Taking the imaginary part of the above Equation 2 and integrating it, we can get:
In the equation,
Here,
2.1 Energy function of a generator
When a generator adopts a classical second-order model, its state equation is:
In the equation, the unit of
Equation 7 above is the energy function corresponding to the generator.
2.2 Energy function of the load
Usually, the changes in active and reactive power of a load with frequency and voltage variations can be described by algebraic equations using the static model of the load. When a constant power static load model is used for the load model, the following relationship is established:
Integrating the above equation gives the energy function of the load:
2.3 Energy function of the network
The node’s admittance matrix of the system is
Sorting out the terms
Integrating the Equation 11 further gives:
Equation 12 is also commonly referred to as transient electromagnetic potential energy in a network.
2.4 Transient energy function of the system
When the generator is modeled as a classical model and the load is modeled as a constant power model, assuming that the system is a lossless network and neglecting the system’s damping, let
Differentiating the sum of equations (7) and (9), and (12) yields:
3 Analysis and quantification of branch oscillation energy
During sub-synchronous oscillations, branches can often reflect a lot of information about oscillation energy propagation and diffusion in the network. The oscillation energy of branch oscillations at the time of oscillation occurrence is analyzed according to the system energy function, and the dominant oscillation branches of the oscillation system are identified and located.
3.1 System energy function during oscillation
According to Kirchhoff’s current law, it follows from
In Equation 15, the current flowing from node
When sub-synchronous oscillations occur in the system, the oscillation energy also appears accordingly. The total oscillation energy of the entire system during oscillation can be obtained by Equation 3 based on the above equation.
In the above equation,
3.2 Energy function of branch oscillation
The transmission lines in the entire power network serve as the medium for the interaction and propagation of oscillation energy in the system. The electrical quantities and oscillation energy in the transmission lines reflect the oscillation characteristics and specific conditions of the whole system after oscillation occurs. At this point, the total oscillation energy of all transmission lines in the power network is defined as
For any branch in the network, the oscillation energy will be injected into the branch from one of its terminals. Therefore, the oscillation energy of branch
In the equation,
3.3 Branch mode oscillation energy
The total oscillation energy of all branches in the entire system is shared by each branch, and the difference in oscillation energy shared by each branch can reflect the distribution of oscillation energy in the whole system after oscillation occurs, indirectly reflecting the wide-area propagation characteristics of the oscillation energy. In practical engineering, when sub-synchronous oscillations occur in the system, the oscillation mode is often not unique, and there are oscillation characteristics with multiple sub-synchronous frequencies overlaid. Therefore, based on the derivation of branch oscillation energy and the existence of different oscillation modes during oscillation, research on the oscillation distribution of the entire system under different oscillation modes is conducted.
During system oscillation, various electrical quantities are composed of the steady-state component of power frequency and the sub-synchronous oscillation component of different frequencies. The active power of a branch during system oscillation is defined as:
In the equation,
Although there are multiple oscillation modes during system oscillation, there are usually a few dominant oscillation modes that have much larger oscillation energy than other oscillator modes. Additionally, the steady-state component of power frequency is much larger than the sub-synchronous frequency oscillation component during oscillation. Assuming that the dominant oscillation modes in the oscillating system are modes
The following relationship can be obtained in this case:
Similar to the derivation process above, simplifying all terms in Equation 21 yields:
The above equation represents the branch mode oscillation energy under the dominant oscillation mode. In this equation, A represents the branch mode oscillation energy under oscillation mode B, while C represents the branch mode oscillation energy under oscillation mode D. The specific relationship they satisfy is shown in Equation 26:
3.4 Identification of dominant paths for oscillation propagation
Based on the derived oscillation energy of the branch mode defined in the previous section, this section defines the oscillation energy distribution coefficient of the branch and proposes a method for identifying the dominant propagation path of sub-synchronous oscillation based on the oscillation energy distribution coefficient of the branch. The dominant propagation path of sub-synchronous oscillation can be identified by the difference in the oscillation energy distribution coefficients of different branches. The branches with higher oscillation energy distribution coefficients are also the most fragile branches that share the most oscillation energy in the system. These fragile branches together form the oscillation cut set of the system. The oscillation cut set can be used to locate the areas of high oscillation risk in the system after oscillation occurs. Therefore, the identification of the dominant propagation path of the system oscillation can be completed by locating the area of dominant oscillation in the system.
The oscillation energy distribution coefficient (OEDC) of the branch
In the equation,
The main steps of the method are as follows:
(1) Using the time-domain simulation platform built for the doubly fed wind farm connected to the grid system with series capacitor compensation, set the relevant parameters in the simulation model to excite sub-synchronous oscillation phenomena in the system. After the system generates oscillations, calculate the oscillation energy
(2) Obtain the dominant oscillation mode
(3) The size of the oscillation energy distribution coefficient of all branches in the system is used to determine and identify the dominant paths of oscillation propagation. These dominant paths of oscillation propagation are often fragile branches with lower damping in the system. Therefore, after identifying the dominant paths of oscillation propagation, these fragile branches are defined as the oscillation cut set of the system, and the oscillation energy distribution coefficients of the branches included in the oscillation cut set are compared under the dominant oscillation mode. Based on the size of the oscillation energy shared by the oscillation cut set, the high oscillation risk area of the system can be further located.
4 Case analysis
To verify the accuracy of the theoretical analysis and the effectiveness of the proposed research method in this paper, a simulation system model of sub-synchronous oscillation is constructed based on the PSCAD/EMTDC simulation platform. The simulation models include a doubly fed wind power plant with series compensating lines connected to a four-machine two-area system and an IEEE 10-machine 39-bus system, and are subjected to time-domain simulation analysis and verification.
4.1 Single oscillation source case study of four-machine two-area system
The time-domain simulation verification of the series capacitor compensated line connected to the four-machine two-area small system is carried out by connecting the doubly fed wind power plant with series capacitor compensated lines to Node 6. The doubly-fed wind power plant connected to Node 6 is equivalent to 40 doubly-fed wind turbines with the same parameters of the rated power of 5MW, which operate under the same control parameters and at their rated states. The system frequency is 60 Hz. The doubly fed wind power plant is stepped up through a 0.69kV/35 kV transformer before being connected to the busbar, then stepped up again through a 35kV/230 kV transformer before being connected to the series capacitor compensated line, and finally connected to Node 6 of the four-machine two-area system through the series capacitor compensated line, as shown in Figure 2.
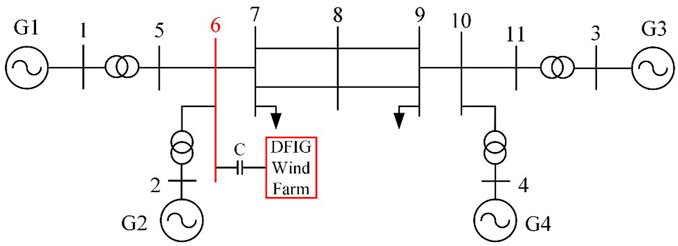
FIGURE 2. The equivalent model of the four-machine two-area system with the doubly fed wind farm connected to it through a series compensating line.
40 doubly fed wind turbines are integrated into the system for steady-state operation. At 1s of the system operation, series compensating capacitors are put into operation and the series compensation degree is set to 30%, which excites the occurrence of sub-synchronous oscillation phenomenon. Data is recorded continuously for 4 s from 1 s before the onset of oscillation. The current output and its frequency spectrum analysis of the wind farm are shown in Figure 3, while the measured output power and its frequency spectrum analysis of one phase of the wind farm are shown in Figure 4.
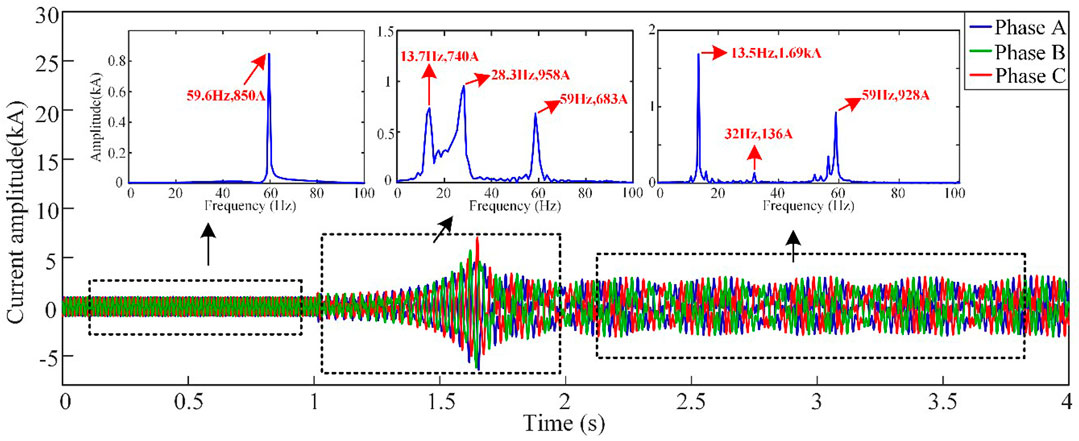
FIGURE 3. Wind farm output current and frequency spectrum in different time periods.
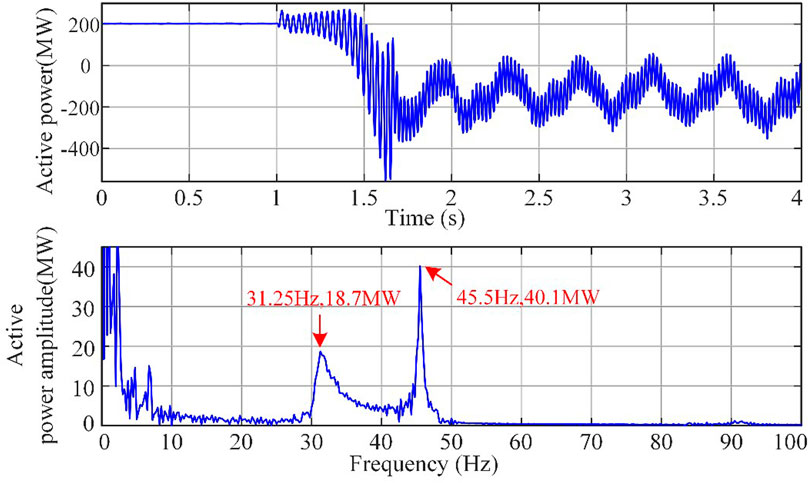
FIGURE 4. Wind farm output power and its spectral analysis.
From Figure 3, it can be observed that in the steady-state stage before introducing the series compensating line, the system frequency is only at the steady-state power frequency. When the series compensating capacitor is introduced at 1 s, the wind farm output current quickly diverges. By the time it reaches 2 s, the wind farm output current tends to a state of equal amplitude oscillation. During the equal amplitude sub-synchronous oscillation stage, the current waveform contains not only the steady-state power frequency component of 928A and 59 Hz, but also sub-synchronous components with an amplitude of 1.69 kA and frequency of 13.5 Hz, as well as an amplitude of 136A and frequency of 32 Hz (small enough to be ignored). During the rapid divergence stage of the oscillation, in addition to containing the steady-state power frequency component of 683A and 59 Hz, there are also sub-synchronous components with an amplitude of 958A and frequency of 28.3 Hz, as well as an amplitude of 740A and frequency of 13.7 Hz. From Figure 4, it can be seen that in the power waveform after exciting the sub-synchronous oscillation, there are sub-synchronous components with an amplitude of 18.7 MW and frequency of 31.25 Hz, as well as an amplitude of 40.1 MW and frequency of 45.5 Hz.
It can be inferred from this that after the system is excited into sub-synchronous oscillation, the system exhibits sub-synchronous oscillation characteristics in which the sub-synchronous frequency of the oscillating current and the sub-synchronous frequency of the oscillating power complement each other, that is, the sum of the sub-synchronous oscillation current frequency and the sub-synchronous oscillation power frequency is the steady-state power frequency of the system at 60 Hz.
At this point, the oscillation power and its spectrum of the four generator outlet branches in the system are obtained, as shown in Figure 5. It can be seen that the oscillation amplitudes in the outlet branches of generators G1 and G2 in the sending end area are the largest, and the oscillations are the most obvious among all. The amplitude corresponding to the sub-synchronous oscillation frequency is also the largest. It can be inferred that the oscillation energy shared by the branches around these sending-end generators is also relatively large.
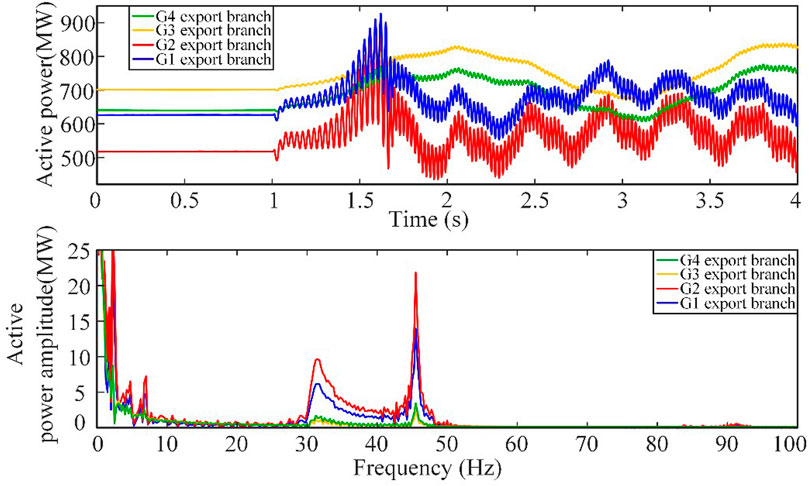
FIGURE 5. Oscillating power and spectrum of generator export branches.
At the same time, the dominant sub-synchronous oscillation mode of the system is the sub-synchronous oscillation mode with an equal wind farm output amplitude of 18.7 MW and frequency of 31.25 Hz, and amplitude of 40.1 MW and frequency of 45.5 Hz. The sub-synchronous oscillation component with a frequency of 31.25 Hz is defined as system oscillation mode one, and the sub-synchronous oscillation component with a frequency of 45.5 Hz is defined as system oscillation mode two. Based on the quantified index of the oscillation energy of the defined branch mode and the oscillation energy distribution system, the oscillation energy of each branch of the system is analyzed and calculated, and the oscillation energy distribution coefficients of each branch are obtained for the two oscillation modes of the system, as shown in Figure 6. It can be observed from the figure that the oscillation energy distribution coefficients of branches 1–5, 2–6, 5-6, and 6-7 are relatively large, and the oscillation energy distribution coefficients of the branches far from the oscillation source are relatively small. Branch 9–10 is located at the sending end of area 2 in the four-machine system, so the oscillation energy distribution coefficient on this branch increases. Furthermore, in the branches after node 6 where the oscillation source is connected, the oscillation energy distribution coefficient of mode one with a frequency of 31.25 Hz is greater than that of mode two with a frequency of 45.5 Hz, starting from branch 6–7.

FIGURE 6. Oscillation energy distribution coefficient of each branch in the system.
From this, it can be inferred that oscillation modes with higher frequencies generally have less effect on distant areas of the system, while oscillation modes with lower frequencies have a wider range of energy propagation and a greater impact on distant areas of the system. Therefore, in the power grid, oscillation components with lower frequencies contain more energy than those with higher frequencies, and are less likely to be dissipated in the grid. Consequently, the sub-synchronous oscillation components with lower frequencies propagate to farther areas in the grid and have a greater impact on the oscillation range.
Based on the calculation and analysis of the oscillation energy distribution coefficients of each branch in the system, the dominant paths of oscillation propagation can be identified, and the fragile branches that bear larger oscillation energy can be located. These fragile branches form the oscillation-cut set of the system, as shown in the blue dashed line in Figure 7 for the four-machine two-area system. The oscillation high-risk areas in the studied system can be further located based on these oscillation-cut sets. In the subsequent research, with the real-time data of measuring devices on the high-risk areas of oscillation and the dominant paths of oscillation propagation, the oscillation can be accurately warned and monitored, and the sub-synchronous oscillation of the system can be further controlled and suppressed, improving the safety and stability of the system’s operation.

FIGURE 7. System high oscillation risk area identification.
4.2 Case of multiple oscillation sources in the 10-machine 39-node system
The previous section considered the possibility that research results on the mechanism and distribution characteristics of sub-synchronous oscillation propagation in a four-machine two-area small system might be affected by system structural parameters. It also considered the limitations of sub-synchronous oscillation in a system caused by a single oscillation source. In this section, we continue to investigate the propagation mechanism and distribution characteristics of sub-synchronous oscillation energy in the IEEE 10-machine 39-bus system, while also considering the universality of the research conclusions.
The IEEE 10-machine 39-bus system is shown in Figure 8. The difference between the constructed research system in the previous example and the simulation case is that two equivalent doubly-fed wind farm oscillation sources are simultaneously connected at different locations in the system. The specific system parameter settings are as follows:
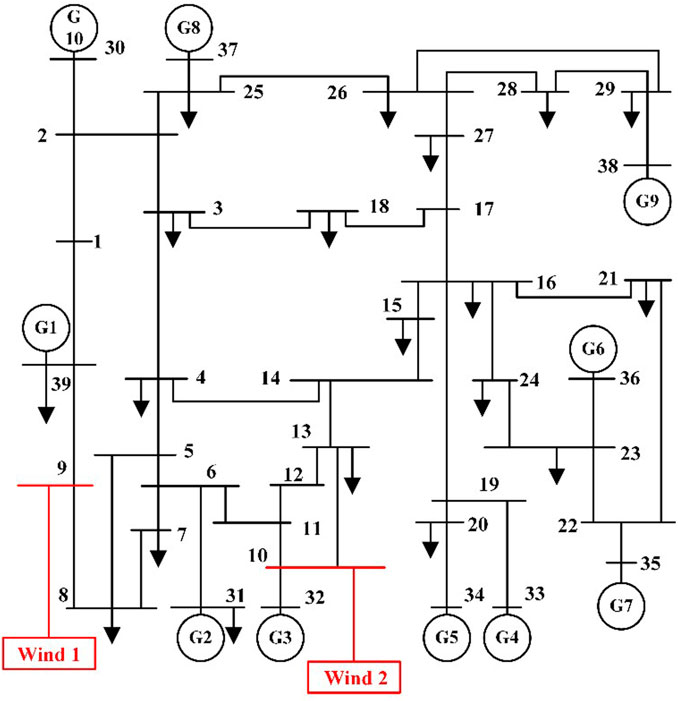
FIGURE 8. Two doubly-fed wind farms connected to IEEE 10 machine 39 node system.
The system steady-state frequency is set to 50 Hz, and the two doubly-fed wind farms are connected to the system at nodes 9 and 10 via series compensating lines. Doubly-fed wind farm 1 consists of 20 identical 5 MW doubly-fed induction wind turbines, with each turbine having the same control parameters and running at the rated state. It is connected to node 9 via a series compensating line with a compensator rating of 9%. Doubly-fed wind farm 2 consists of 30 identical 5.5 MW doubly-fed induction wind turbines and is connected to node 10 via a series compensating line with a compensator rating of 20%. Both wind farms are stepped up via 0.69kV/35 kV transformers and connected to the main bus after being stepped up to 35kV/345 kV. Then they are connected to series capacitor compensating lines. Both series capacitor compensating lines are 100 km long and their line parameters correspond to typical transmission line parameters.
The simulation system for the IEEE 10-machine 39-node system with the above system parameters for the two wind farms is shown in Figure 8. After 1 s of steady-state operation of the system, the series capacitor compensating lines in the output lines of the two wind farms are simultaneously put into operation, which will excite the phenomenon of sub-synchronous oscillation in the system.
Measurements were made on the output current and power of doubly-fed wind farm 1 connected to node 9 and doubly-fed wind farm 2 connected to node 10. The system was set to operate continuously for 2 s, and when it reached the first second, the series capacitor compensator was put into operation, immediately exciting the same amplitude of the sub-synchronous oscillation phenomenon in the system. The waveforms and spectral analysis of the output current and power of the two wind farms are shown in (a) and (b) of Figure 9, respectively.
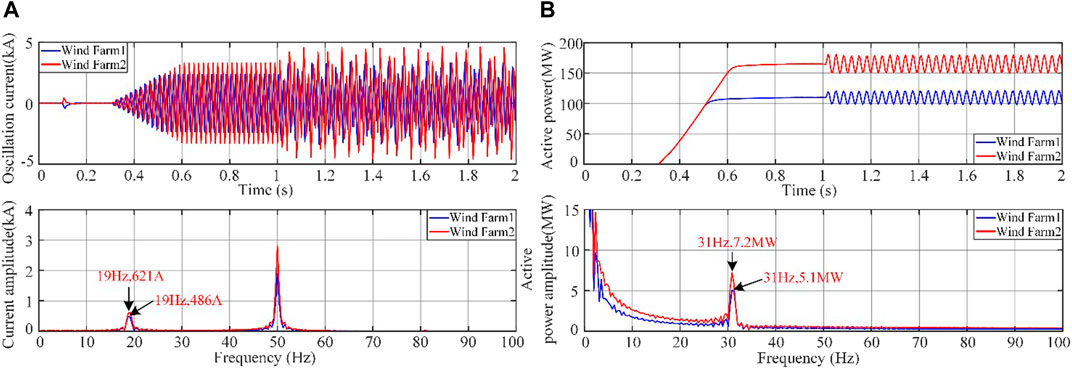
FIGURE 9. Frequency spectrum analysis. (A) Oscillation current and its frequency spectrum from two wind farms’ outputs. (B) Oscillation power and its frequency spectrum from two wind farms’ outputs.
From the figure, it can be seen that there is a sub-synchronous oscillation component of 19 Hz in the oscillating current and a sub-synchronous oscillation component of 31 Hz (dominant oscillation mode) in the oscillating power. Specifically, the amplitudes of sub-synchronous frequency components of the oscillating current and power of doubly-fed wind farm 1 at sub-synchronous frequency are 486A and 5.1 MW, respectively; the amplitudes of sub-synchronous frequency components of the oscillating current and power of doubly-fed wind farm 2 at sub-synchronous frequency are 621A and 7.2 MW, respectively. Their oscillation characteristics also satisfy the complementary relationship between the sub-synchronous oscillation frequencies of the oscillating power and current.
The branches of the IEEE 10-machine 39-node system are numbered, and the specific number corresponding to each branch is shown in Table 1. There are a total of 46 branches and 39 nodes in the entire system, of which 10 nodes are traditional generator-sending end nodes.
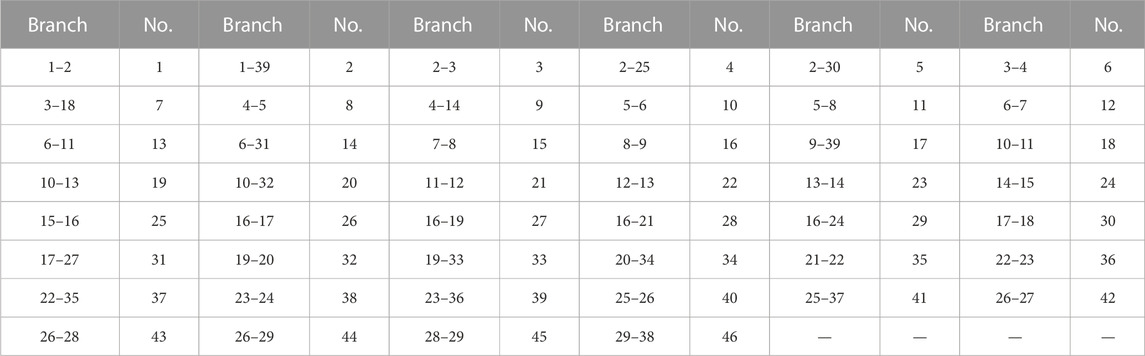
TABLE 1. Corresponding numbers for each branch of the IEEE 10 machine 39 node system.
Through simulation data and calculations, it was found that the oscillation at the exits of the 31st, 32nd, and 39th generator nodes closest to the two doubly-fed wind farm oscillation sources is the most significant, and the oscillation energy around these branches is also the largest. Based on theoretical derivations, the oscillation energy in the system and the branch oscillation energy of each branch under the condition of equal-amplitude oscillation mode were calculated. The oscillation energy distribution coefficients of each branch under the dominant oscillation mode were then obtained, as shown in Figure 10.

FIGURE 10. Oscillation energy distribution coefficient for each branch of the system.
By calculating the oscillation energy distribution coefficients of each branch in the system under the dominant 31 Hz oscillation mode, the dominant path for the propagation of sub-synchronous oscillation in the entire network can be located. From the magnitudes of the branch oscillation energy distribution coefficients in Figure 10, it can be seen that after the sub-synchronous oscillation is excited in the network by the two doubly-fed wind farms connected through series capacitor compensator, the areas near the oscillation source are most significantly affected by the oscillation. After being excited by the two wind farms, the oscillation diffuses and spreads to the downstream circuits and surrounding tie lines connected to nodes 9 and 10, which are where the wind farms are integrated. According to the results of the branch oscillation energy distribution coefficients, the largest share of branch oscillation energy occurs on the branches 9–8, 9–39, 10–11, 10–13, and 10–32, i.e., branches with numbers 16, 17, 18, 19, and 20. The oscillation gradually spreads to the downstream branches and adjacent lines connected to these five branches, and the distribution coefficients of branch oscillation energy also gradually decrease. The branches with the maximum impact from the oscillation and the largest distribution coefficients are all near the power sources G1, G2, and G3, indicating that the propagation and diffusion of oscillation are most significant in the power-sending end area near the oscillation sources in the system. The oscillation energy on the lines and other power-sending end branches far away from the sending end area near the oscillation source is almost negligible, and their oscillation energy distribution coefficients are much smaller than those of the oscillation energy distribution coefficients of the dominant path of oscillation propagation.
Furthermore, the oscillation cut set can be determined to locate the high-risk oscillation areas of the system. The system’s oscillation cut set determined by the branch oscillation energy distribution coefficients is shown in Figure 11. The black dashed line in the figure represents the high-oscillation-risk area of the system when the oscillation sources are connected to nodes 9 and 10.
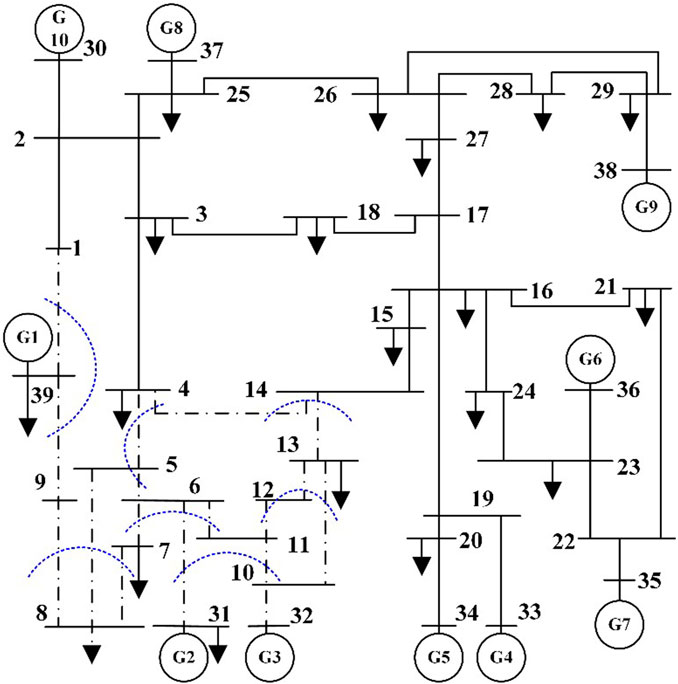
FIGURE 11. Systematic oscillation cut sets and location of oscillation high-risk areas.
Keeping the series compensation level of 9% of the series capacitor compensation line of doubly-fed wind farm 1 unchanged, the series compensation level of the series capacitor compensation line of doubly-fed wind farm 2 connected to node 10 is increased to 40%. After 1 s of system operation, the series compensation line is energized, causing sub-synchronous oscillation in the system. The waveforms and spectra of the oscillating current and power output of the two doubly-fed wind farms are compared in (a) and (b) of Figure 12.
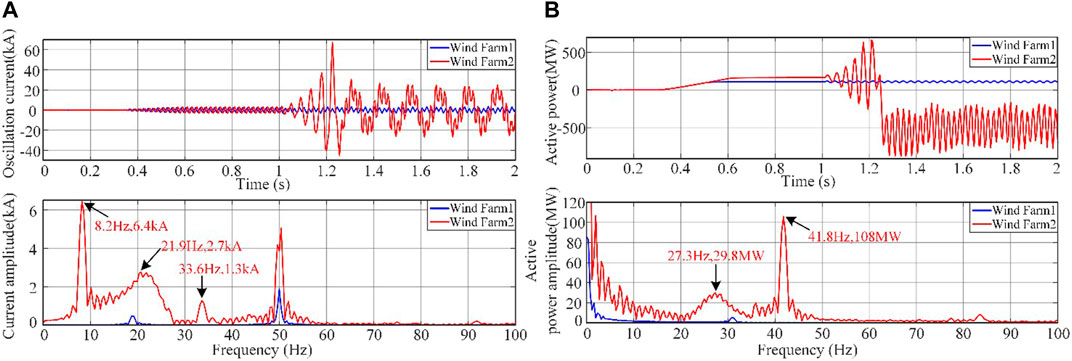
FIGURE 12. Frequency spectrum analysis. (A) Oscillatory current and its spectrum after changing the series compensation of wind farm 2. (B) Oscillation power and its spectrum after changing the series compensation of wind farm 2.
From the figure, it can be observed that after the doubly-fed wind farm 2 is connected with series compensation line, its output current and power diverge rapidly, and approximately 0.25 s later, its output current and power remain in an equal-amplitude oscillation state. During the phase where its output current and power diverge rapidly, the oscillating current output by Doubly Fed Wind Farm 2 comprises oscillation frequencies and amplitudes of 21.9 Hz and 2.7 kA, as well as 33.6 Hz and 1.3 kA. The oscillating power output by Doubly Fed Wind Farm 2 comprises oscillation frequencies and amplitudes of 27.3 Hz and 29.8 MW, as well as 16.4 Hz and 11.9 MW. During the equal-amplitude oscillation phase of its output current and power, the frequencies and amplitudes of the oscillating current and power are 8.2 Hz and 6.4 kA, and 41.8 Hz and 105.6 MW, respectively. Its oscillation characteristics still satisfy the complementary relationship between the sub-synchronous oscillation frequency of the oscillating power and the oscillating current. At this time, the oscillation energy distribution coefficients of each branch were calculated under the equal-amplitude oscillation phase, i.e., the dominant oscillation mode with a frequency of 41.8 Hz, as shown in Figure 13. The oscillation cutting set and high-risk areas determined by this method are similar to those shown in Figure 11.
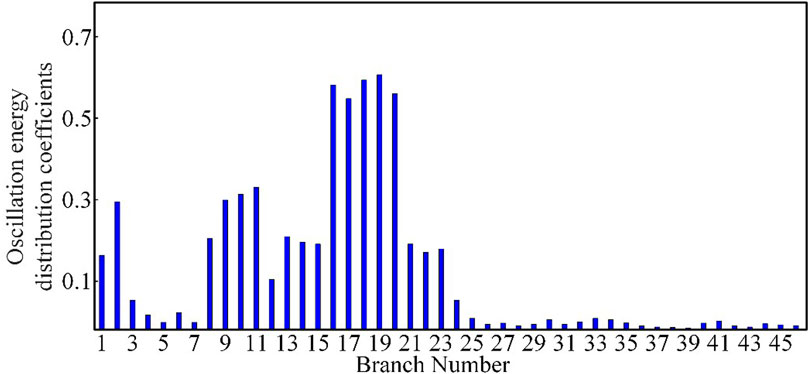
FIGURE 13. Sub-synchronous oscillation energy distribution coefficients of each branch after changing the series compensation of wind farm 2.
Keeping the series compensation degree of 9% for the capacitor of Doubly Fed Wind Farm 1’s series compensation line unchanged and the connection position unchanged, the connection position of Doubly Fed Wind Farm 2 was changed to busbar 17, and its series compensation degree of the series compensation capacitor line was increased to 40%. After one second of system operation, the series compensation line was put into operation, causing sub-synchronous oscillation in the system. At this time, the oscillation energy distribution coefficients of each branch were calculated based on the simulation data of the system, as shown in Figure 14.
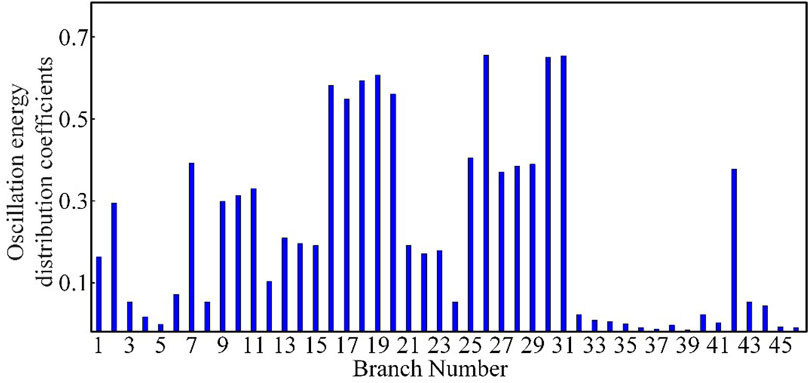
FIGURE 14. Sub-synchronous oscillation energy distribution coefficients of each branch after changing the location of wind farm 2.
After changing the position of Wind Farm 2 to connect to node 17, the results of the calculation of the branch oscillation energy distribution coefficients showed that the branches 17–16, 17–18, and 17–27 had a greater share of the oscillation energy, specifically, branches 26, 30, and 31. The oscillations propagated to the downstream lines connected to these three branches, and the oscillation energy distribution coefficients of the branches gradually decreased. Besides, except for the oscillation energy distribution coefficients of branches near node 9 remaining relatively large, the oscillation did not have much influence on the branches in the power supply area far away from node 17. When the oscillation source is connected to the system’s busbar, the oscillation energy will radiate from the connection point to the surrounding lines, making it difficult to propagate to the nearby power supply areas. It only affects some branches of the contact lines without power support nearby and the receiving end area.
Based on this, the dominant propagation path of the system oscillation was identified, and further determination of the oscillation cutting set was made to locate the high-risk area of the system oscillation as shown in Figure 15. The black dotted line in the figure represents the high-risk oscillation area of the system when the oscillation source is connected to nodes 9 and 17.
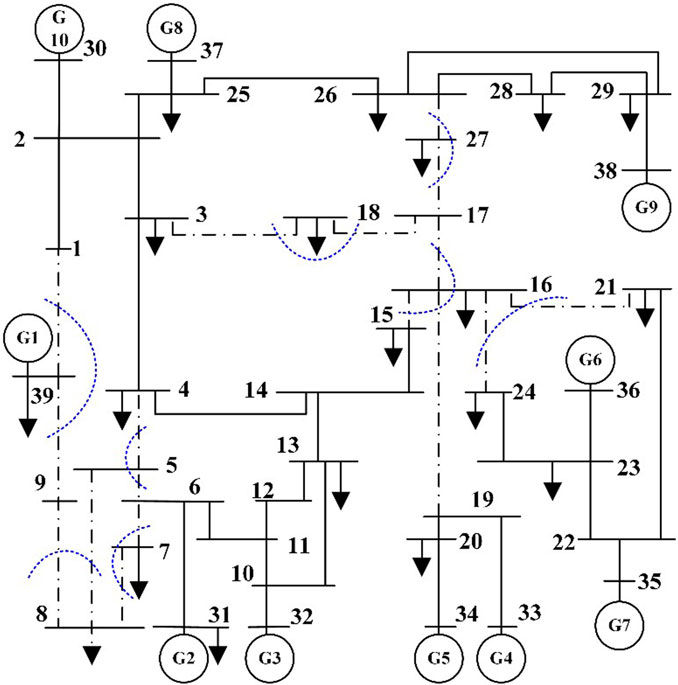
FIGURE 15. Locating oscillation cut-sets and high-risk areas of sub-synchronous oscillation after changing the location of wind farm 2.
The analysis and calculation results of the simulation example above show that when the oscillation source is connected near the power supply area, the oscillation energy has a significant impact on the power supply area, and the distribution of oscillation energy will change with the flow of active power in the system. However, the impact of oscillation energy on remote power supply areas far from the oscillation source is minimal, and it is difficult for oscillation energy to propagate to the remote power supply areas of the system through transmission lines. When the oscillation source is connected to the system busbar, the oscillation energy will radiate from the connection point to the surrounding lines, making it difficult to propagate to nearby power supply areas. It only affects the contact lines without power support nearby and the system receiving end area lines, thereby affecting the nearby electrical equipment and loads. Therefore, it can be concluded that the propagation and diffusion characteristics of system sub-synchronous oscillation energy are influenced by multiple factors such as network source-load structure, system active power flow, and the location of the oscillation source connection.
5 Conclusion
Based on the theoretical foundation of system transient energy function, this article analyzes the oscillation energy shared by different branches in the power grid and quantitatively analyzes the degree of different branches participating in the sub-synchronous oscillation. Based on the distribution and evolution of oscillation disturbance energy in the branches of the power network after oscillation occurs, the dominant paths of oscillation energy distribution can be identified and quantified by defining a coefficient based on the oscillation energy in the branches under the dominant oscillation mode. If these dominant paths carry a large amount of oscillation energy under the dominant oscillation mode, they are more fragile in the system. These fragile branches are defined as oscillation cut-sets, which are used to further locate high-risk areas of sub-synchronous oscillation in the system. The proposed quantitative analysis method for oscillation energy propagation characteristics can rapidly and accurately compute the distribution of oscillation energy in the power system after oscillations occur in large-scale wind power integration systems. This method identifies the dominant propagation paths of oscillation energy and high oscillation risk areas within the system. The effectiveness of the proposed research method was verified through time-domain simulation, and the conclusion is as follows:
(1) In the power supply end area near the oscillation source in the system, the branches that share the oscillation energy after oscillation occurs carry a large amount of energy, and the propagation and diffusion of the oscillation are the most significant in these branches.
(2) The sub-synchronous oscillation modes with higher frequencies have less impact on the areas that are far away from the oscillation source in the system, while the oscillation energy under the sub-synchronous oscillation modes with lower frequencies can propagate and diffuse to a wider range, and have a greater impact on the distant areas of the system.
(3) The system network structure, the distribution of active power flow, and the connection position of the oscillation source can affect the propagation and distribution characteristics of sub-synchronous oscillation energy in the system. When the oscillation source is connected to the system’s tie bus, the oscillation energy will radiate from the connection point to the surrounding lines, making it difficult to propagate to nearby power supply end areas. It will only affect the tie lines without power support nearby and some branches in the receiving end area.
Data availability statement
The original contributions presented in the study are included in the article/Supplementary Material, further inquiries can be directed to the corresponding author.
Author contributions
ZW: resources and investigation. XS: methodology, software implementation, and writing. WC: review and editing. JS: supervision. All authors contributed to the article and approved the submitted version.
Funding
This work was supported in part by the National Natural Science Foundation of China (Nos. 51767017 and 51867015), the Basic Research and Innovation Group Project of Gansu (No. 18JR3RA133), and the Gansu Provincial Natural Science Foundation of China (No. 21JR7RA255).
Conflict of interest
Author XS was employed by Wuwei Power Supply Company of State Grid Gansu Provincial Electric Power Company.
The remaining authors declare that the research was conducted in the absence of any commercial or financial relationships that could be construed as a potential conflict of interest.
Publisher’s note
All claims expressed in this article are solely those of the authors and do not necessarily represent those of their affiliated organizations, or those of the publisher, the editors and the reviewers. Any product that may be evaluated in this article, or claim that may be made by its manufacturer, is not guaranteed or endorsed by the publisher.
References
Adams, J., Carter, C., and Huang, S.-H. (2012). “ERCOT experience with sub-synchronous control interaction and proposed remediation,” in Proceedings of the IEEE PES Transmiss. Distrib. Conf. Expo., Orlando, FL, USA, May 2012, 1–5.
Cao, N., Zhao, X., and Yu, Q. (2020). Forced oscillation source location of doubly-fed wind turbine based on transient energy flow. Power Syst. Autom. 44 (10), 103–110.
Chen, W., Xie, X., Wang, D., Liu, H., and Liu, H. (2018). Probabilistic stability analysis of sub-synchronous resonance for series-compensated DFIG-based wind farms. IEEE Trans. Sustain. Energy 9 (1), 400–409. doi:10.1109/tste.2017.2737599
Gong, Y., Huang, Q., Li, J., and Cai, D. (2019). “Analysis on oscillation propagation characteristics based on impedance model,” in Proceedings of the 2019 IEEE Innovative Smart Grid Technologies - Asia (ISGT Asia), Chengdu, China, May 2019, 1226–1229.
Li, J., and Ping, X. (2016). Impact of increased wind power generation on sub synchronous resonance of turbine-generator units. J. Mod. Power Syst. Clean. Energy. 4 (2), 219–228. doi:10.1007/s40565-016-0192-9
Li, M., Yu, Z., Xu, T., He, J., Wang, C., Xie, X., et al. (2017). Study of complex oscillation caused by renewable energy integration and its solution. Power Syst. Technol. 41 (4), 1035–1042. doi:10.13335/j.1000-3673.pst.2016.3049
Liu, H., Xie, X., He, J., Xu, T., Yu, Z., Wang, C., et al. (2017). Sub-synchronous interaction between Direct-drive PMSG based wind farms and weak AC networks. IEEE Trans. Power Syst. 32 (6), 4708–4720. doi:10.1109/tpwrs.2017.2682197
Ma, N., and Wang, D. (2016). Study on dispersion phenomena of electromechanical disturbance propagation in power systems. Int. Trans. Elect. Energy Syst. 26 (12), 2657–2671. doi:10.1002/etep.2226
Ma, N., Xie, X., He, J., and Wang, H. (2020). Review and discussion of wide-band oscillation in renewable and power electronics highly integrated power systems. Proc. CSEE 40 (15), 4720–4732. doi:10.13334/j.0258-8013.pcsee.191968
Ma, Y., Huang, Q., Gooi, H. B., Zhang, Z., Yang, X., and Wang, Y. (2022). Sub-synchronous oscillation analysis using multisynchrosqueezing transform and dissipating energy flow method. IEEE Trans. Ind. Appl. 58 (3), 3134–3141. doi:10.1109/tia.2022.3149684
Maslennikov, S., Wang, B., and Litvinov, E. (2017). Dissipating energy flow method for locating the source of sustained oscillations. Int. J. Elect. Power Energy Syst. 88, 55–62. doi:10.1016/j.ijepes.2016.12.010
Narendra, K., Fedirchuk, D., Midence, R., Zhang, N., Mulawarman, A., Mysore, P., et al. (2011). “New microprocessor based relay to monitor and protect power systems against sub-harmonics,” in Proceedings of the 2011 IEEE Electrical Power and Energy Conference, Winnipeg, MB, Canada, October 2011, 438–443.
Ostadi, A., Yazdani, A., and Varma, R. K. (2009). Modeling and stability analysis of a DFIG-based wind-power generator interfaced with a series-compensated line. IEEE Trans. Power Del 24 (3), 1504–1514. doi:10.1109/tpwrd.2009.2013667
Ren, Y., Chen, L., Min, Y., Li, Y., and Li, W. (2018). Relationship between transient energy flow, electric power and damping torque in sub-synchronous oscillation. Power Syst. Autom. 42 (22), 52–58.
Thorp, J. S., Seyler, C. E., and Phadke, A. G. (1998). Electromechanical wave propagation in large electric power systems. IEEE Trans. Circuits Syst. I 45 (6), 614–622. doi:10.1109/81.678472
Wang, D., Ma, N., and Guo, C. (2017). Characteristics of electromechanical disturbance propagation in non-uniform power systems. IET Gener. Transm. Distrib. 11 (8), 1919–1925. doi:10.1049/iet-gtd.2016.1126
Wang, L., Xie, X., Jiang, Q., Liu, H., Li, Y., and Liu, H. (2015). Investigation of SSR in practical DFIG-based wind farms connected to a series-compensated power system. IEEE Trans. Power Syst. 30 (5), 2772–2779. doi:10.1109/tpwrs.2014.2365197
Wen, Z., Peng, S., Yang, J., Deng, J., He, H., and Wang, T. (2019). Analysis of the propagation characteristic of sub-synchronous oscillation in wind integrated power system. Energies 12 (6), 1081. doi:10.3390/en12061081
Xie, X., Liu, H., He, J., Zhang, C., and Qiao, Y. (2016). Mechanism and characteristics of sub-synchronous oscillation caused by the interaction between full-converter wind turbines and AC systems. Proc. CSEE 36 (9), 2366–2372. doi:10.13334/j.0258-8013.pcsee.2016.09.007
Xie, X., Zhan, Y., Liu, H., Li, W., and Wu, C. (2019). Wide-area monitoring and early-warning of sub-synchronous oscillation in power systems with high-penetration of renewables. Int. J. Elect. Power Energy Syst. 108, 31–39. doi:10.1016/j.ijepes.2018.12.036
Xie, X., Zhan, Y., Shair, J., Ka, Z., and Chang, X. (2020). Identifying the source of sub-synchronous control interaction via wide-area monitoring of sub/super-synchronous power flows. IEEE Trans. Power Del. 35 (5), 2177–2185. doi:10.1109/tpwrd.2019.2963336
Xie, X., Zhang, X., Liu, H., Li, Y., and Zhang, C. (2017). Characteristic analysis of sub-synchronous resonance in practical wind farms connected to series-compensated transmissions. IEEE Trans. Energy Conv. 32 (3), 1117–1126. doi:10.1109/tec.2017.2676024
Yang, J., Wang, T., and Wang, Z. (2019). “Analysis of sub-synchronous oscillation propagation characteristics caused by interharmonics in wind integrated power system,” in Proceedings of the 2019 IEEE Power & Energy Society General Meeting (PESGM), Atlanta, GA, USA, August 2019, 1–5.
Yang, N., Ma, W., Wang, X., Xie, D., Gu, C., Zhao, D., et al. (2021). Defining SSO power and characterizing SSO propagation in power system with wind farms integration. IEEE Trans. Power Syst. 36 (4), 3531–3540. doi:10.1109/tpwrs.2020.3044993
Zhan, Y., Xie, X., Liu, H., Liu, H., and Li, Y. (2019). Frequency-domain modal analysis of the oscillatory stability of power systems with high-penetration renewables. IEEE Trans. Sustain. Energy 10 (3), 1534–1543. doi:10.1109/tste.2019.2900348
Zhang, P., Xu, P., and Bi, T. (2017). Analysis of sub-synchronous current propagation path of sub-synchronous oscillation induced by renewable energy integrated to the power grid. J. Eng. 2017 (13), 2449–2454. doi:10.1049/joe.2017.0769
Zhao, S., Wang, N., Li, R., Gao, B., Shao, B., and Song, S. (2019). Sub-synchronous control interaction between direct-drive PMSG-based wind farms and compensated grids. Int. J. Electr. Power Energy Syst. 109, 609–617. doi:10.1016/j.ijepes.2019.02.021
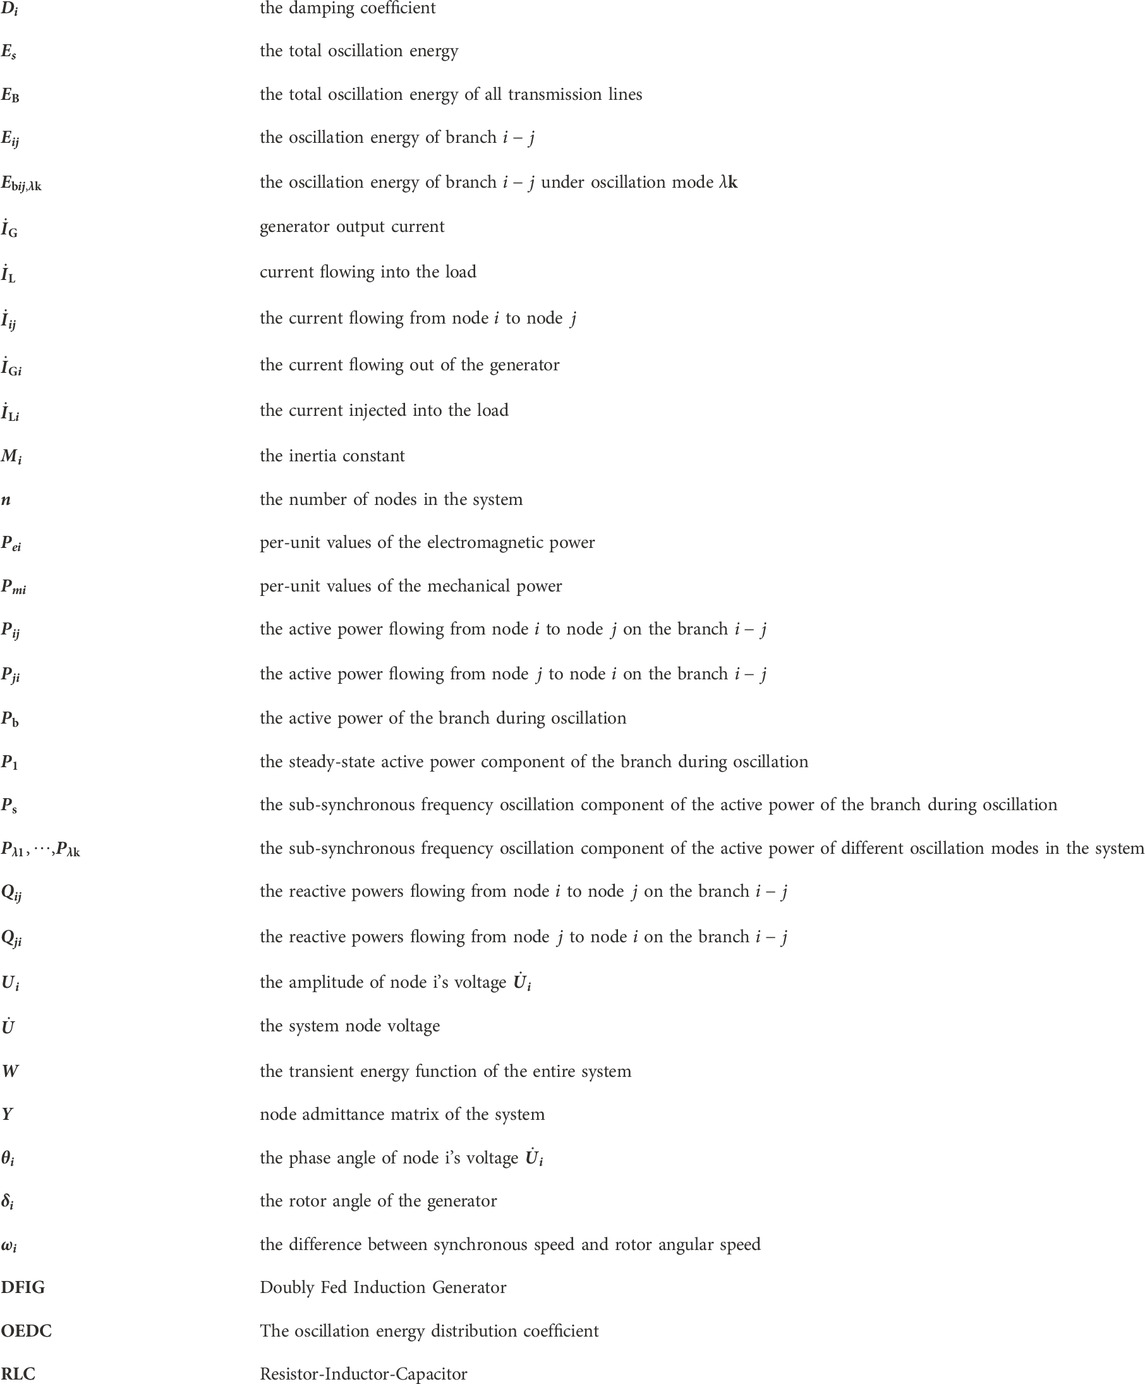
Nomenclature
Keywords: sub-synchronous oscillations, branch oscillation energy, energy distribution factor, oscillation propagation path, high-risk oscillation area
Citation: Wei Z, Sun X, Chen W and Shi J (2023) Identification of dominant propagation paths based on sub-synchronous oscillation using branch oscillation energy distribution coefficient. Front. Energy Res. 11:1240553. doi: 10.3389/fenrg.2023.1240553
Received: 15 June 2023; Accepted: 31 October 2023;
Published: 15 November 2023.
Edited by:
Xin Zhang, Brunel University London, United KingdomCopyright © 2023 Wei, Sun, Chen and Shi. This is an open-access article distributed under the terms of the Creative Commons Attribution License (CC BY). The use, distribution or reproduction in other forums is permitted, provided the original author(s) and the copyright owner(s) are credited and that the original publication in this journal is cited, in accordance with accepted academic practice. No use, distribution or reproduction is permitted which does not comply with these terms.
*Correspondence: Xuebo Sun, Ym94dWVfc2dAMTYzLmNvbQ==