 Gong Zhang1
 Shulei Bi2*
- 1Research Center for Economy of Upper Reaches of the Yangtse River, Chongqing Technology and Business University, Chongqing, China
- 2Doctoral School of Entrepreneurship and Business, Budapest Business University, Budapest, Hungary
Market structure serves as a crucial basis for government economic policies and the formulation of competitive strategies by businesses. It determines the formation of prices, the functioning of supply and demand relationships, the degree of competition, and exerts a significant influence on market economies. This paper first deduces the theoretical implications of carbon emissions trading on market structure and its regulating factors-based Theory of the Firm. It then utilizes the quasi-natural experiment of China’s pilot carbon emissions trading policy implemented in 2013, employing DID model, to empirically examine the policy effects and influencing mechanisms of carbon emissions trading on market structure. We find that carbon emissions trading policies can significantly inhibit market concentration and promote the development of market liberalization. This conclusion remains robust after a series of rigorous tests. Additionally, the analysis of dynamic effects reveals a noticeable lagged and incremental impact of carbon emissions trading policies on market structure. The negative adjustment of market concentration due to carbon emissions trading policies initiates in the policy’s starting year and gradually intensifies in the third phase. As expectations towards the policy stabilize, the negative adjustment decreases, and the short-term effects of carbon emissions trading policies are greater than the long-term effects. To verify the role of carbon emissions trading policies in influencing market structure during their implementation, a mechanism analysis based on cost and benefit perspectives is conducted. The results suggest that carbon emissions trading policies not only increase the environmental costs for industry-leading companies but also reduce the potential gains from market structure adjustments. Therefore, we propose promoting market competition, encouraging technological innovation, and strengthening transparency and regulation while considering differences in market structure. The findings of this paper provide new policy insights for promoting high-quality economic development and deepening market structure reforms in the context of the dual carbon goals.
1 Introduction
Countries and regions, such as the European Union, have adopted carbon emission trading rights as a low-cost means of effectively reducing industrial pollution (Kaushal and Rosendahl, 2021). With the rapid growth of the Chinese economy, China’s energy consumption and carbon emissions are enormous. In order to alleviate the increasing pressure of carbon emissions, the Chinese government has included the goal of reducing carbon dioxide emissions as a crucial indicator in the medium and long-term planning of national economic and social development. It actively promotes constructing a carbon emission trading market (Liu et al., 2022). For example, the Chinese government promises to strive to achieve a carbon peak by 2030 and carbon neutrality by 2060. This commitment is a milestone event in China’s response to climate change, opening a new era for the Chinese government to comprehensively transform from energy, economy, science, and technology to low-carbon with carbon neutrality as its target. In 2021, China’s carbon emission trading was officially launched nationwide. Its 2,162 critical emission units in the power generation industry covered approximately 4.5 billion tons of oxidized carbon emissions, making it the world’s largest carbon market. As of the end of 2022, the cumulative trading volume of carbon emission quotas is about 230 million tons, with a cumulative trading volume of 10.4 billion yuan (China Green Capital Market Green Book 2022). The vast scale of carbon trading offers opportunities for emerging low-carbon technology and innovative enterprises. These emerging companies may benefit from carbon emissions reduction by leveraging innovative technologies and low-carbon products to gain a competitive advantage, thereby potentially altering market structures. However, this competitive advantage can also lead to the formation of localized industry clusters, amplifying the concentration of competition. Consequently, under the implementation of carbon emissions trading policies, industrial development faces an interactive structure of competition and agglomeration.
An important issue arising from this is whether the continuous development of carbon emission trading has promoted market concentration or hindered market concentration. The answer to this question not only helps to clarify the market effects of carbon emissions trading but also affects the orientation of market antitrust policies. In order to maintain a stable, reasonable, and effective market competition structure, countries or regions such as the European Union, the United States, China, and Japan are currently strengthening economic antitrust investigations (Rozanova, 2022). However, there is still significant debate within the academic and practical communities regarding the necessity of incorporating anti-monopoly laws into carbon emissions trading. There is also debate on the objectives of market structure and how carbon emissions trading can strike a balance between the relationship between market competition and market concentration. Fan et al. (2016) based on the consideration that enterprises evaluate costs and benefits during economic transition, has developed the Enterprise ESG theory, which employs an input-output performance evaluation model. This theory suggests that sustainable development models can influence strategic decision-making and behavior of companies. While the Enterprise ESG theory explains market structure adjustments resulting from high-quality social development, it mainly focuses on corporate social responsibility and does not consider the impact of unique market regulatory policies, such as carbon emissions trading, in the context of economic transition models. Numerous market regulatory theories demonstrate that the implementation of emission trading policies, including pollution rights, water rights, and carbon emissions trading, leads to different decision-making processes for companies at different stages and periods. Notably, the oversight mechanisms by governments and third-party environmental organizations (Yan et al., 2023), as well as the influence of consumer demand for eco-friendly products on the demand side (Xie B. et al., 2022), significantly impact the adjustment mechanisms of market structures under carbon emissions trading mechanisms. Data on industrial agglomeration in developed Chinese urban clusters reveal an ongoing increase in the scale of agglomeration in the central cities of the Beijing-Tianjin-Hebei, Yangtze River Delta, and Pearl River Delta urban clusters, along with notable energy-saving and emission reduction efforts by these central cities. Emerging urban clusters such as Chengdu-Chongqing and the midstream region of the Yangtze River have also shown synergistic effects between environmental friendliness and agglomeration intensity. However, in most underdeveloped urban clusters, the scale of industrial agglomeration in central cities is decreasing. Thus, it is evident that different stages of carbon emissions trading policy implementation led to continuous adjustments in market structure. Theoretically, carbon emissions trading policies can either create competitive advantages through technological innovation or induce industry agglomeration and monopolies through technological barriers. Therefore, further theoretical and empirical research is needed to fully understand the impact of carbon emissions trading policy implementation on market structure adjustments.
Therefore, the focus of this paper is on the following questions: Did carbon emissions trading either promote or hinder the adjustment of market structures? How do the policy effects of carbon emissions trading impact market structures? What are the mechanisms of policy effects in carbon emissions trading?
Based on this, this paper conducts a quasi-natural experiment utilizing China’s pilot carbon emissions trading policy announced by the government in 2013. The study employs a DID model and selects industry enterprises related to carbon emissions published by the Chinese Ministry of Ecology and Environment from 2009 to 2021 as research samples. It empirically examines the impact of the implementation of carbon emissions trading policies on market structure and its underlying mechanisms. Relative to previous research, this study makes the following marginal contributions: ① it establishes a partial equilibrium theoretical model incorporating non-perfect competition factors, providing a theoretical analysis of the impact mechanisms of carbon emissions trading on market structure under non-perfect competition. This expands the frontiers of sustainable development theory and market structure theory; ② it investigates the effects of carbon emissions trading policies on market structure, enriching the boundaries of the regulatory measures in market-oriented environments in the era of anti-monopoly regulations. Existing studies on market-oriented regulations have seldom considered the effects on market structure. The analysis of the impact of carbon emissions trading policies on market structure, using the Chinese pilot policy as an example, serves as a useful complement to this body of literature; ③ the study identifies causal effects by exploiting changes in policy shocks over time. It effectively utilizes temporal variations in the formulation, promulgation, and implementation of carbon emissions trading policies, focusing on the dynamic effects and lagged increment effects of such policies. Furthermore, the study analyzes the short-term and long-term impacts of carbon emissions trading, providing valuable references and insights for similar empirical research methods; ④ by examining the impact of carbon emissions trading policies on market structure in the context of China, this study offers a reference case and empirical evidence for other developing countries or economic systems in formulating environmental regulatory policies and harnessing their effects.
2 Literature review
2.1 Studies on market structure
Existing research has conducted extensive discussions on market structure. Factors influencing market structure can be categorized into financial and non-financial aspects. On the financial side, several factors have been identified, including optimal capital structure (Chu, 2012), financial development (Yartey, 2008), financial technology (Khattak et al., 2022), and interest rate markets (Pan et al., 2014). On the non-financial side, factors such as strategic choices (Belkhaoui et al., 2014), security information sharing (Gao and Zhong, 2016), and corporate behavior (Khan et al., 2018) are considered. The adjustment of market structure is influenced and constrained by the interaction of capital utility and business strategies. In recent years, studies have also investigated the concentration level of market structure from the perspectives of government behavior and capital regulation in imperfectly competitive markets. These research perspectives mainly focus on individual characteristics and attributes of single factors, as well as financial and non-financial elements. However, they overlook the discussion of the impact of sustainable economic policies on market structure within the framework of economic transition models. Particularly, the research tends to stress the utility analysis of market structures, while neglecting the influence of new policy institutions that affect market structure. Consequently, in recent years, there has been an increasing focus on the impact of the transitioning economy on market structure (Bakator et al., 2019; Oh et al., 2022).
2.2 Carbon emissions trading and its impact
Carbon emissions trading is an institutional innovation and significant means to address climate change and achieve the “carbon neutrality” goal (Fang et al., 2021; Li et al., 2022). In recent years, carbon emissions trading has garnered extensive attention from scholars (Zhang and Wu, 2022; He and Zhao, 2023). Defined by previous research, carbon emissions trading is seen as a vital policy tool for addressing climate change and reducing greenhouse gas emissions (Duerkop, 1994). Existing studies have predominantly focused on the environmental benefits of carbon emissions trading, yielding a wealth of findings (Aihua et al., 2022; Ma et al., 2020). Wu et al. (2023) employed a comprehensive control approach to identify the impact of carbon emissions trading schemes on CO2 efficiency in the steel industry. They discovered that CO2 emissions efficiency increased by 5% in pilot provinces of China’s carbon emissions trading program, demonstrating the effectiveness of carbon emissions trading in reducing emissions and achieving environmental goals.
Research on the impact of carbon emissions trading primarily focuses on the effectiveness of carbon emissions trading policies and their influencing factors. It emphasizes the drivers, trading mechanisms, and trading impacts of carbon emissions trading. Studies based on economic externality theory (Hu et al., 2023), economic efficiency theory (Zhao et al., 2017; Wang et al., 2022), and sustainable development theory (Pan et al., 2020; Tsai et al., 2022) analyze the economic drivers of developing carbon emissions trading and further examine the equal importance of environmental protection and economic development during economic transition as the direct drivers of carbon emissions trading. However, the process of carbon emissions trading will affect and change various aspects of socio-economic forms (Leimbach; Toth, 2003; Shaheen et al., 2019). The impact mechanism of carbon emissions trading is not a one-way and linear process. Dissanayake et al. (2020) summarizes it as a synergistic growth model, where the implementation of carbon emissions trading pilot policies promotes technological innovation, upgrades industrial structure, and generates synergistic effects with related environmental policies to achieve a sustainable economic development model with ecological and environmental considerations. Consequently, the impact of carbon emissions trading mainly focuses on factors such as green total factor productivity of enterprises (Shao et al., 2023), the achievement of regional “carbon neutrality” goals (Li et al., 2022), and energy efficiency (Hong et al., 2022). It is evident that research on carbon emissions trading is primarily based on the environmental benefits of carbon emissions trading policies and mainly focuses on the macro-regional or micro-enterprise dimensions, lacking the study of utility and its impacts on the meso-industrial dimension.
2.3 Carbon emissions trading and enterprise competition
Under the context of carbon emissions trading, the relationship between the two has received significant attention. Firstly, from the perspective of the enterprise development cycle, Xue & Sun, (2022) argue that market-based environmental regulations have limited stimulating effects on enterprise competition, with more influence exerted in the short term through the form of social responsibility constraints on business development. However, Huang et al. (2022) found that on one hand, high carbon-emitting enterprises may face periodic transformations and adjustments, resulting in increased product costs and loss of existing market positions. On the other hand, the development of low-carbon industries and the promotion of clean technologies may create new industrial opportunities. Enterprises adopting new energy-saving and carbon-reduction technologies may gain market favor due to their environmentally friendly products, swiftly capturing market share. Thus, the implementation of carbon emissions trading may lead to cyclic adjustments and turbulence in the competitive structure of the enterprise market, with inherent heterogeneity in its effects. Zhou & Xu, (2023) based on two scenarios - mature emission reduction technologies and immature emission reduction technologies, find that carbon trading has different outcomes on the output and market power of oligopolistic enterprises. When emission reduction technologies are not mature, the greater the ratio of initial carbon emissions coefficients between the follower enterprises and the leader enterprises, the more favorable carbon trading is to enhance the market power of the leader enterprises, thereby widening the market power gap among enterprises. When emission reduction technologies are mature, the greater the ratio of initial carbon emissions coefficients between the follower enterprises and the leader enterprises, the more favorable carbon trading is to enhance the market power of the follower enterprises, thereby narrowing the market power gap among enterprises.
Secondly, from the perspective of supernormal profits, in a perfectly competitive market, the market-clearing price of carbon emissions trading equals marginal governance costs (Jung et al., 2021), making it unlikely to have debates about supernormal profits. The industries primarily affected by carbon emissions trading are concentrated in energy and manufacturing sectors, making it difficult to achieve a perfectly competitive market structure. Therefore, the policy effects of carbon emissions trading on enterprise competition are limited in a perfectly competitive market. In contrast, imperfectly competitive markets are more aligned with the realities of socio-economic development. Xie L. et al. (2022) found that under imperfect competition, different industries are affected differently, with the electricity industry able to obtain supernormal profits. Xu & Li, (2023) indicate that if the product market is dominated by oligopolies, government regulation may lead to a reduction in enterprise competition. These findings highlight that under the influence of carbon emissions trading, the impact of different market efficacies on enterprise supernormal profits varies.
Based on the comprehensive review of existing literature, many scholars have conducted in-depth research on carbon emissions trading, providing valuable insights for this article. However, there are still some limitations. Firstly, most existing studies focus on the basic functionality of carbon emissions rights, namely, whether they can achieve environmental goals, but whether carbon emissions trading policies have an impact on the overall structure of industry markets from a policy mechanism perspective remains to be verified. Secondly, the research on carbon emissions trading policy tends to be biased towards the enterprise or regional level, with either overly macro or overly micro perspectives, Lack of analysis on the policy impact of carbon emission trading from a mid-level perspective in the industry. Thirdly, although the heterogeneity of the impact of carbon emissions trading on enterprise supernormal profits has been noted due to different development cycles and market efficacies, there is a lack of in-depth research from the perspectives of cyclical dynamics and supernormal profits. In fact, according to the categories of enterprise development cycles, they can be divided into long cycles and short cycles, and supernormal profits can also be further decomposed into excess revenue and costs. After considering the implementation of carbon emissions trading policies, different cycle lengths and cost/revenue mechanisms will affect the market structure of enterprise competition.
3 Institutional background and theoretical analysis
3.1 Institutional background
Since 2013, China has led in conducting carbon emission trading pilot projects in seven provinces and cities, including Beijing, Tianjin, Shanghai, Chongqing, Guangdong, Hubei, and Shenzhen. As of the end of June 2021, this pilot project has covered nearly 3,000 key emission units in more than 20 industries, such as electricity, steel, and cement. The cumulative quota trading volume has reached 480 million tons of carbon dioxide equivalent, with a trading volume of up to 11.4 billion yuan. At the same time, many enterprises have reduced their emissions through energy-saving transformation and sold the saved emission quotas, achieving emission reduction and economic benefits. In this situation, many people call for establishing a unified carbon market. Therefore, China launched a national carbon emissions trading market in 2021, which may make it the world’s largest carbon emissions trading market, surpassing the European Union.
3.2 Theoretical analysis
3.2.1 Theoretical model
Firstly, assume that the marginal cost of all manufacturers in a particular industry is MC, and the fixed cost is FC. Considering that China is an essential link in the global economic and trade value chain, it is necessary to consider factors such as import and export before implementing carbon emission trading pilot projects. The export price of the product is EP, the domestic price of the product is DP, and the import price of the product is IP; When EP = DP, Q is the total production, DQ is the domestic sales volume, EQ is the export volume, and IQ is the import volume. Based on the above assumptions, Equations 1, 2 can be easily obtained:
In Equation 2, DDQ represents the demand for domestic products.
Considering that after the implementation of the pilot policy for carbon emissions trading, the related profits and losses generated by carbon emissions trading will affect the marginal production costs of manufacturers in the industry, mainly manifested in two ways: firstly, the cost of carbon emissions trading, which is related to the assumption that the carbon emissions trading price is
In Equation 3,
Furthermore, considering the impact of carbon emission trading policies on domestic production, it is:
3.2.2 The effect of carbon emission trading on profits
Assuming that carbon emission rights refer to the EU ETS free allocation model (Zhang and Wei, 2010), there needs to be more correlation between corporate carbon rights quotas and previous emissions and product production efficiency. So, the profit attributable to the manufacturer = product revenue - marginal production cost - carbon rights cost - fixed cost + free carbon quota. The decision-making model is as follows:
Where
According to the equilibrium conditions of Equation 8 and Eq. 9, Eq. 10 can be obtained by performing full differentiation on Equation 7 to obtain the
From Equation 9, the price of carbon emissions trading affects manufacturers’ profits. In equilibrium conditions
3.2.3 The effect of carbon emission trading on market structure
①The impact of carbon emission trading on individual market share of manufacturers.
Due to
②The impact of carbon emission trading on industrial market share. After implementing carbon emission trading policies in China, when foreign manufacturers have a relative advantage in price competition, the industry market share is represented by
Obviously,
To further investigate the impact of cost and revenue mechanisms on firms’ market share under carbon emissions trading, this study utilizes numerical simulations. The following assumptions are made: Ⅰ. The variation in firms’ market share is influenced by multiple factors, including carbon emission reduction rate and industry concentration. These factors are reflected through cost and revenue mechanisms, which affect the changes in firms’ market share.Ⅱ. At the initial stage, all companies have an equal distribution of market share, meaning each firm starts with the same market share.Ⅲ. The simulation is conducted over a fixed time period, and at the end of each period, the changes in market share are calculated.Ⅳ. The firm’s market share for each period is obtained by averaging multiple simulation runs.
Based on the market share simulation and prediction research by John D.C. Little, this study sets a fixed simulation period of 10 periods and defines the number of firms as 100. Following Equations 11, 12, different equilibrium conditions of
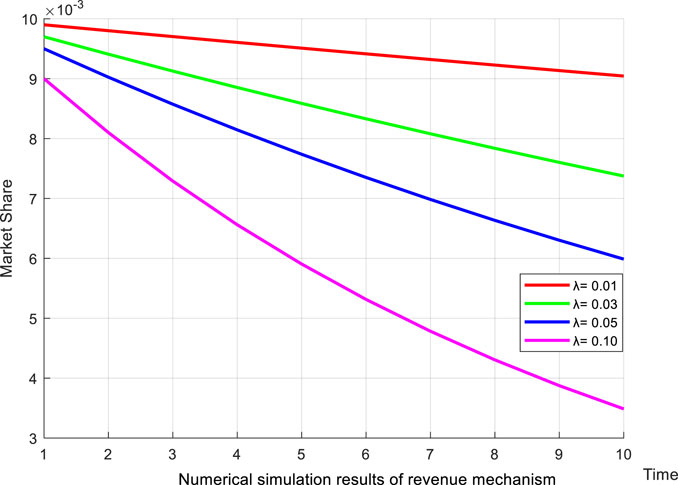
FIGURE 1. Numerical simulation results of revenue mechanism.
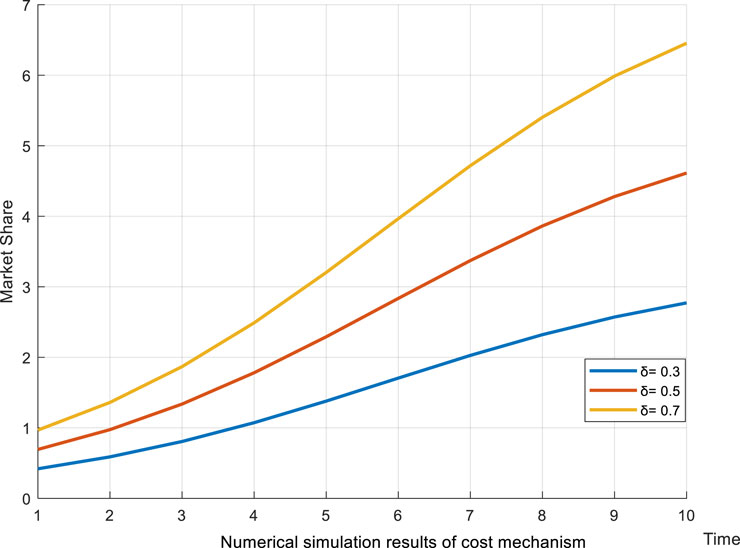
FIGURE 2. Numerial simulation results of cost mechanism.
In summary, this article proposes Hypothesis 1 and Hypothesis 2 based on the above analysis.
Hypothesis 1. Implementing carbon emission trading policies will suppress market share, and the higher the carbon emission trading price, the more significant the negative impact on market share.
Hypothesis 2. The implementation of carbon emission trading will affect market structure by regulating industrial profits; The higher the price of carbon emissions trading, the greater the negative effects on manufacturers. The more significant role of carbon emissions trading is adjusting market structure by affecting profits (costs and benefits).
4 Research design
4.1 Samples and data
This article mainly takes enterprises related to carbon emissions released by the Ministry of Ecology and Environment of China from 2009 to 2021 as research samples Determination of carbon emission and noncarbon emission industries: Since industries related to carbon emissions are mainly concentrated within specific industries such as manufacturing, construction, and energy, the research subjects are the eight significant sub-sectors of petrochemical, chemical, steel, building materials, papermaking, aviation, electricity, and non-ferrous metals in various provinces and cities as key testing industries (Du and Lin, 2018). Moreover, based on this, distinguish between carbon-emitting and non-carbon-emitting industries in the text. Except for the eight major industries mentioned above, all industries are considered non-carbon-emitting industries Determination of carbon emission enterprises: Based on the industry mentioned above differentiation standards and in combination with the 2022 requirements for enterprise greenhouse gas emissions management by the Ministry of Ecology and Environment of China, this article manually organizes and collects the list of carbon emission control enterprises announced by corresponding provinces and cities. Specifically, suppose a specific enterprise belonging to the carbon emission industry in each province and city meets any of the following conditions. In that case, it will be considered a carbon emission enterprise: whether it belongs to the province’s carbon quota payment enterprise, is it a carbon quota clearing enterprise in the local power generation industry; Is it a critical emission enterprise in the local power generation industry, Is it a critical emission enterprise within the province? In order to ensure the caution and stability of the selected samples, combined with the listing situation of financing platforms such as the Shanghai and Shenzhen Stock Exchanges or the New Third Board in the above list of enterprises, and considering that some listed companies have listed later than the policy implementation year, and the published data cannot cover the impact of factors such as the selected year in the experiment, this article excludes the following conditional enterprises: enterprises that have been deregistered by the Ministry of Ecology and Environment of China in the selected samples; Enterprises that cannot obtain reliable data. Finally, this article’s double difference basic sample data includes 50 pilot provinces and cities, and 75 nonpilot provinces and cities, totaling 125 enterprises.
The relevant financial information and provincial and municipal data of enterprises are mainly obtained from the China Stock Market and Accounting Research Database (CSMAR), Wind Database, China Statistical Yearbook, China Energy Statistical Yearbook, China Labor Statistical Yearbook, and national economic and social development statistical bulletins of local governments in various provinces and cities.
4.2 Variable description
Division of treatment group and control group: Based on the specific list of enterprises in the pilot policy of carbon emission trading, this article selects carbon emission enterprises from 7 pilot provinces and cities implemented in 2013 as treatment groups and assigns them as virtual variables with a value of 1; The key listed companies on the noncarbon emission list of pilot provinces and cities are used as the control group, and assigned a value of 0.
Market structure: Market structure variables mainly refer to the market structure within the industry rather than specific market structures related to antitrust enforcement case reviews. Considering the research objectives of this article and previous relevant studies, it is feasible to use the Herfindahl-Hirschman Index (HHI) to measure the market structure faced by enterprises. Firstly, the HHI is an indicator that measures the market power of firms in a given market. A higher HHI indicates a stronger monopoly power in the market, while a lower HHI indicates a higher degree of market competition. Secondly, the HHI is a relatively easy-to-obtain metric that can be calculated using data such as market share and price elasticity. Although the HHI is based on the assumption of market competition and may not be applicable to certain industries or situations with special market structures or industry characteristics, it appears that the selected carbon-emitting companies in this article do not involve significant market distortions or special market structures and industry characteristics in both pilot and non-pilot regions. Therefore, using the HHI as a basis for measuring the market structure variable can effectively reflect the impact of the implementation of carbon emissions trading on the market structure. The calculation of the HHI can refer to the method proposed by Chen & Wang, (2015), and calculates the Lerner index with [(sales volume - operating costs - selling expenses - management fees)/sales volume]. The deviation rate between price and marginal cost expresses the original Lerner index. Considering that it is impossible to obtain the marginal cost value of enterprises accurately, we can only refer to previous research practices and take its approximate value. The higher the Lerner index, the stronger the pricing power of the company in the industry, the higher its competitive position, and the more concentrated the market structure.
Selection of control variables: Based on reference to relevant research (Chen et al., 2021; Chen and Lin, 2021). This article mainly selects control variables from two aspects: the internal characteristics of the enterprise and the external environment. The internal characteristics are the total Asset turnover, enterprise age, enterprise ownership form, enterprise scale, technical level, and asset liability ratio that reflects the company’s operation as control variables. The enterprise scale is mainly measured by taking the natural logarithm of total assets; The external environmental factors mainly include the Tobin Q value of the enterprise and audit intensity. The specific definitions of each variable are shown in Table 1.
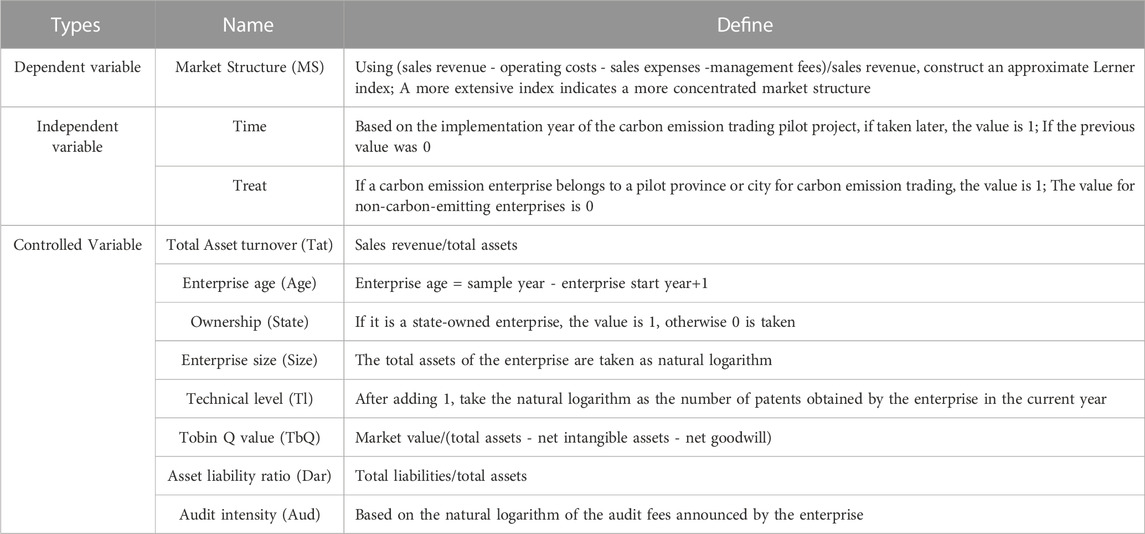
TABLE 1. Variable definition.
4.3 Research design
The research purpose of this article is to explore the impact of implementing carbon emission trading policies on market structure. Referring to existing research (Lu and Luo, 2020), this article uses the double difference method to analyze the implementation effect of carbon emission trading policies. The double difference method is chosen because it can effectively overcome the endogeneity problem to a certain extent (Zhou et al., 2019). The control group is the enterprises in the carbon emission trading pilot’s area, and the control group is the non-carbon emission enterprises in other pilot areas. The impact effect of the policy is empirically tested by comparing the changes in the market structure before and after the implementation of the carbon emission trading pilot’s policy. The specific model settings are as follows:
Among them, t represents the year, i represents the enterprise, and the dependent variable
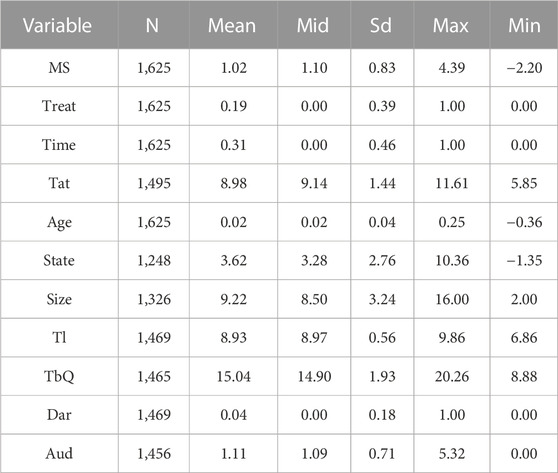
TABLE 2. Descriptive statistical results.
5 Empirical analysis
To more clearly reflect the framework structure of this section, a flowchart is used, and Figure 3 comprehensively displays the main structure and research objectives of this section.
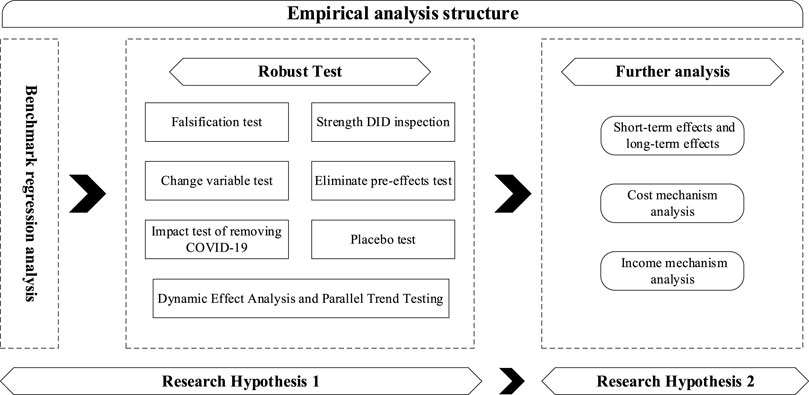
FIGURE 3. Empirical analysis structure.
5.1 Benchmark regression analysis
First, we study the changes in the market structure of critical enterprises in pilot areas before and after implementing carbon emission trading policies. The regression results are shown in Table 3. In column 1), only the core explanatory variable is added, and the coefficient of result
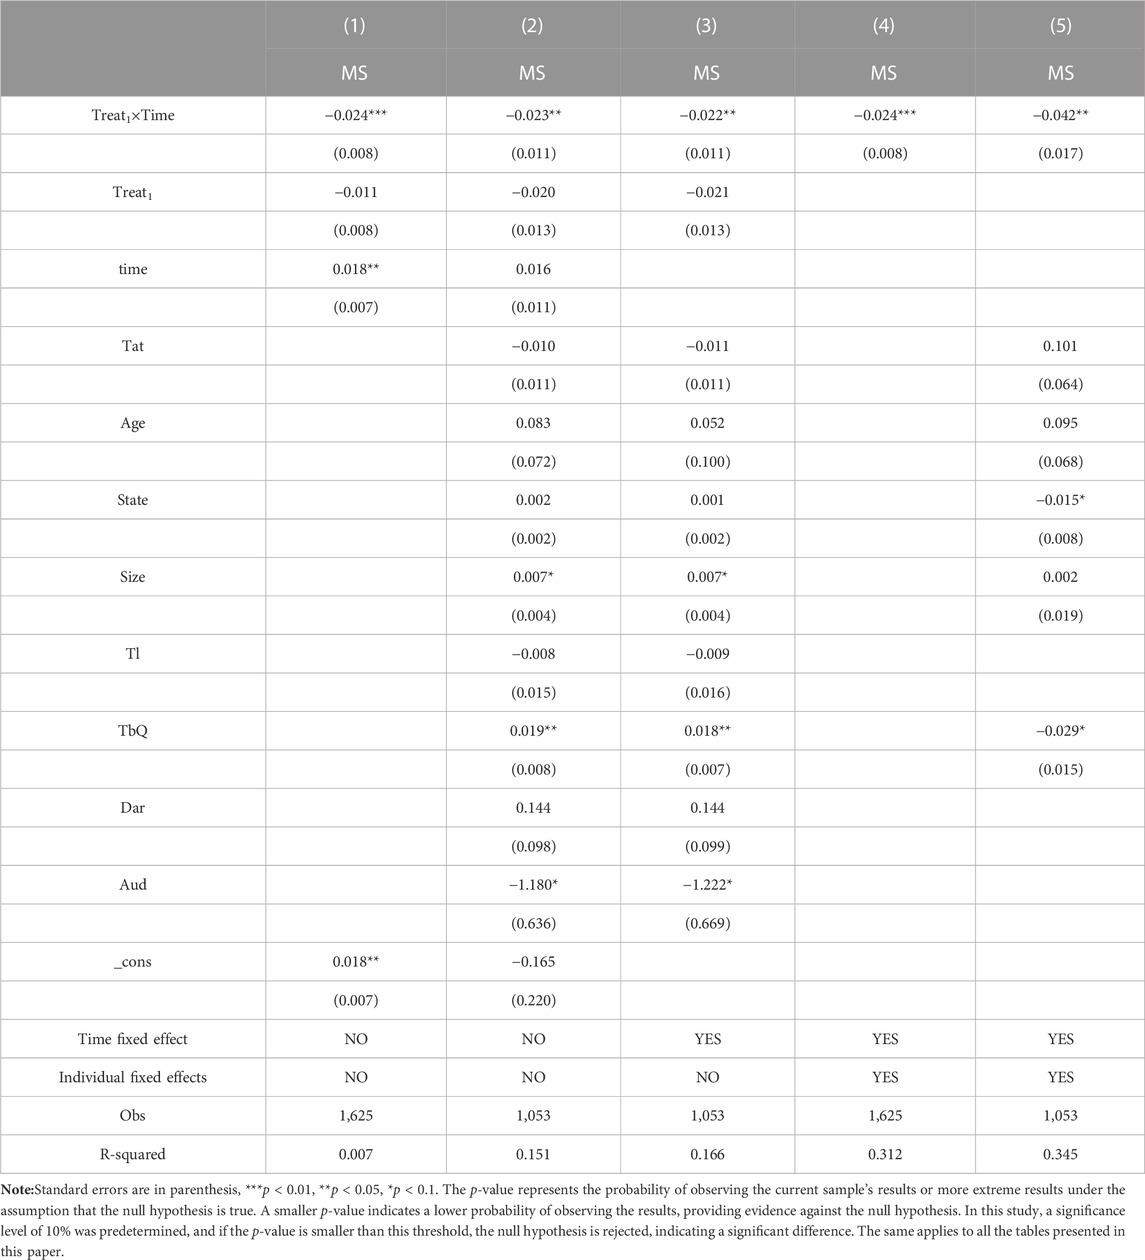
TABLE 3. Regression results.
5.2 Robustness test
In order to test the reliability of benchmark regression results, this paper conducts the following robustness tests.
(1) Falsification test. Selecting similar enterprises in nonpilot areas of carbon emission trading policies as pseudo-experimental groups and substituting them into the benchmark regression model, if the estimation coefficient of enterprises in nonpilot areas is significantly negative, it indicates that there are other interference terms in the impact of carbon emission trading on market structure; On the contrary, if the estimated results are not significant, it indicates that the benchmark regression conclusion is supported. The results are reported in column 1) of Table 4. The results show that the estimated coefficient in column 1) is −0.015 and not significant, which also confirms the benchmark regression results from a reverse perspective.
(2) Strength DID inspection. Referring to Zhang, Liu, and Fu (2023)’s method, a strength DID model is constructed (Zhang et al., 2023), which measures the degree of concentration in the industry market structure by using the mean of the Lerner index of enterprises within the 2 years before implementing carbon emission trading policies. Then, an interaction term is generated by multiplying it with time dummy variables for model estimation. From the estimated coefficient result of column 2), it can be found that the coefficient obtained is positive 0.009 and has no statistical significance, which effectively supports the robustness of the benchmark regression results.
(3) Change variable test. In order to eliminate the estimation error caused by the variable setting problem in the benchmark regression model, we choose the industry concentration ratio to measure the market structure enterprises face. The industry concentration ratio is calculated by the sum of the market shares of the industry’s three most significant and five largest enterprises and is represented by ICR3 and ICR5. It can be seen from the estimated coefficients in columns 3) and 4) of Table 4 that the estimated results are still significantly negative after replacing the dependent variables, indicating that the implementation of the carbon emission trading policy will lead to the decline of the market share of the top 3 and top 5 enterprises in the industry, thus effectively reducing the market concentration ratio, which supports the conclusion of the benchmark regression.
(4) Eliminate pre-effects test. Chan, YT found that a policy usually has a corresponding pre-effect before implementation (Chan, 2020), so carbon emissions trading policies may also have a certain pre-effect before implementation, which can lead to an underestimation of the policy effect of carbon emissions trading. Therefore, this article excluded the period for formulating and publicly collecting opinions on carbon emissions trading policies in the regression sample (2011–2012) and reported the regression results in column 5) of Table 4; the estimated coefficient in column 5) is −0.062, which is significant at the 1% level, and the absolute value of the coefficient has also significantly improved, further supporting the robustness of the benchmark regression results.
(5) Impact test of removing COVID-19. Considering the sudden impact of the COVID-19 epidemic on the whole market (Cox and Woods, 2023), in order to exclude the impact of the COVID-19 epidemic on policy implementation data, this paper excludes the samples in 2020 and 2021. The results in column 6) of Table 4 show that the estimated coefficient is −0.050, which is significant at the 1% level. Compared with the benchmark regression results, the absolute value of the coefficient also increases significantly, which proves the robustness of the benchmark regression results.
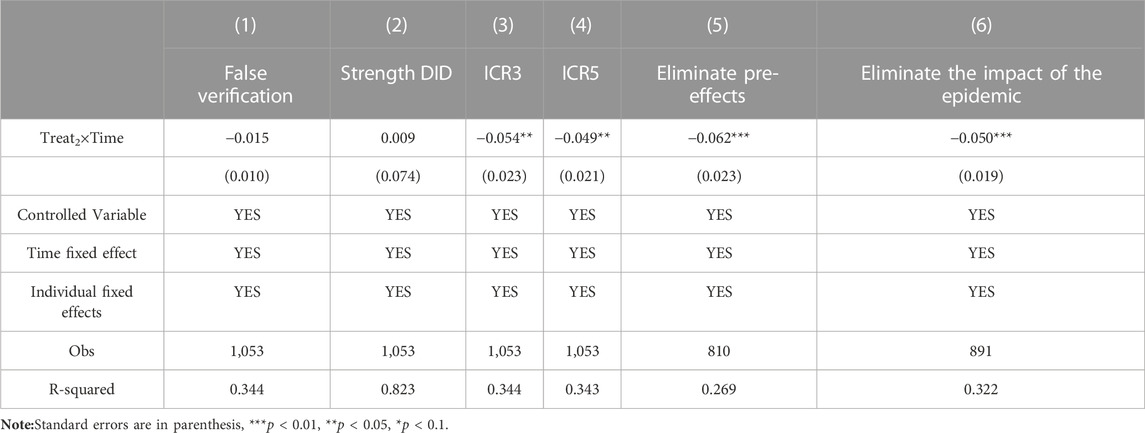
TABLE 4. Regression results.
(6)Placebo test. Considering certain random factors, especially when the sample size is small, may affect the benchmark regression conclusion. As one of the placebo test methods, the substitution test can effectively help distinguish whether the estimated results are statistically significant or randomly generated (Hasegawa and Tango, 2009; Silverman et al., 2019). In the placebo test, the original hypothesis was that carbon emission trading policies had no significant impact on market structure. Under the original assumption, the estimated coefficients from real data can be considered as random samples of envelope distribution so that statistical inference can be made based on the envelope distribution of the estimated coefficients through permutation testing. This article randomly assigns the implementation dates of carbon emission trading policies to various enterprises and randomly sets up an experimental group of carbon emission enterprises. Specifically, referring to Ma, Wu, and Fang (2023)’s method, this article adopts the indirect placebo test method (Ma et al., 2023). The logic is to make the targets of carbon emission trading policies random and find an erroneous variable that theoretically does not affect the outcome variable. Under this premise, if the coefficient estimation result is not 0, it indicates that the estimation result in this article is biased. The experimental method randomly generates a list of carbon emission companies, resulting in an incorrect estimation coefficient. Then, repeat this process 500 times and draw a distribution map of 500 estimation coefficients. According to the results of the placebo test in Figure 4, it can be found that the estimated coefficient of the randomly assigned experimental group objects is distributed near the value of 0, obeying the characteristics of normal distribution. The estimated coefficient belongs to the outlier, which conforms to the expected effect of the placebo test.
(7) Dynamic Effect Analysis and Parallel Trend Testing. While the Difference-in-Differences (DID) method can effectively address endogeneity issues in policy evaluations, it relies on a series of important assumptions. One crucial prerequisite for using the DID method is the parallel trends assumption, which requires that in the absence of external policy effects, the outcome variables of the treatment group and the control group should follow the same trend, ensuring comparability between the two groups. In this study, the baseline year is set as 2009, and the trend of market structure changes and parallel trends of carbon-emitting companies are depicted from 2010 to 2021, before and after the implementation of carbon emissions trading policy. As shown in Figure 5, it is observed that the estimated coefficient of the influence of carbon-emitting companies on market structure is greater than 0 in 2010. However, after the government announced the pilot policy for carbon emissions trading in 2011, the coefficient started to transition from positive to negative. Since the official implementation of carbon emissions trading policy in 2013, the overall trend of the estimated coefficient has gradually magnified with the implementation of the policy, thus further supporting the findings of the baseline regression. The parallel trends plot in Figure 6 also reveals that prior to policy implementation, the development of market structures in both groups remained consistent, but significant changes in the trends of market structures were observed after the implementation of carbon emissions trading policy. These differences persist in certain years until 2021. The parallel trends test and dynamic analysis results further support the findings of the baseline regression.
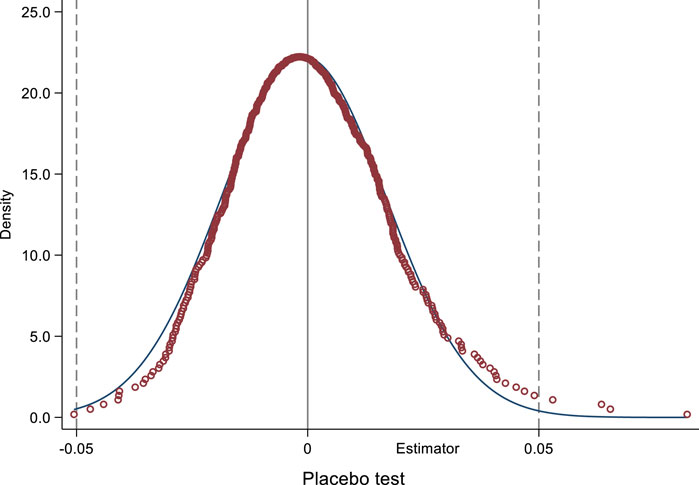
FIGURE 4. Placebo test.
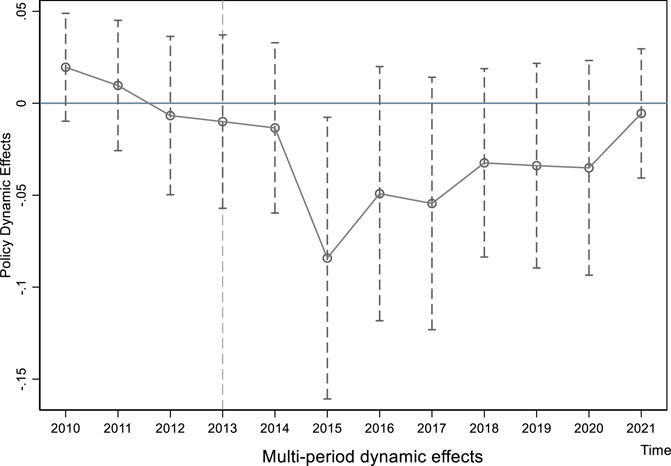
FIGURE 5. Multi-period dynamic effects.
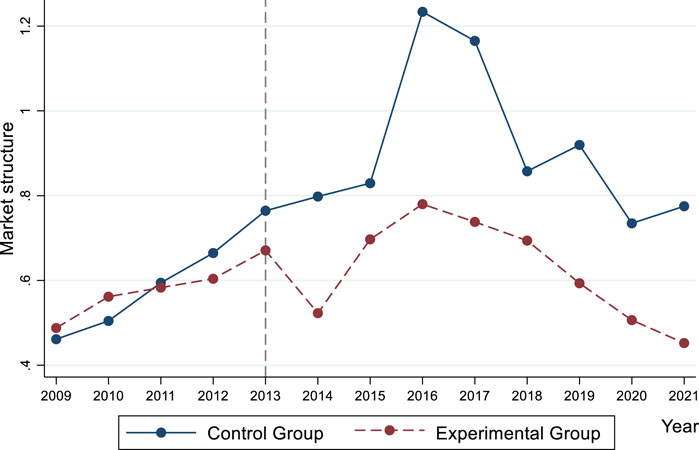
FIGURE 6. Parallel trend inspection chart.
5.3 Further analysis
(1)Short-term effects and long-term effects. Considering the impact of policy effects, there are both short-term and long-term characteristics. Therefore, referring to the methods of SMITH, JM, and BENNETT, R, this article, based on the benchmark regression model (Smith and Bennett, 1992), uses the variable Time3 to represent the short-term implementation of carbon emission trading policies (assigned as 1 from 2013 to 2015, and 0 for other years); The variable Time4 represents the long-term implementation of carbon emission trading policies (assigned as 1 from 2019 to 2021, and 0 for other years). The estimated coefficients of the two variables and the product term of carbon emission enterprises reflect the short-term and long-term effects of carbon emission trading policies. From column 1) of Table 5, the estimated coefficient of short-term effects is −0.048, which is significant at the 1% level; The estimated coefficient for long-term effects is −0.035; The above results indicate that the implementation of carbon emission trading policies has a strong negative impact on the market structure in the short term, which can effectively alleviate market concentration and monopoly. Over time, this negative impact will gradually decrease. From a statistical perspective, firstly, the absolute value of the estimated coefficient has decreased, and secondly, its significance level is no longer significant. At the same time, this discovery also confirms the dynamic effects in Figure 5.
(2) Cost mechanism analysis. This part of the analysis will conduct empirical tests from two aspects:
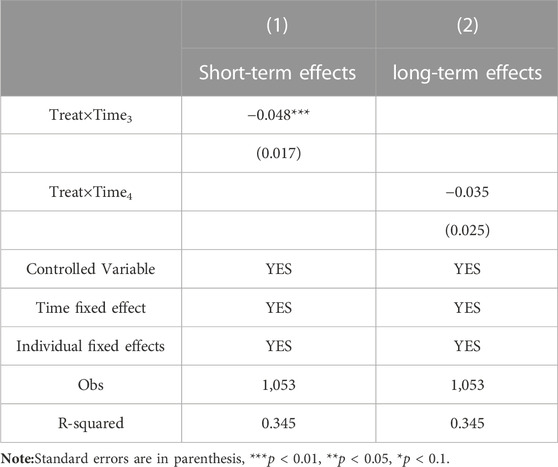
TABLE 5. Regression results.
① the strictness of carbon emission rights regulation and the sensitivity of inter-enterprise operations. The implementation of carbon emission trading policies cannot be separated from strong government enforcement efforts, and the enforcement efforts in various regions are mainly reflected in the punishment of ignoring the rules of the carbon emission trading market. Usually, in the early stages of policy implementation, opposition and obstacles from vested interest groups are encountered (Jiang et al., 2022). In theory, the lower the intensity of policy implementation, the higher the probability of enterprises ignoring policy provisions, the lower the probability of actively participating in carbon emission trading mechanisms, and the higher the probability of being punished when encountering sudden inspections (Yu and Li, 2020). In order to quantify the regulatory strictness of carbon emission trading policies and refer to Shen’s approach, this article uses whether the sample enterprises have received administrative penalties related to environmental regulations as the classification standard (Shen, 2022). It uses the number of penalties imposed on enterprises after implementing carbon emission trading policies to reflect the administrative supervision intensity (ASI) index. If enterprises have received more administrative penalties, it indicates that the local administrative supervision intensity may be higher, the higher the cost of reflecting the transaction of carbon emissions rights for enterprises. The results in column 1) of Table 6 show that the estimated coefficients of the core explanatory variable and interaction term are significantly negative at the 5% level, indicating that under the strict supervision of the local government, the pressure on enterprise costs is greater. Implementing carbon emission trading policies also has a greater negative impact on the market structure by adjusting profits, which is consistent with the results derived from the previous theoretical analysis.
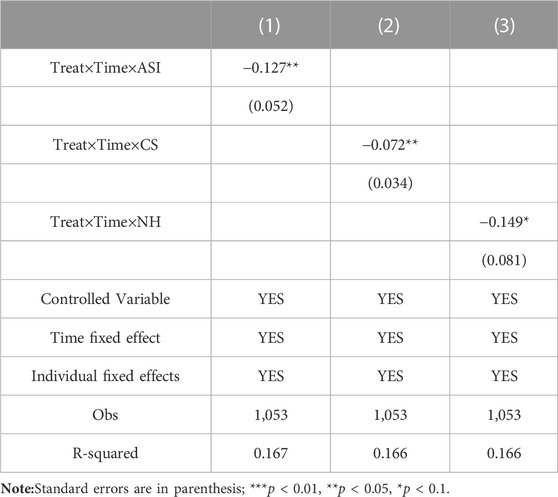
TABLE 6. Regression results.
② Referring to the methods of Yang and Wu, this article uses two indicators to reflect the sensitivity of inter-enterprise operations. One is to use the indicator of competition and interaction within the industry, namely, the sensitivity of business strategy between enterprises (CS) (Yang and Wu, 2009), mainly based on the sensitivity of changes in enterprise sales revenue (including sales and management expenses) to its competitors. Suppose the abnormal change in sales revenue of enterprise i from year t-1 to year t is NXit, that is, the difference between the annual change in sales revenue of enterprise i and its industry’s average annual change in sales revenue. The changes can be attributed to corporate behavior’s impact on its competitors’ behavior, commonly replaced by the sum of corporate sales and management expenses (SAM). In this case, the following regression model can be established by industry (n is the number of companies in a certain industry from year t-1 to year t):
Where j represents the industry in which the enterprise is located, i represents the individual enterprise, and t represents the corresponding year. Due to the interaction of competition, the estimated coefficient of enterprise competitor response (
The second is to adopt the degree of similarity in business operations between enterprises (NH) (Wu and Wang, 2009).
Where j represents the industry in which the enterprise is located, i represents the individual enterprise, and t represents the corresponding year. From the results in columns 2) and 3) of Table 6, the estimation coefficients of the core explanatory variables and interaction terms are still significantly negative, indicating that the higher the sensitivity of enterprise operations, the greater the negative impact of the implementation of carbon emission trading policies on market structure. Based on the estimated results in Table 6, regulatory costs and business sensitivity will adjust profits through cost, impacting the market structure. This conclusion effectively supports hypothesis 2.
(3)Income mechanism analysis. Concerning Sunaryo D and Lie D’s method, this part will carry out empirical tests from two aspects of the income of carbon-emitting enterprises and the utilization of advertising business: ①Measure the income of carbon-emitting enterprises from two dimensions of total return on assets (RTA) and net return on assets (ROA) (Lie et al., 2020; Sunaryo et al., 2022). The larger the values of the above two indicators, the better the enterprise’s profitability. The results in columns 1) and 2) of Table 7 show that the estimated coefficients of interaction terms are significantly negative, indicating that as the revenue situation of carbon-emitting enterprises improves, the negative impact of the implementation of carbon emission trading policies on market agglomeration increases, which is conducive to breaking the price monopoly status of traditional industry leading enterprises and achieving a gradual transition from centralized monopoly to a situation where monopolistic competition is combined, which is consistent with the theoretical prediction in this article. ②Measure the degree of utilization of enterprise advertising business by the proportion of sales expenses to operating revenue (Nguyen Thi Phuong & Nguyen Thi Vo, 2021). The results in column 3) show that the estimated coefficient of the interaction term is significantly negative, indicating that the greater the sales advertising intensity of carbon-emitting enterprises, the more significant the negative impact of carbon-emission trading policies on market structure through income adjustment. The estimated results in Table 6 further support the conclusion of Hypothesis 2.
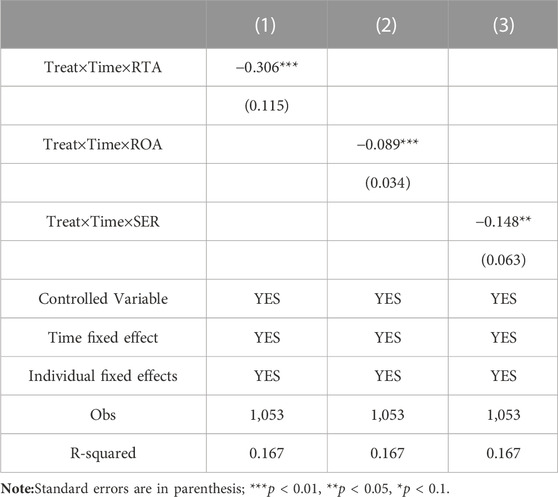
TABLE 7. Regression results.
6 Discussion
As the contradiction between environmental protection and economic development becomes increasingly prominent, many countries are facing the dual challenges of irrational market structure and frequent environmental problems. Adopting a high-quality development model has become a global consensus. According to data from the National Bureau of Statistics of China, China’s carbon emissions increased from about 250 million tons of carbon dioxide in 2000 to about 11.48 billion tons of carbon dioxide in 2022. Meanwhile, during the same period, the market concentration of many industries in China has also increased, calculated by operating income. For example, the market concentration of the automotive industry has increased from the top five enterprises accounting for 67% in 2010 to 78% in 2022. Similar situations have also occurred in industries such as petrochemicals and steel. Therefore, the implementation of carbon emissions trading policies plays an extremely important role in the whole process of market structure adjustment. However, China is not the only country using carbon emissions trading policies to influence market structure. Other countries, such as the United States and the European Union, also recognize the importance and necessity of carbon emissions trading policies (Anke et al., 2020; Ayad et al., 2023). Some countries incorporate sustainable development requirements into the regulation of market monopolies and unfair competition. For example, antitrust agencies can consider a company’s environmental benefits and sustainable development measures to assess the impact of market competition on environmental issues and take corresponding regulatory measures (Ansari et al., 2020). This is of great significance for promoting the healthy development of market structure and ecological environment. However, many businesses and economic entities tend to pursue short-term benefits and pay less attention to long-term environmental sustainability. Conflict often exists among different stakeholders when dealing with market structure and environmental issues. Moreover, achieving sustainable development requires addressing various challenges in technology and economics. The high-quality development model that leads to the realization of market structure and energy saving and carbon reduction still faces many severe adjustments.
However, as companies implement green production methods, their expected market share is likely to be affected. As a result, many companies still choose to use production methods that do not prioritize emission reduction unless it is absolutely necessary (Azam et al., 2022). Market-based environmental regulatory policies have emerged in this passive environment (Zhang et al., 2020). Meanwhile, a significant amount of literature primarily focuses on whether market-based environmental regulatory policies have a significant impact on environmental benefits. Many scholars affirm the importance of such policies for energy conservation and emission reduction (Ke et al., 2022; Pan et al., 2021). Lei et al. (2022) believes that the carbon emissions trading policy implemented in 2013 can optimize the manufacturing structure of Guangdong Province by improving technological innovation of enterprises and increasing foreign direct investment. The research findings support the conclusion of this study, which suggests that carbon emissions trading policies have a positive impact on market structure. However, Constantatos & Herrmann, (2011) argue that the introduction of environmental regulatory policies has a weak impact on market share. The effectiveness of environmental regulatory policies depends on the strength of policy implementation, the environmental context, incentive mechanisms, and penalties, among other factors (Peng et al., 2021; Wahab, 2021). Therefore, this study examines the impact of market-based environmental regulation from a new perspective, using the 2013 carbon emissions trading pilot policy as the basis for comparison. It focuses on carbon-emitting companies and non-carbon-emitting companies in the pilot areas, using the DID method to study the influence of carbon emissions trading policies on market structure within the industry. The study found that carbon emissions trading policies can significantly reduce the Lerner Index, effectively alleviating market concentration and adjusting market structure. Through robustness tests, it was discovered that the implementation of carbon emissions trading policies has a clear lagged and incremental effect on market structure. As policy uncertainty increases, the influence of carbon emissions trading policies on market structure also gradually increases. Additionally, Li & Wang, (2022) argues that the dynamic characteristics of policy mechanisms should be considered in studies on the impact of market-based environmental regulation, and the extension of its conclusions is of great significance. This study explores the entire process of the impact of carbon emissions trading on market structure based on its dynamic effects. It shows that the negative impact of carbon emissions trading policies on market structure has already begun to appear within 3–5 years after their implementation, starting in 2013. In 2014, this negative effect significantly increased. This may indicate increased uncertainty among industry-leading companies regarding their expectations of carbon emissions trading policies. However, as the leading companies, which hold the dominant market position, stabilize their expectations of the policy, the negative impact of carbon emissions trading policies on market structure decreases, as seen in the changing trend between 2015 and 2016. From 2015 onwards, this policy effect continues to decrease year by year. The reason for this may be attributed to the Chinese government’s implementation of the “supply-side structural reform” beginning around 2016 (Ren and Miao, 2022). This reform signifies a revolutionary change in the regulatory framework of market structure in various sectors after 3 years of implementing carbon emissions trading policies. Compared to the prior period characterized by “barbaric growth,” future growth in market share for companies is expected to be more focused on the widespread application of environmentally friendly and energy-saving technologies (Huang, 2019).
In terms of the impact mechanism, Dong et al. (2022) analyzes the spatial mechanism of carbon emissions trading, while this study finds that the implementation of carbon emissions trading policies mainly regulates corporate profits through cost mechanisms and revenue mechanisms, thereby significantly affecting market structure. This conclusion aligns with the theoretical basis that businesses aim to maximize profits (Hoque et al., 2018). Due to the ongoing transformation of China’s economic growth model, companies need to thoroughly adjust and transform their business models, replacing environmentally unfriendly and unscientific production methods with energy-saving and green alternatives (Ge et al., 2023). Achieving this goal will not only make a significant contribution to society but also give companies a favorable position to seize market share (Niu et al., 2022). The ranking of industry market shares will be disrupted by this transformation, leading to a reordering and repositioning (Wu, 2022). It can be foreseen that in the near future, more market-based environmental regulatory policies will impact and influence the market structure of various industries. Companies that neglect environmental costs and fail to adopt green production methods will lose their previous market monopolies, and more products from new technology and high-tech enterprises will replace their leading positions in the industry.
7 Conclusion and recommendations
This study conducts a quasi-natural experiment using the carbon emission trading policy announced in 2013 to empirically examine the impact of the policy on market structure, employing the DID model. The findings of our research indicate that carbon emission trading contributes to reducing market concentration and promotes the development of market liberalization and competition to a certain extent. We performed a series of robustness checks, including placebo tests and parallel trend tests, which consistently support our conclusions. Furthermore, through dynamic analysis, our study reveals that the policy effect of carbon emission trading gradually increases with continuous policy implementation. Thus, further research is needed to explore the short-term and long-term mechanisms of policy effects. It is suggested that the short-term implementation of carbon emission trading policy effectively alleviates market concentration and monopolistic tendencies. Over time, this impact gradually decreases, indicating that short-term policy effects are greater than long-term policy effects. Moreover, mechanism analysis demonstrates that carbon emission trading can influence market concentration and inhibit monopolistic development of market structure by regulating profits through cost and revenue adjustments.
Based on the above research conclusions, the policy recommendations that can be drawn from this article are as follows.
(1) High-quality development requires effective market-oriented mechanisms, which necessitate the implementation of environmental regulations that are more in line with market mechanisms. As demonstrated throughout the text, carbon emissions trading policies can effectively adjust market structures, reduce market concentration, and achieve a win-win situation for the economy and the environment. To achieve economic transformation and upgrading, it is necessary to further refine and rationalize market-oriented environmental regulations. However, considering that the short-term policy effects of carbon emissions trading are greater than the long-term effects, it is important to maintain an efficient regulatory mode based on effective monitoring in future policy implementations. In terms of monitoring:① Establish a comprehensive carbon emissions monitoring system including real-time data collection and monitoring networks to ensure data accuracy and reliability; ② Develop unified data standards and reporting requirements to ensure accurate and consistent carbon emissions data provided by companies; ③ Strengthen data analysis and modeling capabilities to identify potential market trends and risks, and improve monitoring methods and forecasting models.
(2) In terms of regulatory mechanisms, the government should further enhance the intensity of policy implementation to ensure the effective implementation of carbon emissions trading policies. As the implementation intensity can vary due to the different strengths of law enforcement in different regions, strengthening supervision and management can ensure the concrete implementation of policies. Therefore, the following measures are recommended:① Increase surveillance on key regulated companies to ensure complete and timely statistics of carbon emissions; ② For companies that violate regulations, strengthen punishment while providing policy guidance and recommendations, and offer policy training to management to transform their development and operational concepts; ③ Incorporate a range of environmental regulations, including carbon emissions trading policies, into the government’s performance evaluation system to prevent local protectionism from providing protection for non-compliant companies.
(3) Considering the significant impact of the cost/benefit mechanism on market structures, it is important to encourage enterprises to actively participate in carbon emissions trading. While companies strive for profit maximization, relevant departments can provide assistance and guidance in adjusting market structures. Encouraging companies to utilize the eligible tools provided by carbon emissions trading policies and other compliance instruments, such as setting up dedicated energy-saving and emission reduction departments, can help companies undergo a green assessment while adjusting their market structures. This not only provides reasonable guarantees for companies undergoing market structure adjustments but also helps them provide effective compliance evidence when facing environmental regulation. In addition, it is necessary to establish a carbon emissions allocation system that allocates carbon emission quotas based on companies’ emission reduction targets and performance, encourages companies to actively participate in emission reduction actions, and provides economic incentives such as tax benefits, subsidies, and favorable loan interest rates to participating companies. Furthermore, establishing an open and transparent price discovery mechanism in the carbon emissions trading market encourages companies to autonomously determine transaction prices based on market demand.
While this article has achieved some results in theoretical exploration and empirical research, there are still some limitations. Future extensions and analyses can be conducted in the following aspects: ① A comprehensive consideration of the impacts of different environmental regulatory policies on market structure can be undertaken to conduct a more systematic empirical study and analysis.② Due to data constraints, this study primarily focused on the carbon emissions trading policy implemented since 2013, without fully examining the effects of the carbon emissions trading policy implemented nationwide in China in 2021. Future research can consider conducting further analysis under the influence of this policy. ③ Since the market consists of both supply and demand sides, the analysis solely from the supply side may have a narrow perspective. Further analysis of the impact of carbon emissions trading on market structure from the consumer’s perspective is also needed.
Data availability statement
The original contributions presented in the study are included in the article/supplementary material, further inquiries can be directed to the corresponding author.
Author contributions
GZ: Writing—original draft, Validation, Methodology, Formal analysis, Data curation, Conceptualization, Resources; SB: Writing—original draft, Resources, Methodology, Writing—review and editing, Investigation, Conceptualization. All authors contributed to the article and approved the submitted version.
Conflict of interest
The authors declare that the research was conducted in the absence of any commercial or financial relationships that could be construed as a potential conflict of interest.
Publisher’s note
All claims expressed in this article are solely those of the authors and do not necessarily represent those of their affiliated organizations, or those of the publisher, the editors and the reviewers. Any product that may be evaluated in this article, or claim that may be made by its manufacturer, is not guaranteed or endorsed by the publisher.
References
Aihua, L., Miglietta, P. P., and Toma, P. (2022). Did carbon emission trading system reduce emissions in China? An integrated approach to support policy modeling and implementation [Article]. Energy Systems-Optimization Model. Simul. Econ. Aspects 13 (2), 437–459. doi:10.1007/s12667-021-00438-8
Anke, C.-P., Hobbie, H., Schreiber, S., and Moest, D. (2020). Coal phase-outs and carbon prices: interactions between EU emission trading and national carbon mitigation policies. Energy Policy 144, 111647. doi:10.1016/j.enpol.2020.111647
Ansari, M. A., Haider, S., and Khan, N. A. (2020). Does trade openness affects global carbon dioxide emissions: evidence from the top CO2 emitters. Manag. Environ. Qual. 31 (1), 32–53. doi:10.1108/meq-12-2018-0205
Ayad, H., Abbas, S., Nakhli, M. S., Jibir, A., and Shahzad, U. (2023). Industrial growth, health care policy uncertainty and carbon emissions: do trade and tax policy uncertainties matter for sustainable development in the USA? [Article]. Struct. Change Econ. Dyn. 66, 151–160. doi:10.1016/j.strueco.2023.04.005
Azam, M., Rehman, Z. U., and Ibrahim, Y. (2022). Causal nexus in industrialization, urbanization, trade openness, and carbon emissions: empirical evidence from OPEC economies. Environ. Dev. Sustain. 24 (12), 13990–14010. doi:10.1007/s10668-021-02019-2
Bakator, M., Dalic, N., Petrovic, N., Paunovic, M., and Terek, E. (2019). Transition economy and market factors: the influence of advertising on customer satisfaction in Serbia. Econ. Research-Ekonomska Istraz. 32 (1), 2293–2309. doi:10.1080/1331677x.2019.1642787
Belkhaoui, S., Lakhal, L., Lakhal, F., and Hellara, S. (2014). Market structure, strategic choices and bank performance: a path model. Manag. Finance 40 (6), 538–564. doi:10.1108/mf-07-2013-0183
Chan, Y. T. (2020). On the impacts of anticipated carbon policies: a dynamic stochastic general equilibrium model approach. J. Clean. Prod. 256, 120342. doi:10.1016/j.jclepro.2020.120342
Chen, X., and Lin, B. (2021). Towards carbon neutrality by implementing carbon emissions trading scheme: policy evaluation in China. Energy Policy 157, 112510. doi:10.1016/j.enpol.2021.112510
Chen, Z., Wang, S., and Yuan, Q. (2015). Research on the impact of product market competition on enterprise cash flow risk: based on the dual consideration of industry competition degree and enterprise competitive position [24]. China Ind. Econ. 78 (03), 96–101. doi:10.1016/j.ijbiomac.2015.03.068
Chen, Z., Zhang, X., and Chen, F. (2021). Do carbon emission trading schemes stimulate green innovation in enterprises? Evidence from China [26] [Article]. Technol. Forecast. Soc. Change 168, 120744. doi:10.1016/j.techfore.2021.120744
Chu, Y. (2012). Optimal capital structure, bargaining, and the supplier market structure. J. Financial Econ. 106 (2), 411–426. doi:10.1016/j.jfineco.2012.05.010
Constantatos, C., and Herrmann, M. (2011). Market inertia and the introduction of green products: can strategic effects justify the porter hypothesis? [55] [article]. Environ. Resour. Econ. 50 (2), 267–284. doi:10.1007/s10640-011-9471-0
Cox, J., and Woods, D. (2023). COVID-19 and market structure dynamics. J. Bank. Finance 147, 106362. doi:10.1016/j.jbankfin.2021.106362
Dissanayake, S., Mahadevan, R., and Asafu-Adjaye, J. (2020). Evaluating the efficiency of carbon emissions policies in a large emitting developing country. Energy Policy 136, 111080. doi:10.1016/j.enpol.2019.111080
Dong, Z. Y. Z., Xia, C. Y., Fang, K., and Zhang, W. W. (2022). Effect of the carbon emissions trading policy on the co-benefits of carbon emissions reduction and air pollution control. Energy Policy 165, 112998. doi:10.1016/j.enpol.2022.112998
Du, Z., and Lin, B. (2018). Analysis of carbon emissions reduction of China's metallurgical industry. J. Clean. Prod. 176, 1177–1184. doi:10.1016/j.jclepro.2017.11.178
Duerkop, M. (1994). Trade and environment: international trade law aspects of the proposed EC directive introducing a tax on carbon dioxide emissions and energy. Common Mark. Law Rev. 31 (4), 807–844. <Go to ISI>://WOS:A1994PE92500005. doi:10.54648/cola1994040
Fan, Y., Wu, S., Lu, Y., Wang, Y., Zhao, Y., Xu, S., et al. (2016). An approach of measuring environmental protection in Chinese industries: a study using input–output model analysis. J. Clean. Prod. 137, 1479–1490. doi:10.1016/j.jclepro.2015.12.114
Fang, K., Zhang, Q., Song, J., Yu, C., Zhang, H., and Liu, H. (2021). How can national ETS affect carbon emissions and abatement costs? Evidence from the dual goals proposed by China's NDCs [Article]. Resour. Conservation Recycl. 171, 105638. doi:10.1016/j.resconrec.2021.105638
Gao, X., and Zhong, W. (2016). Economic incentives in security information sharing: the effects of market structures. Inf. Technol. Manag. 17 (4), 361–377. doi:10.1007/s10799-015-0253-1
Ge, W., Xu, Y., Razzaq, A., Liu, G., Su, X., Yang, X., et al. (2023). What drives the green transformation of enterprises? A case of carbon emissions trading pilot policy in China [57] [Article; Early Access]. Environ. Sci. Pollut. Res. 30, 56743–56758. doi:10.1007/s11356-023-26283-z
Hasegawa, T., and Tango, T. (2009). Permutation test following covariate-adaptive randomization in randomized controlled trials. J. Biopharm. Statistics 19 (1), 106–119. doi:10.1080/10543400802527908
He, J., and Zhao, W. (2023). Research on the path of carbon emission trading in China under the double carbon background. Probl. Ekorozwoju 18 (1), 81–88. doi:10.35784/pe.2023.1.08
Hong, Q., Cui, L., and Hong, P. (2022). The impact of carbon emissions trading on energy efficiency: evidence from quasi-experiment in China's carbon emissions trading pilot. Energy Econ. 110, 106025. doi:10.1016/j.eneco.2022.106025
Hoque, N., Rahman, A. R. A., Molla, R. I., Noman, A. H. M., and Bhuiyan, M. Z. H. (2018). Is corporate social responsibility pursuing pristine business goals for sustainable development? [Article]. Corp. Soc. Responsib. Environ. Manag. 25 (6), 1130–1142. doi:10.1002/csr.1527
Hu, Y., Tian, Y., and Zhang, L. (2023). Green bond pricing and optimization based on carbon emission trading and subsidies: from the perspective of externalities. Sustainability 15 (10), 8422. doi:10.3390/su15108422
Huang, C., Du, S., Wang, B., and Tang, W. (2022). Accelerate or hinder it? Manufacturer transformation under competition and carbon emission trading [Article; Early Access]. Int. J. Prod. Res. 61, 6230–6250. doi:10.1080/00207543.2022.2058434
Huang, J., and Sun, K. (2019). Environmental regulation, market concentration and environmental efficiency: a test from China's industrial panel data [29]. Resour. Dev. Mark. 35 (05), 646–653. doi:10.3969/j.issn.1005-8141.2019.05.009
Huang, K. X. D. (2019). Growth and cycles in China's unbalanced development: resource misallocation, debt overhang, economic inequality, and the importance of structural reforms [54] [article]. Front. Econ. China 14 (1), 53–71. doi:10.3868/s060-008-019-0004-8
Jiang, Y., Yao, J., Gao, R., and Chen, J. (2022). Why the “journey” of carbon neutrality is a long one—a mixed method research based on carbon emission trading in hubei province. Front. Environ. Sci. 10, 984434. doi:10.3389/fenvs.2022.984434
Jung, H., Song, S., Ahn, Y.-H., Hwang, H., and Song, C.-K. (2021). Effects of emission trading schemes on corporate carbon productivity and implications for firm-level responses. Sci. Rep. 11 (1), 11679. doi:10.1038/s41598-021-91193-4
Kaushal, K. R., and Rosendahl, K. E. (2021). Optimal discounting of forest offsets in the carbon market. Land Econ. 97 (2), 436–454. doi:10.3368/le.97.2.436
Ke, J., Jahanger, A., Yang, B., Usman, M., and Ren, F. (2022). Digitalization, financial development, trade, and carbon emissions; implication of pollution haven hypothesis during globalization mode. Front. Environ. Sci. 10, 873880. doi:10.3389/fenvs.2022.873880
Khan, H. H., Ahmad, R. B., and Chan, S. G. (2018). Market structure, bank conduct and bank performance: evidence from ASEAN. J. Policy Model. 40 (5), 934–958. doi:10.1016/j.jpolmod.2018.02.001
Khattak, M. A., Ahmad, F., and Khan, N. A. A. (2022). Do banks enjoy technology under competitive pressures? Cross-country evidence [Article; Early Access]. Technology Analysis and Strategic Management. doi:10.1080/09537325.2022.2147423
Lei, Y. T., Zhang, X., and Peng, W. X. (2022). Can China's policy of carbon emissions trading optimize manufacturing structure? Evidence from Guangdong based on a synthetic control approach [article]. Sustainability 14 (6), 3302. doi:10.3390/su14063302
Leimbach, M., and Toth, F. L. (2003). Economic development and emission control over the long term: the ICLIPS aggregated economic model [Article]. Clim. Change 56 (1), 139–165. doi:10.1023/a:1021392530774
Li, S., Dong, C., Yang, L., Gao, X., Wei, W., Zhao, M., et al. (2022). Research on evolutionary game strategy selection and simulation research of carbon emission reduction of government and enterprises under the “dual carbon” goal. Sustainability 14 (19), 12647. doi:10.3390/su141912647
Li, Z. G., and Wang, J. (2022). The dynamic impact of digital economy on carbon emission reduction: evidence city-level empirical data in China. J. Clean. Prod. 351, 131570. doi:10.1016/j.jclepro.2022.131570
Lie, D., Ikhsan, A., Harmain, H., and Nasution, M. D. (2020). The effect environmental performance, environmental disclosure, firm size, and return on equity on economic performance [43] [article]. Quality-Access Success 21 (174), 118–120. doi:10.14414/tiar.v8i1.953
Liu, Z., He, S., Li, W., and Sun, H. (2022). Does green credit reduce carbon emissions? Evidence from China [2] [Article; Early Access]. Environ. Sci. Pollut. Res. 30, 26735–26751. doi:10.1007/s11356-022-24011-7
Lu, Z., and Luo, Y. (2020). Analysis of China's carbon trading policy in mitigation effectiveness [27] [Article]. J. Arid Land Resour. Environ. 34 (4), 1–7. Article 1003-7578(2020)34:4<1:Zgtjyz>2.0.Tx;2-i. doi:10.13448/j.cnki.jalre.2020.087
Ma, C., Hou, B., and Yuan, T. (2020). LOW-CARBON manufacturing decisions considering carbon emission trading and green technology input [article]. Environ. Eng. Manag. J. 19 (9), 1593–1604. Go to ISI>://WOS:000589382100015. doi:10.30638/eemj.2020.149
Ma, S., Wu, P., and Fang, C. (2023). Will host country data protection suppress cross border mergers and acquisitions of Chinese E-commerce [35]. China Ind. Econ. (02), 93–111. doi:10.19581/j.cnki.ciejournal.2023.02.006
Mishra, S. S., and Mishra, P. P. (2008). Price determination for an EOQ model for deteriorating items under perfect competition. Comput. Math. Appl. 56 (4), 1082–1101. doi:10.1016/j.camwa.2008.01.034
Nguyen Thi Phuong, H., and Nguyen Thi Vo, T. (2021). Impacts of sales expense and administrative cost stickiness on earnings management - empirical evidence from vietnam [44] [article]. Pol. 25 (2), 206–231. doi:10.2478/manment-2019-0080
Niu, H., Zhao, X., Luo, Z., Gong, Y., and Zhang, X. (2022). Green credit and enterprise green operation: based on the perspective of enterprise green transformation. Front. Psychol. 13, 1041798. doi:10.3389/fpsyg.2022.1041798
Oh, S., Lee, D., and Kim, S.-K. (2022). How does non-market economy structure work as a trade barrier? [Article; Early Access]. Appl. Econ. Lett. 30, 2743–2748. doi:10.1080/13504851.2022.2106029
Pan, J., Chiu, C.-Y., Wu, K.-S., Yen, H.-F., and Wang, Y.-W. (2020). Sustainable production–inventory model in technical cooperation on investment to reduce carbon emissions. Processes 8 (11), 1438. doi:10.3390/pr8111438
Pan, X., Li, M., Xu, H., Guo, S., Guo, R., and Lee, C. T. (2021). Simulation on the effectiveness of carbon emission trading policy: a system dynamics approach. J. Operational Res. Soc. 72 (7), 1447–1460. doi:10.1080/01605682.2020.1740623
Pan, X., Yang, B., and Su, Y. (2014). Empirical comparison of the dynamic interest rate term structure models in chinas interbank bond market [article]. Syst. Eng. 32 (10), 30–37. Article 1001-4098(2014)32:10<30:Yhjscd>2.0.Tx;2-b. <Go to ISI>://CSCD:5310809.
Peng, H., Qi, S., and Cui, J. (2021). The environmental and economic effects of the carbon emissions trading scheme in China: the role of alternative allowance allocation. Sustain. Prod. Consum. 28, 105–115. doi:10.1016/j.spc.2021.03.031
Ren, B., and Miao, X. (2022). Research on performance evaluation of China's supply-side structural reform [45] [Article]. China Soft Sci. (8), 19–30. Article 1005-0566(2022)8<19:Zggjcj>2.0.Tx;2-i. doi:10.7297/j.issn.1005-0566.2022.08.03
Rozanova, N. M. (2022). Foreign experience of competition policy in digital economy. Mirovaya Ekon. I Mezhdunarodnye Otnos. 66 (2), 15–22. doi:10.20542/0131-2227-2022-66-2-15-22
Shaheen, K., Zaman, K., Batool, R., Khurshid, M. A., Aamir, A., Shoukry, A. M., et al. (2019). Dynamic linkages between tourism, energy, environment, and economic growth: evidence from top 10 tourism-induced countries. Environ. Sci. Pollut. Res. 26 (30), 31273–31283. doi:10.1007/s11356-019-06252-1
Shao, W., Yang, K., and Jin, Z. (2023). How the carbon emissions trading system affects green total factor productivity? A quasi-natural experiment from 281 Chinese cities [Article]. Front. Energy Res. 10, 895539. doi:10.3389/fenrg.2022.895539
Shen, X., Wang, C., Yue, X., Wang, Q., Xie, L., Huang, Z., et al. (2022). Preeclampsia associated changes in volume density of fetoplacental vessels in Chinese women and mouse model of preeclampsia. J. Xinjiang Normal Univ. Philosophy Soc. Sci. 43 (01), 116–125. doi:10.1016/j.placenta.2022.03.002
Silverman, R., Fine, J., Zink, R. C., and Ivanova, A. (2019). Permutation and bootstrap testing for the sequential parallel comparison design. Statistics Biopharm. Res. 11 (1), 44–51. doi:10.1080/19466315.2018.1549095
Smith, J. M., and Bennett, R. (1992). Several antecedent strategies in reduction of an environmentally destructive behavior. Psychol. Rep. 70 (1), 241–242. doi:10.2466/pr0.1992.70.1.241
Sunaryo, D., NafiuddinGentari, R. E., and Adiyanto, Y. (2022). Using current ratio indicator and total asset turnover approach in solving return on assets problems with debt-to-equity ratio moderated [42] [article]. Quality-Access Success 23 (189), 199–209. doi:10.47750/qas/23.189.23
Tsai, W.-H., Lu, Y.-H., and Hsieh, C.-L. (2022). Comparison of production decision-making models under carbon tax and carbon rights trading. J. Clean. Prod. 379, 134462. doi:10.1016/j.jclepro.2022.134462
Wahab, S. (2021). Does technological innovation limit trade-adjusted carbon emissions? [Article]. Environ. Sci. Pollut. Res. 28 (28), 38043–38053. doi:10.1007/s11356-021-13345-3
Wang, X. H., and Zhao, J. (2007). Welfare reductions from small cost reductions in differentiated oligopoly. Int. J. Industrial Organ. 25 (1), 173–185. doi:10.1016/j.ijindorg.2006.02.003
Wang, Z., Guo, J., and Luo, G. (2022). The impact of Chinese carbon emissions trading system on efficiency of enterprise capital allocation: effect identification and mechanism test. Sustainability 14 (20), 13151. doi:10.3390/su142013151
Webb, E. J. D. (2017). If it’s all the same to you: blurred consumer perception and market structure. Rev. Industrial Organ. 50 (1), 1–25. doi:10.1007/s11151-016-9512-5
Wu, D. (2022). RESEARCH on green development of resource based industry in ECO-ECONOMIC zone based on circular economy [59] [article]. Fresenius Environ. Bull. 31 (3), 2345–2354. doi:10.3724/SP.J.1088.2010.00432
Wu, H., and Wang, H. (2009). Empirical research on industry product market competition and debt financing selection of listed companies [41]. Jinan Journal(Philosophy Soc. Sci. 31 (06), 124–132. doi:10.3969/j.issn.1000-5072.2009.06.020
Wu, R., Tan, Z., and Lin, B. (2023). Does carbon emission trading scheme really improve the CO2 emission efficiency? Evidence from China's iron and steel industry [Article]. Energy 277, 127743. doi:10.1016/j.energy.2023.127743
Xie, B., Li, W., Zhao, D., and Jiang, P. (2022). Effects of network externalities and recycling channels on closed-loop supply chain operation incorporating consumers’ dual preferences. Math. Problems Eng. 2022, 1–20. doi:10.1155/2022/3347303
Xie, L., Zhou, Z., and Hui, S. (2022). Does environmental regulation improve the structure of power generation technology? Evidence from China's pilot policy on the carbon emissions trading market(CETM) [Article]. Technol. Forecast. Soc. Change 176, 121428. doi:10.1016/j.techfore.2021.121428
Xu, C., and Li, X. (2023). The efficiency of natural resource consumption and government administration concerning green economic growth in Asian countries. Resour. Policy 82, 103569. doi:10.1016/j.resourpol.2023.103569
Xue, K., and Sun, G. (2022). Impacts of supply chain competition on firms’ carbon emission reduction and social welfare under cap-and-trade regulation. Int. J. Environ. Res. Public Health 19 (6), 3226. doi:10.3390/ijerph19063226
Yan, Y., Cheng, Q., Huang, M., Lin, Q., and Lin, W. (2023). Government environmental regulation and corporate ESG performance: evidence from natural resource accountability audits in China. Int. J. Environ. Res. Public Health 20 (1), 447. doi:10.3390/ijerph20010447
Yang, X., and Wu, H. (2009). Industry characteristics, product market competition, and company cash holdings: empirical evidence from Chinese listed companies [40]. Econ. Rev. (01), 69–76. doi:10.19361/j.er.2009.01.010
Yartey, C. A. (2008). Financial development, the structure of capital markets, and the global digital divide. Inf. Econ. Policy 20 (2), 208–227. doi:10.1016/j.infoecopol.2008.02.002
Yu, X., and Li, Y. (2020). Effect of environmental regulation policy tools on the quality of foreign direct investment: an empirical study of China. J. Clean. Prod. 270, 122346. doi:10.1016/j.jclepro.2020.122346
Zhang, H., and Wu, J. (2022). The energy saving and emission reduction effect of carbon trading pilot policy in China: evidence from a quasi-natural experiment. Int. J. Environ. Res. Public Health 19 (15), 9272. doi:10.3390/ijerph19159272
Zhang, T., Liu, W., and Fu, T. (2023). Implementation of the social insurance law and changes in enterprise labor income share [30]. J. Quantitative Technol. Econ. 40 (06), 91–112. doi:10.13653/j.cnki.jqte.20230414.001
Zhang, X., Liu, X., Zhong, J., and Gao, W. (2019). Electricity–gas-integrated energy planning based on reward and penalty ladder-type carbon trading cost. Iet Generation Transm. Distribution 13 (23), 5263–5270. doi:10.1049/iet-gtd.2019.0666
Zhang, X., Loeschel, A., Lewis, J., Zhang, D., and Yan, J. (2020). Emissions trading systems for global low carbon energy and economic transformation. Appl. Energy 279, 115858. doi:10.1016/j.apenergy.2020.115858
Zhang, Y.-J., and Wei, Y.-M. (2010). An overview of current research on EU ETS: evidence from its operating mechanism and economic effect. Appl. Energy 87 (6), 1804–1814. doi:10.1016/j.apenergy.2009.12.019
Zhao, X.-g., Wu, L., and Li, A. (2017). Research on the efficiency of carbon trading market in China. Renew. Sustain. Energy Rev. 79, 1–8. doi:10.1016/j.rser.2017.05.034
Zhou, B., Zhang, C., Song, H., and Wang, Q. (2019). How does emission trading reduce China's carbon intensity? An exploration using a decomposition and difference-in-differences approach [28] [Article]. Sci. Total Environ. 676, 514–523. doi:10.1016/j.scitotenv.2019.04.303
Keywords: carbon emission trading, market structure, difference-in-difference model, policy effects, industrial competition
Citation: Zhang G and Bi S (2023) Inhibition or promotion: the impact of carbon emission trading on market structure: evidence from China. Front. Energy Res. 11:1238416. doi: 10.3389/fenrg.2023.1238416
Received: 11 June 2023; Accepted: 11 October 2023;
Published: 23 October 2023.
Edited by:
Shu-Yuan Pan, National Taiwan University, TaiwanReviewed by:
Baogui Xin, Shandong University of Science and Technology, ChinaChe-Jung Hsu, National Kaohsiung University of Science and Technology, Taiwan
Copyright © 2023 Zhang and Bi. This is an open-access article distributed under the terms of the Creative Commons Attribution License (CC BY). The use, distribution or reproduction in other forums is permitted, provided the original author(s) and the copyright owner(s) are credited and that the original publication in this journal is cited, in accordance with accepted academic practice. No use, distribution or reproduction is permitted which does not comply with these terms.
*Correspondence: Shulei Bi, c2h1bGVpLmJpLjcxQHVuaWJnZS5odQ==