 Yuru Zhu
 Xiu Yang1
- 1Shanghai University of Electric Power, Shanghai, China
- 2State Grid Jiangsu Electric Power Co., Ltd., Haian Power Supply Branch, Nantong, China
Precisely identifying the household-transformer relationship is of significant importance for both the stability of the power system and the quality of customer electricity consumption. However, the complex network structures and frequent reconfigurations may lead to inaccurate records of household-transformer relationships. In this paper, a novel data-driven similarity assessment solution is proposed to enhance the accuracy and scalability of identifying household-transformer relationships. Initially, a data processing method based on dynamic temporal regularization with sliding windows is employed to optimize dataset quality as well as enhance the efficiency of data processing. Then, a two-stage solution is proposed for identifying the household-transformer relationship. The first stage involves initial normalized clustering based on the basic information of power distribution substations, while the second stage assesses the similarity between households and transformer operational states based on Hausdorff distance. The superior performance of the proposed method is extensively assessed through real historical datasets, compared to benchmarks.
1 Introduction
1.1 Background
The household-transformer relationship is defined as the link between household meters and their respective transformers (Zhao et al., 2021). In practice, the complexity of the low-voltage distribution network can easily lead to discrepancies between the actual household-transformer relationships and the records at the power station due to its large user base, complex network structure, and regular changes (e.g., relocation, expansion, and disconnection). These inconsistencies may trigger inaccurate outage notifications, which may destabilize the system (Liu et al., 2021). Furthermore, the misidentification of transformers can degrade the quality of electricity (Li et al., 2019) and undermine the reliability of the power supply for customers (Deng et al., 2021). The incorrect understanding of the household-transformer relationship can also result in defective line loss analysis (Zhou et al., 2022) and compromise the efficiency of network management (Hu et al., 2020a). Thus, it is crucial to rectify the household-transformer relationship identification issue for improving the power supply quality of consumers. In addition, addressing the issue of identifying the household-transformer relationship is critical for the efficient and stable operation of the power system, and protecting public assets (Hu et al., 2020b). Therefore, the development of a solution to the household-transformer relationship identification problem is of significance for both the stability of the power system and the quality of customer electricity consumption.
1.2 Related work
Identifying relationships between households and transformers in a low-voltage power distribution network is a critical topic in electrical data analysis that has received wide attention in the literature. Current strategies for identifying household-transformer relationships in power distribution networks can be mainly divided into three categories: traditional manual identification methods, home power-line communication (HPLC)-based methods, and data-driven power analysis (Chen et al., 2019).
For the task of identifying the household-transformer relationship in the low-voltage distribution network, the traditional manual identification method confirms the household-transformer relationship in the given transformer by onsite line inspection (Hu et al., 2021a). Despite its high accuracy, this method is labor-intensive, time-consuming, and challenging to implement on a large scale (Chen et al., 2022a).
The HPLC-based household-transformer relationship identification method is used to determine any abnormalities in the household-transformer relationships based on the carrier communication outcomes from the transformer to the user-side households via the power lines. In the literature (Zhang et al., 2021), the authors analyzed and extracted the characteristic information correlation between the downlink carrier module of the intelligent terminal and the carrier module of the intelligent electricity meter, as well as the correlation between the incoming and outgoing line characteristic information of the intelligent branch monitoring unit. Although the application of HPLC technologies has enhanced the precision of household-transformer relationship identification, the power carrier is a high-frequency signal that transmits user identification information coupled to the cable of a low-voltage distribution network. Thus, the variations in the transformer load impedance might also obstruct the accurate identification of the relationships (Liu et al., 2019). Moreover, noise within the distribution network may distort the carrier signal and hinder stable long-distance transmission, possibly compromising the accuracy of the identification of household-transformer relationships.
In summary, the traditional manual identifying method and the HPLC-based method are only applicable to the case of a single power distribution transformer with few subordinate users (Wang et al., 2020a). Therefore, traditional methods for identifying the relationship between transformers and households are challenging because of their expensive costs and limited assurance of accuracy. In this Regard, it is necessary to explore more efficient solutions for identifying household-transformer relationships in power distribution networks with large fluctuations and complex household electrical equipment configurations.
With the widespread deployment of smart meters in power systems, a substantial amount of electricity data has become available. Extensive historical measurement data makes it feasible to accurately identify household-transformer relationships through data-driven methods. In recent years, with the development of artificial intelligence, machine learning methods in power system application research have become a research hotspot. Many studies have employed machine learning methods to assess the operational state similarity of transformers and households in power systems. Data-driven clustering and similarity assessment methods based on machine learning have been greatly promoted to identify household-transformer relationships. According to existing literature, the data-driven approaches for identifying household-transformer relationships can be mainly classified into two aspects: 1) the mining of electrical data features by constructing knowledge graphs, combing historical outage data of transformers, mining multi-temporal characteristics of power distribution networks, etc., to realize household-transformer relationship identification; and 2) the analysis of similarity of voltage fluctuation curves by analyzing voltage correlation between nodes to discriminate connectivity relationships. The studies related to the two aspects are reviewed in the following:
(1) Mining of electrical data features: To address the issue of outdated household-transformer relationships in the marketing system, machine learning algorithms are employed to categorize transformers and households by analyzing the measurement and basic information of substations. The power supply data, line loss rate, and user power consumption are used as support to calculate the three correlation coefficients of Pearson, Spearman, and Kendall (Qin et al., 2022). The machine learning methods may complete the identification of the household-transformer relationship on a large scale with automation and high accuracy. Zou et al. (2022) proposed an identification method for low-voltage transformers and household meters based on density-based spatial clustering of applications with noise, which applied a clustering algorithm based on time series similarity to recognize the household-transformer relationship. Liu et al. (2022) designed a data-driven solution for household-transformer relationship identification by utilizing adaptive aggregation approximation, considering the hierarchy structure of the low-voltage power distribution network. There are also some distance metrics that can be used to better measure the similarity between household electricity consumption and transformer measurements, such as Euclidean distance, Hausdorff distance (Sendov, 1990), etc. For example, Zaevski and Kyurkchiev (2023) discussed some properties of a new power-modified exponential family with an original Kies correction, which can be used to improve recall and precision in identifying household-transformer relationships. In summary, numerous studies have proven that machine learning techniques and data-driven methods can be effectively used to mine operational patterns from electrical data.
(2) Analysis of the similarity among the voltage fluctuation curves: There have also been numerous studies to identify the relationship between households and transformers by analyzing the similarity among the voltage fluctuation curves. For instance, Wang et al. (2022) proposed a method for identifying the relationship between households and transformers in low-voltage distribution networks by utilizing trend similarity and distance measures. Similarly, Gao et al. (2021) suggested a technique to identify the topological relationship between households and transformers based on the K-Nearest Neighbors (KNN) algorithm and the Pearson correlation coefficient. Zhu et al. (2021) developed a verification method for low-voltage station topology recognition using the Dynamic Time Warping (DTW) algorithm. Chen et al. (2021) employed feature analysis to identify the relationship between households and transformers within a low-voltage distribution network. The viability and effectiveness of this approach in real-world engineering applications were verified through practical effect analysis in an actual power distribution system. Furthermore, Hu et al. (2021b) introduced a real-time line loss calculation method for the identification of the relationship between households and transformers based on the equivalent resistance of a low-voltage distribution network. Wang et al. (2020b) suggested an innovative method for identifying the station area-user relationship. The method is constructed based on multidimensional scale analysis and an improved K-means algorithm which can maintain a high level of accuracy even as problem complexity increases. Similarly, Yong Xiao et al. achieve the identification of the transformer-user relationship through analyzing topological structure (Gao et al., 2020). However, existing methods face significant challenges posed by the dimensional explosion and the constraints of single-feature recognition in scenarios with large data volumes and complex network structures, which limit their application in practice and compromise their recognition ability and adaptability. Therefore, more research efforts need to be exploited to overcome these challenges and develop more accurate and scalable techniques to identify and analyze household-transformer relationships within low-voltage distribution networks. To this end, this paper focuses on enhancing the robustness of clustering algorithms, improving the quality and quantity of data, refining measures of similarity and distance, and optimizing model parameters.
1.3 Contribution
This paper addresses a significant research gap in understanding the interaction between time-series fluctuations in communication and the identification signal of the common power distribution substation. The accurate identification of household-transformer relationships is crucial for various applications such as load management, fault diagnosis, and energy optimization. However, existing methods lack a comprehensive approach to capture the underlying operational patterns within the distribution network area, which hampers the accuracy of identification. Therefore, there is a pressing need for a data-driven similarity assessment solution that can bridge this gap and improve the identification accuracy. A data-driven similarity assessment method based on dynamic time regulation is proposed for mining the common operational pattern behind the time series variations within the distribution network area through Hausdorff distance computation. The key contributions of this study are summarized as follows:
• The proposed Hausdorff distance-based similarity evaluation bridges the gap between households and transformers for node voltage similarity analysis, where the identification accuracy is improved by a two-stage identification procedure that includes both similarity assessment and clustering algorithms.
• An auto-completion technique for absent time features and a sliding window algorithm for time series normalization are developed. Furthermore, a missing data completion method focusing on effective voltage selection is implemented to enhance data processing efficiency.
• The effectiveness of the proposed method is extensively assessed through practical case studies, compared to benchmark solutions.
The remainder of this paper is organized as follows: Section 2 formulates the household-transformer relationship identification task. Section 3 presents the two-stage identification method based on dynamic similarity assessment and clustering algorithms. Section 4 assesses the proposed solution based on a real historical dataset. The conclusive remarks and future work are given in Section 5.
2 Problem definition
2.1 Relationship between households and transformers
Households, in this context, refer to individual residential units that require electricity to satisfy their daily demands, and transformers are integral components within power distribution networks. The identification of the household-transformer relationships is essential to minimize power loss and guarantee a consistent power supply to all households. Consequently, the accurate relationships between households and transformers are pivotal for comprehending and optimizing power distribution networks, given that they constitute the basic power supply unit and data source within a low-voltage distribution network. Figure 1 illustrates the overall architecture of households and transformers within the power distribution network.
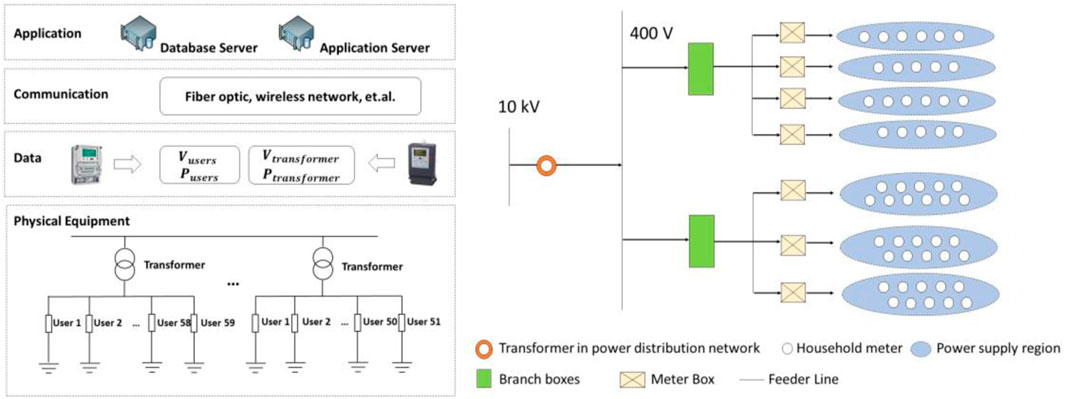
FIGURE 1. Households-transforms architecture in the power distribution network.
As shown in Figure 1, the household-transformer architecture in a low-voltage power distribution network comprises four primary layers: the physical device layer, a data layer predicated on measurements and electricity supply facility records, a communication layer incorporating intelligent fusion terminals, and an application layer for data analysis. Specifically, the existing low-voltage distribution power network is primarily tree-structured, featuring four levels of connectivity, i.e., distribution transformer, line branch box, meter box, and end-user. The power from the higher-level power grid is channeled to different substations via the low-voltage distribution transformers, which distribute electricity to the end-users in the power substation area through a succession of branch boxes and meter boxes. Hence, identifying the relationship between households and transformers in low-voltage distribution areas is crucial to determining the power supply scope and the end-users serviced by the distribution transformers. Based on the architecture of the households and transformers in the power distribution network, these units may exhibit more similar voltage fluctuation characteristics, which could hinder the accurate determination of the relationship between households and transformers based on voltage time series fluctuation curves. This factor compounds the challenge of establishing the relationship between households and transformers in a substation area, given the limited ability to identify single voltage characteristics.
This paper primarily focuses on the task of identifying household-transformer relationships based on an analysis of the structural characteristics of the household-transformer architecture. Given the occasional missing or incorrect real data from measurements and electricity supply facility records and the potential drift and noise induced by the communication layer, it becomes crucial to carry out data cleaning and completion before the identification of household-transformer relationships. Therefore, this paper eliminates the influence of the voltage curve time-axis offset on the identification of household-transformer relationships through the calibration of data. The key objective in the data calibration process for missing data is to calibrate the voltage curve offset, which is caused by the clock error of the meter. Then, to verify the relationships among the end-users and transformers, the discrete Hausdorff distance is employed to compare the similarity of voltage curves and cluster the households and transformers with high voltage similarity, ensuring the accuracy of the recorded relationship. This method is used in the low-voltage distribution power network with the consideration of various external factors that could influence the accuracy of the identification of the household-transformer relationship.
2.2 Data foundation
At present, smart meters for electrical data collection have basically been deployed with coverage in the low-voltage power distribution network with a shorter time interval (e.g., 15 min), which lays a solid data foundation for realizing the identification of household-transformer relationships in the low-voltage distribution system. The data that can be obtained from the actual project is described below.
1) Basic information of power distribution areas: the base information of the power distribution area is also called initial electricity supply facility records. Electricity supply facility records of the low-voltage distribution network usually contain the name of the power distribution network, the number of distribution transformers, the number of end-user meters, the household number, the user address, and the subordinate relationship between the transformer and the users, which is the key information for the daily maintenance of the low-voltage power distribution network of the power grid company.
2) The distribution and number of transformers and households: if the power supply of a substation is determined, the number of distribution substations and subscribers in the area can also be determined. Suppose there are
3) Transformers’ historical measurement: the distribution substation electricity data matrix
4) End-user historical measurement: The electricity information data collection system can also obtain the power, active power, and voltage data of users, and its data matrixes. Among them, the time period selected for user measurement data should be the same as the time period of the corresponding data for the power distribution substation.
2.3 Clustering based on basic information
The main inconsistencies in the practical household-transformer relationship associated with the recorded relationship in the low-voltage distribution network encompass the following aspects:
(1) There are discrepancies between the recorded household-transformer relationships in the initial information records and the actual on-site conditions. The discrepancies may arise from many aspects, such as manual entry errors, load shifts during substation maintenance, users privately modifying the connection line between their equipment and the grid, etc.
(2) There are uncertainties about the location of the households after the renovation or expansion of the low-voltage distribution network. In recent years, the structure of the distribution network has become increasingly complex due to the construction of new power equipment, such as electric vehicle charging stations, which adds intricacy to the relationship between households and transformers. Even if the initial relationship is accurate, deviations in the actual relationship between users and transformers may emerge as the network expands. Thus, it is imperative to conduct regular inspections and reviews by identifying the relationship between households and transformers.
(3) The task of identifying relationships between users and transformers is both complex and extensive in scale. Given the vast number of end-users managed by power distribution network operators and maintenance staff, tens of thousands of household-to-transformer relationships need to be clarified within a basic urban community.
Considering the aforementioned issue, by fully utilizing the geographic location information of users in the electricity supply facility record, it is possible to reduce the number of input data dimensions, thereby lessening the computational burden. This can be achieved by initially clustering users with similar geographic locations. The end-user addresses in the electricity supply facility record are manually entered and maintained and are typically in the standardized format of “province-city-district/county-street-community/road-subdivision-block-room”. As the urban districts have clearly defined boundaries and the power supply areas of power supply stations generally do not overlap, the identification of the household-transformer relationship is usually organized on a neighborhood basis. These features are utilized in this study to initially merge neighboring users, with the specific steps detailed below.
Step 1:. Normalize the customer’s address according to the standardized form.
Step 2:. Extract the subscribers of the same block and the same unit in the cell to form a subscriber collection.
Step 3:. Aggregate the neighboring users and keep only one central user to replace them. The objective function is defined as the minimum sum of the squares of the distances from each cluster member to its cluster head, as follows:
where
Step 4:. Form a sequence of central user active power and voltage data.
3 Methods
3.1 Overview of method
The flow chart of the two-stage identification method of the household-transformer relationship is shown in Figure 2, which comprises an initial clustering algorithm and a similarity assessment. The first stage mainly consists of five steps: data collection, data normalization, rule-based initial user set formation, feature extraction, and data amalgamation. In the second stage, the data matrix is linearly normalized after completeness checking. Subsequently, the Hausdorff distance between the household measurement and the transformer measurement is calculated to assess the curve similarity. Households of end-users with high similarity are then clustered and verified by the power balance of the transformer. Finally, the relationships between households and transformers are marked based on the clustering result.
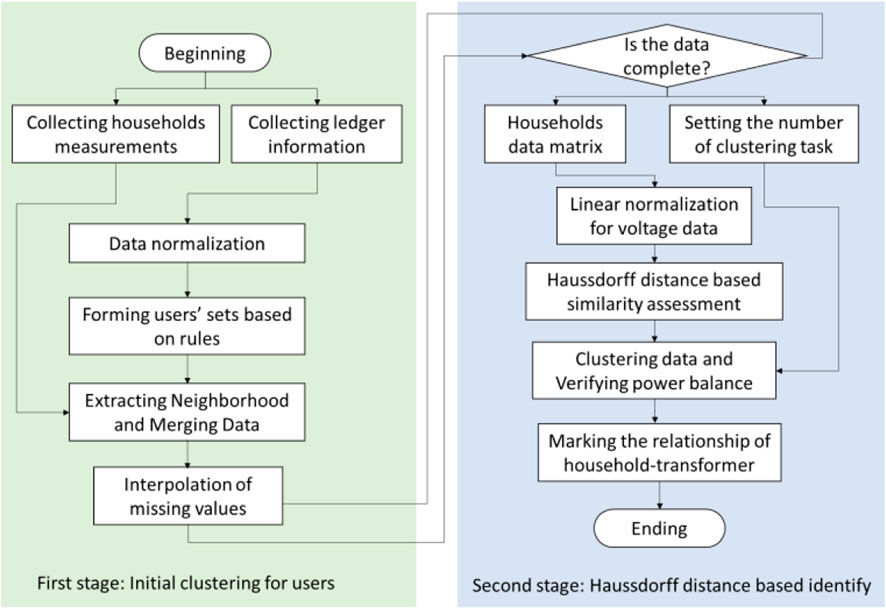
FIGURE 2. Flow chart of the proposed method.
3.2 Data processing for households and transformers
To address the issue of meter clock drift leading to inconsistencies in the voltage data time axis, this study adopts the 96-point daily measurement of the transformer as the referenced standard time axis. Subsequently, the 96-point voltage value is calculated using linear interpolation on the primary time axis, which yields the customer meter’s 96-point voltage estimate on this time axis. This process facilitates the calibration of the voltage curve on the time axis, thereby minimizing the impact of clock drift on the identification of the household-transformer relationship.
Suppose that the voltage curve of the meter has n distinct points in the interval
To complete a time series with missing segments in order to have a complete sequence of measurements, missing value interpolation should be performed on the measurement vector. Let the interpolation function be
Smaller interpolation errors lead to more precise results in the identification of similarity clusters of measurement. Let
Here
Let
Utilizing the linear interpolation method efficiently mitigates the effect of the 96-point voltage measurement time axis offset in meters on the identification of the household-transformer relationship.
3.3 Hausdorff distance-based similarity assessment
The Hausdorff distance is a metric for measuring the similarity between two sets of points, typically in Euclidean space. It has been widely used in various fields, such as computer vision, pattern recognition, and geometry. The Hausdorff distance is applied to assess the fluctuating measurement similarity between the historical measurements of households and transformers in the given areas. A smaller Harsdorff distance means a higher similarity between the household and the transformer. Therefore, by calculating and comparing the historical Hausdorff distance between the household and different transformers, the transformer with the smallest Hausdorff distance is used as the matching transformer for the household.
To augment the dataset while increasing the representativeness of the computational results and mitigating the negative impact of interference on classification results, the historical measurements are divided into several historical measurement sequences based on a sliding time window. To obtain the historical Hausdorff distance between the household and the transformer, the historical measurements were cut into measurement segments based on the sliding time window. Then, the Hausdorff distances between the household and the transformer at the corresponding time of the measurement segments are calculated and clustered. The cluster center is obtained using the K-means algorithm, and the cluster center is a metric of the average similarity between the household and the transformer.
Let X and Y be two non-empty sets of points in a Euclidean space, representing the locations of households and transformers, respectively. The Hausdorff distance of X and Y is denoted as
where sup (⋅) represents the supremum, inf the infimum, and
where
Given that voltages across various households typically exhibit a distinct similarity on the same transformer phase in substations, clustering based on voltage similarity can aid in identifying both the household-transformer and phase relationships. Numerous algorithms exist to calculate similarity using distance computation, including the Hausdorff distance, Pearson correlation coefficient, and others. The Hausdorff distance, in particular, is employed as a measure to maximize differentiation in voltage profile similarities within the same distribution area. Compared to traditional similarity measurement methods like the Pearson correlation coefficient, the Hausdroff distance offers superior advantages in addressing clock desynchronization issues. Hence, this study employs the Hausdorff distance to contrast two voltage profiles by gauging the distance between each point on one curve and its nearest counterpart on the other curve. The clustering algorithm groups users with a high degree of similarity in voltage profile to the distribution transformer.
3.4 Power balance verifying
To ensure the conservation of power within the circuits, it is essential to verify whether the power balance between transformers and end-users adheres to Kirchhoff’s law. This means that the total power supplied by all sources in a circuit must be equal to the total power consumed by all loads in the circuit. A sufficient condition for the correct household-transformer relationship is that the power input to the distribution transformer is equal to the sum of the network loss of the power system and the power consumption of the users, as shown in (11),
where
Under the condition of power balance, if a set of data enables (12) to hold, then the relationship between the transformer and households corresponding to this data set is the correct household-transformer relationships for this power distribution substation.
In general, the power residuals
4 Experiments and results
In this paper, the proposed enhancing similarity assessment solution is implemented using PyTorch ver. 1.9.1. This solution is assessed through simulation experiments based on the 64-bit computing platform consisting of an AMD Ryzen 7 5800H CPU and an NVIDIA GeForce RTX 3060 Laptop GPU.
4.1 Data description and data processing
The experiments are carried out based on the electricity production data in the low-voltage distribution network of a city in China. Since the load and power characteristics of adjacent stations are close to each other, two power stations that are easily confused belonging to the same line are selected for testing. The data contain the measurement data set and an electricity supply facility record file with basic power supply information. The measurement data contain the active power and voltage of three-phase from 2022/1/1–2022/2/28 in 2 transformers of the power distribution network, 110 household end-user meter measurements, and the basic electricity supply facility records of the power distribution substation. There are 59 household meters in Station A and 51 household meters in Station B. The measurement and transformer operation monitoring data are sampled at an interval of 15 min. The illustrations of the measurement and electricity supply facility record data are shown in Table 1.
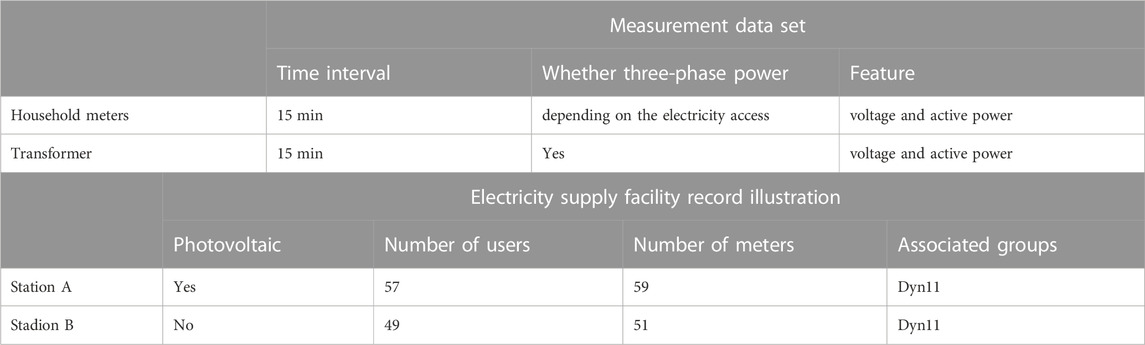
TABLE 1. The measurement data set and electricity supply facility record data.
Specifically, the measurement dataset includes three-phase voltage, three-phase active power, and the average active power of the households and the regional transformers. The measurements of households have many modes, i.e., three-phase operation, two-phase operation, and single-phase operation, depending on the customer’s wiring form. It is necessary to match the transformer with the corresponding measurement according to the different household power usage. There are a small number of data errors, omissions, and transmission failures in the customer-side meters, and the data in the data set is raw data containing environmental noise.
Data loss and omission can occur during the communication process of user-side smart terminal measurements, potentially leading to voltage and power data offset. This paper addresses such offsets by interpolating the original measurements. Figure 3 presents the raw data, where blanks indicate missing values, Black blocks represent valid data, and white blocks represent invalid data (such as the data of the phase that is not running in the single-phase operation state). Figure 4 visualizes the data post-completion of missing values. Importantly, in instances of severe data loss, i.e., more than 30% of continuous data missing, interpolation is eschewed to circumvent exacerbating errors.
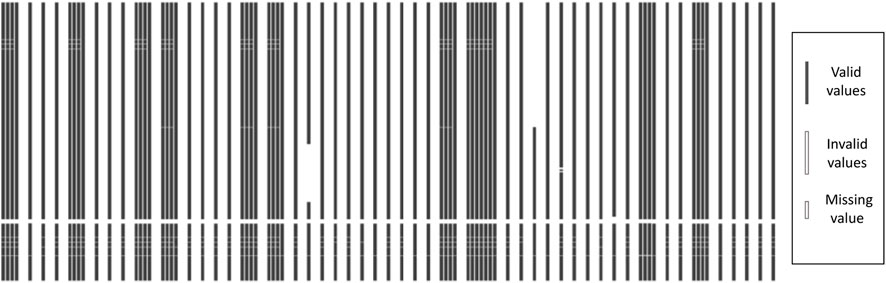
FIGURE 3. Raw data with data loss.
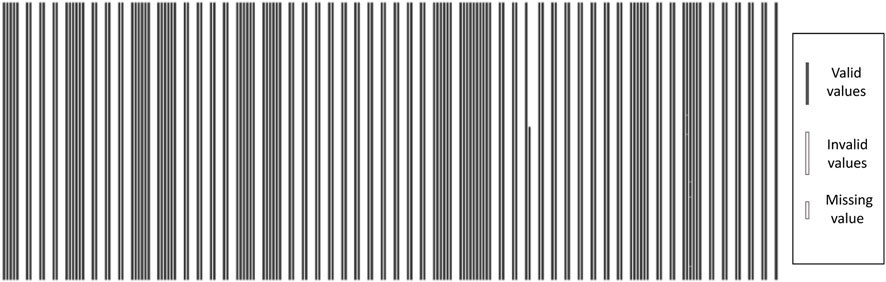
FIGURE 4. Completed data after data processing.
By comparing Figures 3, 4, it can be observed that the interpolated measurements exhibit completeness, thereby minimizing the effect of the meter’s 96-point (with a data length of 1 day) voltage measurement daily time axis offset on identifying the relationship between households and transformers.
4.2 Relationship identification
After data alignment and completion, each meter has 60 days of historical data. Subsequently, 2-day samples with time axis alignment are used as the unit of household-transformer similarity calculation. The historical measurement of each meter can be split into 58 2-day measurement segments and thus the historical measurement can be divided into 58 samples. 85% of the samples are selected for algorithm training while the remaining 15% are for testing.
The Hausdorff distances are calculated between the transformer and the user’s historical measurement segments. Subsequently, the historical Hausdorff distances are clustered for each household, determining the cluster center of the household measurement segments according to the method described in Section 3. By calculating the similarity between the historical cluster center of households and the transformer, the identification solution becomes more representative and general, which also reduces the computational load for similarity evaluation. In order to visualize the clustering effect and the similarity of the households and transformers based on Hausdorff distance, three mean voltage curves of household clustering centers are selected for comparison with the voltage of the distribution transformer, as shown in Figure 5.
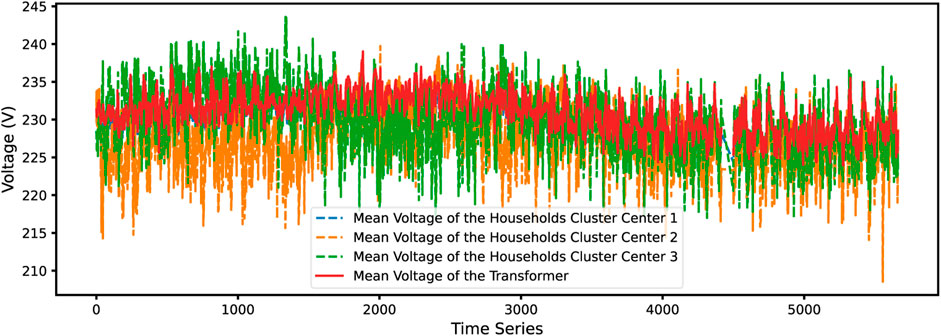
FIGURE 5. Cluster centers of household voltage and the mean voltage of the transformer in the substation.
Figure 5 shows that three cluster centers of household voltage and the mean voltage of the transformer in the substation share the same trend and some similar details. It can be inferred that the usage patterns of households are closely tied to the behavior of the transformer. This similarity in trends and details suggests that changes in the transformer measurement are likely reflective of collective changes in household electricity usage.
Given the characteristic of raw measurements, dynamic time regularization is adopted to perform sparse identification, which is based on dynamic regularization with sliding windows. Different sizes of sliding windows may influence the performance of the proposed solution. Table 2 visually illustrates the impact of varying sliding window sizes by presenting the distances and indices between two point sets. Here, the distance signifies the maximum distance between each point in the initial set and its nearest counterpart in the second set, while the index corresponds to each point in the household measurement set relative to the closest station transformer set. The experiment employs four distinct sliding window scales: 4-h, 6-h, 16-h, and 24-h.
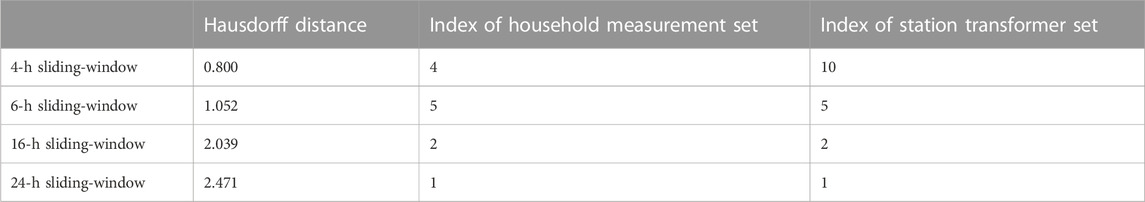
TABLE 2. Comparison of hausdorff distances-based similarity computation with different sizes of sliding windows.
It can be observed that a reduction in the size of the sliding window corresponds to a decrease in the Hausdorff distance. Given the established correspondences between samples in the household measurement set and the station transformer set that share identical indices, it is expected that the calculated Hausdorff distance and the indices between the two sets of points would be consistent. However, employing a 4-h sliding window results in a discrepancy between the index of the household measurement set and that of the station transformer set. This discrepancy suggests potential matching errors should the sliding window be set too small, leading to inconsistencies between the household and transformer measurements. Consequently, in this study, the width of the sliding window is set at 6 h.
To evaluate the performance of the clustering algorithm, the magnitude of “saturation” in the Hausdorff distance (Zaevski and Kyurkchiev, 2023) is calculated. To calculate the saturation in Hausdorff’s sense, the cumulative distribution function (CDF) curves of the historical measurements of each household meter were first calculated. The formula for calculating the saturation is as (14):
Here, g represents the graph of the completed CDF and h represents the curve consisting of two lines. The Hausdorff distance d(g, h) is the maximum value of the distance between the points on g and h. The saturation of the Hausdorff of different clusters is shown in Figure 6.

FIGURE 6. Saturation of the Hausdorff of different clusters.
After completing the identification of user-transformer relationships based on the clustering of users and transformers, it is necessary to verify the power balance on the household-transformer relationship identified by the proposed method in the power distribution substation. The power balance and power balance residuals calculation of the transformer and the end-user households in the power distribution substation are shown in Figure 7.
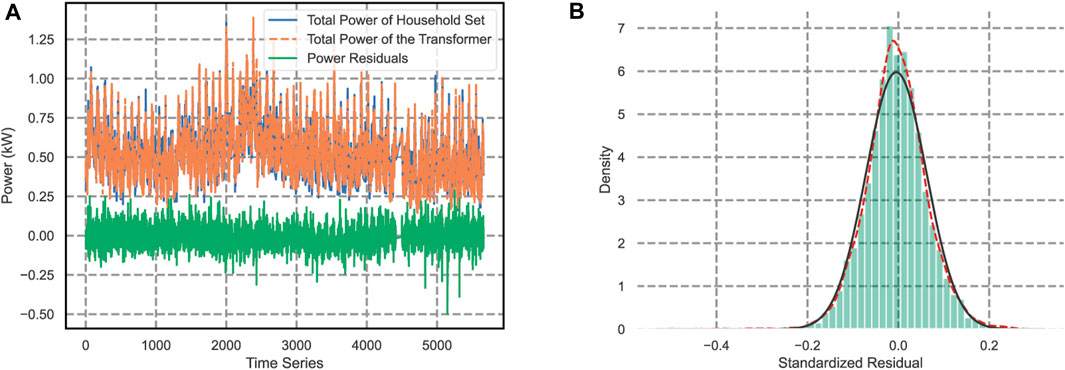
FIGURE 7. Verifying the active power balance of load and transformer load for the household. (A) The curves of the household set and transformer. (B) The distribution of power residuals between the household set and transformer.
Figure 7 shows the comparison between the total power consumption of the household set and transformer (Figure 7A) and the household-transformer power residual distribution (Figure 7B). For the correct classification of the household-transformer relationship, the expectation of power residuals should be around zero. Given the objective existence of measurement errors, the power residuals will obey the normal distribution, as shown in Figure 7B. The power balance verifies the accuracy of cluster results thus illustrating the correction of identification.
To verify the computational efficiency of the proposed method on the dataset, the computation time of the proposed user-transformer classification algorithm on a dataset of two stations and hundreds of users is tested and obtained to be 0.889s. The time consumption is considered acceptable.
4.3 Performance evaluation
The proposed method is extensively verified by two widely used performance metrics in this method, i.e., Accuracy
where TP is the number of predictions of positive classes into positive classes; TN is the number of predictions of negative classes into negative classes; FN is the number of predictions of positive classes into negative classes; and FP is the number of predictions of negative classes into positive classes. The proposed method is further assessed against typical methods for the identification of household-transformer relationships. Two data-driven methods are conducted as benchmarks, i.e., Euclidean distance-based k-means (Chen et al., 2022b) and the DTW (Yang et al., 2022).
The test is conducted on the data set with the household meters and transformer measurement samples in Table 1, which consists of the active power of three phases and the voltage of three phases. The sample of wrong relationship judgment is defined as the negative sample, and the sample of correct relationship judgment is defined as the positive sample. The metrics in (15), (16) are used to assess the effect of the proposed method. There are 472 positive samples and 510 negative samples in the test set.
Table 3 presents the numerical results of the performance comparisons between two power stations. The two power stations belong to the same power line and are easily confused. As shown in Table 3, compared with Euclidean distance-based k-means and DTW, the proposed method based on the Hausdorff distance and dynamic time regularization improves accuracy by 11.25% and 5.50%, and improves recall by 4.30% and 8.80%, respectively. The comparisons of accuracy and recall show the stable performance of the proposed method. Since the proposed method fully takes into account the voltage variation characteristics of each time period, the feature extraction effect is better, which can improve the clustering effect and the accuracy of the clustering results at the same time. However, when compared to the proposed method, several models show significantly lower accuracy rates, including Logistic Regression (57.8%), Support Vector Machine (58.7%), and Gradient Boosting Classifier (60.26%). Despite lower accuracy, these methods maintain relatively high recall rates, ranging from 76.33% to 82.17%. Lastly, the Random Forest Classifier and K-Neighbors Classifier show modest performance, with accuracy rates of 71.92% and 66.83%, and recall rates of 86.17% and 82.33%, respectively.
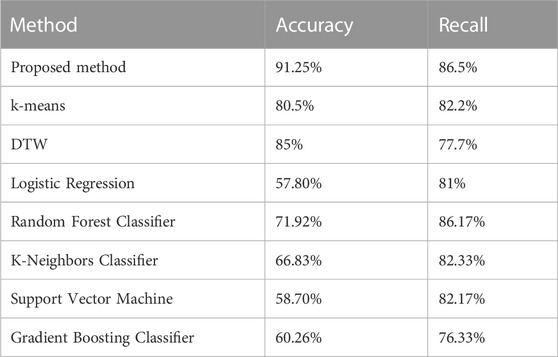
TABLE 3. Accuracy and recall comparison.
In summary, while other methods achieved acceptable performance levels, the proposed method outperformed all others in terms of accuracy, demonstrating its effectiveness.
4.4 Visualization of similarity assessment
This paper constructs a Hausdorff distance-based temporal clustering algorithm to achieve the identification of household-transformer relationships for real-time measurement data in a sliding window on the temporal sequence. In order to verify the effectiveness of the solution proposed in this paper for the identification of household-transformer relationships, the experimentally extracted user measurements are visualized and compared with the corresponding transformer measurements.
To verify the effect of the proposed solution, the voltage curves of different categories of users and their clustering center transformer curves are plotted, respectively, as shown in Figure 8. Among them, Figures 8A–C represents the category user #1 A-phase voltage curve time window curve and transformer A-phase voltage time window curve; Figures 8D–F represents the user #2 A-phase voltage curve time window curve and transformer A-phase voltage time window curve; and Figures 8G–I represents the user #3 A-phase voltage curve time window curve and transformer A-phase voltage time window curve. It can be seen from Figure 8 that the fluctuation characteristics of the clustering center curve (transformer measurement) and each user voltage curve under the same category are similar to a high degree, while the fluctuation trends of the clustering center curve and each user voltage curve under different categories are significantly different. From the comparison of user voltage curves under different categories, it can be seen that the method of clustering user voltage curves with similar trend characteristics into one category and using methods such as line loss rate and power balance to identify the transformer to which the user belongs for anomalies has a better effect on identifying the relationship between households and transformers.
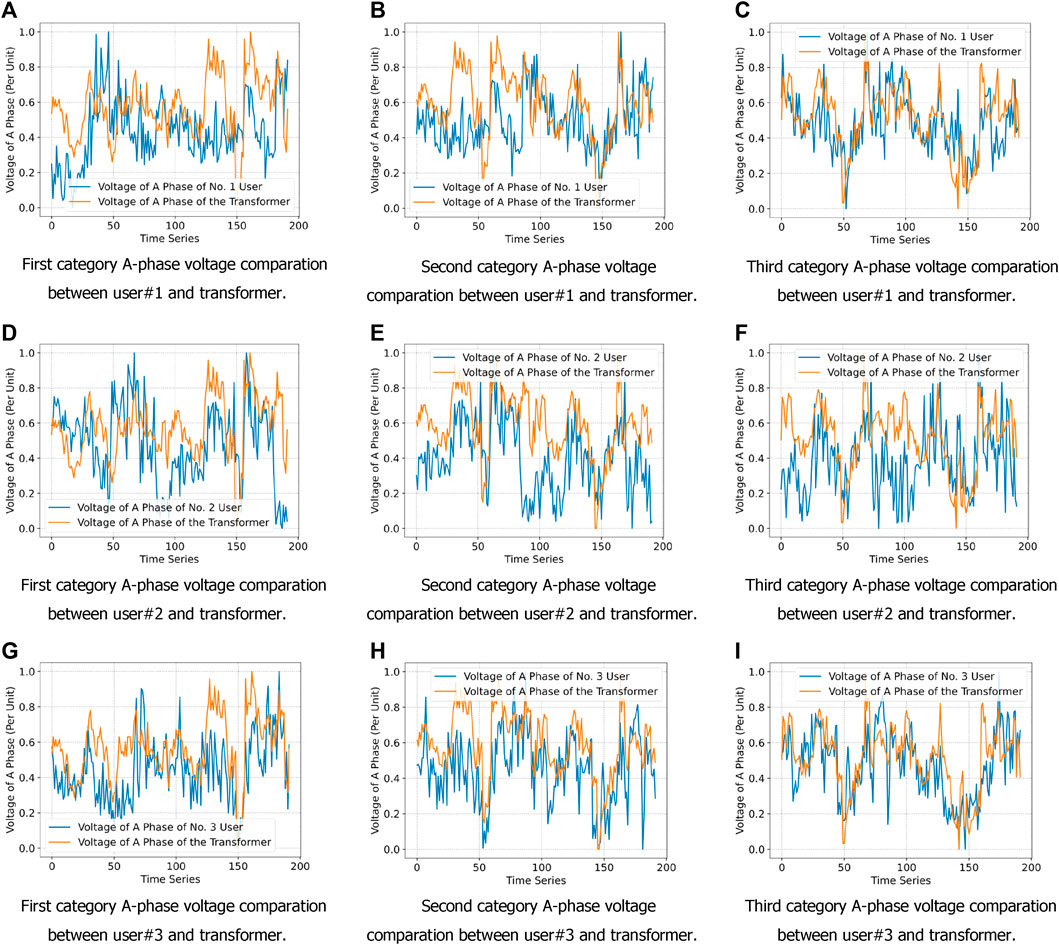
FIGURE 8. Voltage curves of different categories of households and their clustering center transformer curves. (A–C): the categories of user #1 A-phase voltage curves and transformer A-phase voltage curve; (D–F): the categories of user #2 A-phase voltage curves and transformer A-phase voltage curve; and (G–I): the categories of user #3 A-phase voltage curves and transformer A-phase voltage curve.
In order to visually demonstrate the classification abilities based on Hausdorff distance, the Hausdorff distance between the households and transformer curves is shown in Figure 9. Specifically, the distance between the household set and the corresponding transformer in the training set is shown in Figure 9A; the distance between the household set and the corresponding transformer in the test set is shown in Figure 9B; and the distance between the household set and the non-corresponding transformer in the training set is shown in Figure 9C.
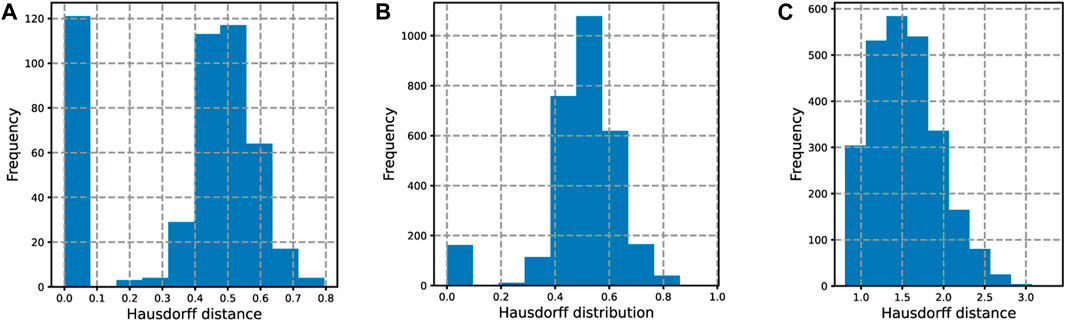
FIGURE 9. The Hausdorff distance between the users and transformer curves. (A) The distance between the household set and the corresponding transformer in the training set; (B) the distance between the household set and the corresponding transformer in the test set; (C) the distance between the household set and the non-corresponding transformer in the training set.
As can be seen from the Hausdorff distance distribution in Figures 9A–C, for the distance between the household set and the corresponding transformer, the distribution of Hausdorff distances during testing and training is very similar, both in the range of 0–0.8. As for the distance between the set of households and the non-corresponding transformer, the distribution of Hausdorff distances ranges from 1 to 3. This range is notably distinct from the previous category, suggesting that the proposed method exhibits a strong classification ability.
5 Conclusion and future work
This paper addresses the issue of the identification of inaccurate household-transformer relationships within low-voltage distribution networks. Current methods of identifying household-transformer relationships, including manual identification, power carrier communication technology, and big data analysis of smart meters, are reviewed. Given the limitations of these methods, this paper adopts missing data completions and sliding windows of time series to enhance the data quality and proposes a two-stage approach based on Hausdorff distance to improve the accuracy and scalability of household-transformer relationship identification. The superior performance of the proposed method is demonstrated through extensive tests on real historical datasets in comparison to existing benchmarks.
The proposed method for improving the performance of household-transformer relationship identification presents significant potential for real-world application in low-voltage distribution networks. The approach acknowledges practical considerations such as measurement noise, time axis offset, and missing data, which further increases its potential for seamless integration into existing infrastructures. For successful application and wide adoption of the proposed solution, future research could focus on the development of more advanced noise reduction techniques to minimize the impact of measurement noise on the household-transformer relationship identification performance. Additionally, further research could explore strategies to more effectively address the issue of time axis offset and missing data, thereby enhancing the accuracy and scalability of the proposed solution. Moreover, the proposed method could be tested and validated using larger and more diverse datasets. This would not only enhance its robustness but also its generalizability across different types and scales of low-voltage distribution networks.
Data availability statement
The raw data supporting the conclusion of this article will be made available by the authors, without undue reservation.
Author contributions
YZ: Methodology, data curation, writing, original draft preparation. XY: Supervision, reviewing and editing. HY: Visualization, investigation. All authors contributed to the article and approved the submitted version.
Conflict of interest
Authors YZ and HY were employed by the company State Grid Jiangsu Electric Power Co., Ltd.
The remaining author declares that the research was conducted in the absence of any commercial or financial relationships that could be construed as a potential conflict of interest.
Publisher’s note
All claims expressed in this article are solely those of the authors and do not necessarily represent those of their affiliated organizations, or those of the publisher, the editors and the reviewers. Any product that may be evaluated in this article, or claim that may be made by its manufacturer, is not guaranteed or endorsed by the publisher.
References
Chen, F., Tang, H., Zhou, S., Hua, W., Zhao, Y., Zeng, X., et al. “Consumer-transformer relationship identification based on UMAP and mini batch K-means,” in Proceedings of the 2022 International Conference on Mechanical, Automation and Electrical Engineering (CMAEE), Chengdu, China, December 2020, 57–61.
Chen, J., Yin, Z., Cheng, X., and Liu, Y. “Big data analysis based identification method of low-voltage substation area,” in Proceedings of the 2021 2nd International Conference on Big Data and Informatization Education (ICBDIE), Hangzhou, China, 2021, 169–172.
Chen, Q., Xia, M., Lu, T., Jiang, X., Liu, W., and Sun, Q. (2019). Short-Term load forecasting based on deep learning for end-user transformer subject to volatile electric heating loads. IEEE Access 7, 162697–162707. doi:10.1109/access.2019.2949726
Chen, Y., Wang, Y., Liu, X., and Huang, J. “Short-term load forecasting for industrial users based on Transformer-LSTM hybrid model,” in Proceedings of the 2022 IEEE 5th International Electrical and Energy Conference (CIEEC), Nangjing, China, May 2022, 2470–2475.
Deng, W., Zhu, J., Tang, H., Hu, W., Liu, Y., and Guo, Q. “Users-transformer relationship identification based on smart meter data,” in Proceedings of the 2021 China International Conference on Electricity Distribution (CICED), Shanghai, China, April 2021, 1040–1044.
Gao, Q., Han, B., Huang, X., Zhang, P., Liu, J., and Ge, L. “Verification method of topological relationship of low voltage distribution equipment based on KNN and Pearson correlation coefficient,” in Proceedings of the 2021 International Conference on Power System Technology (POWERCON), Haikou, China, December 2021, 127–132.
Zepu, G., Yun, Z., Yilan, Y., Yongjian, L., Ziwei, X., and Lianmei, Z. (2020). Low voltage distribution network topology identification method based on knowledge graph. Power Syst. Prot. control 48 (2), 34–43. doi:10.19783/j.cnki.pspc.190379
Hu, W., Guo, Q., Liu, Y., Wang, W., Wang, Y., and Song, S. “Real-time line loss calculation method based on equivalent resistance of low voltage distribution network,” in Proceedings of the 2021 China International Conference on Electricity Distribution (CICED), Shanghai, China, April 2021, 1045–1049.
Hu, W., Guo, Q., Wang, W., Wang, W., and Song, S. “Research on user- transformer relationship based on improved dynamic time warping algorithm,” in Proceedings of the 2021 IEEE 5th Conference on Energy Internet and Energy System Integration (EI2), Taiyuan, China, October 2021, 485–489.
Hu, W., Liu, Y., Guo, Q., Wang, J., Wang, Y., and Zhao, Z. “Detection of users-transformer relationship in the secondary power distribution system with smart meter data,” in Proceedings of the 2020 15th IEEE Conference on Industrial Electronics and Applications (ICIEA), Kristiansand, Norway, November 2020, 449–454.
Hu, W., Liu, Y., Guo, Q., Wang, W., Song, S., and Liu, Y. “A data-driven method of users-transformer relationship identification in the secondary power distribution system,” in Proceedings of the 2020 IEEE 4th Conference on Energy Internet and Energy System Integration (EI2), Wuhan, China, October 2020, 585–590.
Li, P., Yan, Y., Xu, M., Liu, F., and Sun, G. “The reasearch of users-transformer relationship verification method based on data-driven,” in Proceedings of the 2019 IEEE Innovative Smart Grid Technologies - Asia (ISGT Asia), Chengdu, China, May 2019, 2550–2554.
Liu, C., Wang, J., Wu, M., Bai, J., Wang, X., and Lian, L. “Research on the transformer area recognition method based on improved K-means clustering algorithm,” in Proceedings of the 2019 IEEE Innovative Smart Grid Technologies - Asia (ISGT Asia), Chengdu, China, May 2019, 4137–4141.
Liu, J., Ren, H., Xie, L., Liu, X., Zhang, S., and Chen, L. “Hierarchical identification method of household-transformer relationship based on adaptive piecewise aggregation approximation,” in Proceedings of the 2022 IEEE International Conference on Artificial Intelligence and Computer Applications (ICAICA), Dalian, China, June 2022, 515–520.
Liu, L., Li, F., Zhou, Y., Cheng, Z., Qu, M., Yi, L., et al. “An identification algorithm of low voltage user-transformer relationship based on improved spectral clustering,” in Proceedings of the 2021 IEEE 2nd China International Youth Conference on Electrical Engineering (CIYCEE), Chengdu, China, December 2021, 1–5.
Qin, H., Han, Y., Liu, Z., Wang, S., Wang, H., and Liu, H. (2022). Application of correlation coefficient method in identifying household-transformer relationship. Highlights Sci. Eng. Technol. 7, 180–188. doi:10.54097/hset.v7i.1055
Jiaju, W., Zhongbing, W., Zhongxiao, H., Jia, W., Zhi, X., and Qi, W. (2020b). Identification method of station-household relationship based on multidimensional scale analysis and improved k-means. Electr. Autom. 42 (2), 56–59. doi:10.3969/j.issn.1000-3886.2020.02.017
Wang, J., Wang, Y., Lang, B., Liu, Y., Zhang, Y., and Guo, Q. “New design and implementation of power distribution network management system,” in Proceedings of the 2020 15th IEEE Conference on Industrial Electronics and Applications (ICIEA), Kristiansand, Norway, November 2020, 850–854.
Wang, Z., Yan, Y., Bao, W., Wang, Q., and Li, L. “Identification of household variation relation in low voltage distribution network based on trend similarity and distance measure (CICED 2022),” in Proceedings of the 2022 China International Conference on Electricity Distribution (CICED), Changsha, China, September 2022, 680–684.
Yang, Z., Ye, X., Yang, X., Pan, N., and Li, G. “ERP and DTW-based transformer-customer identification,” in Proceedings of the 2022 IEEE 4th Eurasia Conference on IOT, Communication and Engineering (ECICE), Yunlin, Taiwan, October 2022, 632–635.
Zaevski, T., and Kyurkchiev, N. (2023). On some composite Kies families: Distributional properties and saturation in Hausdorff sense. Mod. Stochastics Theory Appl. 10, 287–312. doi:10.15559/23-VMSTA227
Zhang, X., Yang, X., Liu, Z., and Zhang, Z. “Research on low voltage topology recognition based on relevance of feature information,” in Proceedings of the 2021 6th International Conference on Power and Renewable Energy (ICPRE), Shanghai, China, September 2021, 749–754.
Zhao, J., Cai, Y., Guo, W., and Li, J. “User-transformer relationship verification method of low voltage distribution network based on voltage correlaion analysis,” in Proceedings of the 2021 IEEE International Conference on Electronic Technology, Communication and Information (ICETCI), Changchun, China, August 2021, 163–166.
Zhou, L., Wen, F., Yang, X., and Zhong, Y. (2022). User-transformer connectivity relationship identification based on knowledge-driven approaches. IEEE Access 10, 54358–54371. doi:10.1109/access.2022.3175841
Zhu, W., Tian, Y., Yu, H., Liu, Y., Wang, Y., and Zhang, K. “The verification method of low voltage station topology recognition based on DTW algorithm,” in Proceedings of the 2021 IEEE International Conference on Advances in Electrical Engineering and Computer Applications (AEECA), Dalian, China, August 2021, 14–17.
Zou, W., Hao, S., Ge, H., Xia, Y., and Ma, G. “Identification method for household-transformer relationship in low-voltage transformer area based on LCSS-DBSCAN,” in Proceedings of the 2022 IEEE 3rd China International Youth Conference on Electrical Engineering (CIYCEE), Wuhan, China, November 2022, 1–6.
Keywords: household-transformer relationship identification, low-voltage distribution network, Hausdorff distance, data quality, clustering algorithms
Citation: Zhu Y, Yang X and Yan H (2023) Data-driven identification of household-transformer relationships in power distribution networks using Hausdorff similarity assessment. Front. Energy Res. 11:1233827. doi: 10.3389/fenrg.2023.1233827
Received: 02 June 2023; Accepted: 13 July 2023;
Published: 07 August 2023.
Edited by:
I. M. R. Fattah, University of Technology Sydney, AustraliaReviewed by:
Rui Wang, Northeastern University, ChinaNikolay Kyurkchiev, Plovdiv University “Paisii Hilendarski”, Bulgaria
Rudrendu Kumar Paul, Walmart Labs, United States
Copyright © 2023 Zhu, Yang and Yan. This is an open-access article distributed under the terms of the Creative Commons Attribution License (CC BY). The use, distribution or reproduction in other forums is permitted, provided the original author(s) and the copyright owner(s) are credited and that the original publication in this journal is cited, in accordance with accepted academic practice. No use, distribution or reproduction is permitted which does not comply with these terms.
*Correspondence: Yuru Zhu, amtseWpfMTdAMTI2LmNvbQ==