 Faisal Shehzad1
 Zahid Ullah
 Khursheed Aurangzeb
 Sheraz Aslam
94% of researchers rate our articles as excellent or good
Learn more about the work of our research integrity team to safeguard the quality of each article we publish.
Find out more
ORIGINAL RESEARCH article
Front. Energy Res., 27 September 2023
Sec. Smart Grids
Volume 11 - 2023 | https://doi.org/10.3389/fenrg.2023.1232930
Electricity theft damages power grid infrastructure and is also responsible for huge revenue losses for electric utilities. Integrating smart meters in traditional power grids enables real-time monitoring and collection of consumers’ electricity consumption (EC) data. Based on the collected data, it is possible to identify the normal and malicious behavior of consumers by analyzing the data using machine learning (ML) and deep learning methods. This paper proposes a deep learning-based meta-learner model to distinguish between normal and malicious patterns in EC data. The proposed model consists of two stages. In Fold-0, the ML classifiers extract diverse knowledge and learns based on EC data. In Fold-1, a multilayer perceptron is used as a meta-learner, which takes the prediction results of Fold-0 classifiers as input, automatically learns non-linear relationships among them, and extracts hidden complicated features to classify normal and malicious behaviors. Therefore, the proposed model controls the overfitting problem and achieves high accuracy. Moreover, extensive experiments are conducted to compare its performance with boosting, bagging, standalone conventional ML classifiers, and baseline models published in top-tier outlets. The proposed model is evaluated using a real EC dataset, which is provided by the Energy Informatics Group in Pakistan. The model achieves 0.910 ROC-AUC and 0.988 PR-AUC values on the test dataset, which are higher than those of the compared models.
Non-technical losses (NTLs) are a major concern nowadays, defined as the energy consumed by clients without paying bills to electric utilities. These losses occur due to physical tempering of smart meters, energy fraud, installation error, inappropriate parameter settings of smart meters, etc., (Aslam et al., 2021; León et al., 2011; Glauner et al., 2016; Chen et al., 2023; Shehzad et al., 2022). Moreover, these losses are only not accountable for high revenue losses for power providers but also negatively impact smart grid reliability. Electricity theft is a primary reason for NTLs that are performed through meter tempering, bypassing smart meters, direct connections to distribution lines, changing meter readings over communication links, double tapping attacks, etc., (Shehzad et al., 2022; McLaughlin et al., 2013; Khattak et al., 2022).
A recent report indicates that NTLs cause a revenue loss of 96 billion Canadian dollars yearly; this amount is enough to supply energy to 77,000 homes for 1 year (Zheng et al., 2017; Haq et al., 2023). According to the latest World Bank report, India, China, and Brazil bear losses of 25%, 16%, and 6%, respectively, on their total electric supply (Aryanezhad, 2019). These losses are not only limited to developing countries; it is estimated that developed countries such as the United Kingdom bear £173 million, while the United States has to pay $6 billion every year (Jokar et al., 2015; Saraiva et al., 2015). Another report estimated that power companies pay more than 20 billion dollars annually for electricity theft. In addition, electricity theft creates many issues in smart grids like a high load on a grid that may create fire shocks and affects public safety. From the aforestated discussion, it is concluded that an accurate electricity theft detection (ETD) model is required to reduce financial loss and save the infrastructure of electric utilities.
Substantial research work has been performed for accurate ETD. Conventional theft detection methods include manually checking the unauthorized line diversions, comparing the tempered meters with benign ones, and human verification of faulty and problematic meters. However, these methods have low detection accuracy, are expensive, time-consuming, and lead to unreliable results. The introduction of the smart grid brings new opportunities for detecting electricity theft. It consists of a traditional grid system, communications technologies, smart meters, and sensors for collecting data and computing facilities to manage the self-healing mechanism (Jiang et al., 2016; Ahir and Chakraborty, 2022). So, smart meters and sensors collect information about voltage level, power factor, electricity price at the current moment, status of grid infrastructure, and consumption behavior of consumers. Moreover, they help maintain energy and information flow between consumers and electric utilities (Batalla-Bejerano et al., 2020; Zidi et al., 2023). These collected data help design advanced algorithms, which control demand and response (Langendahl et al., 2019; Ahmed et al., 2019) and predict the electricity prices (Chang et al., 2019; Peng et al., 2018; Qiao and Yang, 2020). Some studies (Jokar et al., 2015; Punmiya and Choe, 2019; Buzau et al., 2018; Zheng et al., 2017; Ramos et al., 2016; Huang and Xu, 2021; Gunturi and Sarkar, 2021; Li S. et al. 2019; Ibrahim et al., 2021) show that it is possible to detect malicious patterns in electricity consumption (EC) data by performing an analysis using machine learning (ML)/deep learning (DL) methods. However, most of the studies which are scrutinized for ETD have the following drawbacks:
• The false-positive rate is very high, which is not bearable by electric utilities,
• Most of the existing methods are based on specific hardware devices or sensors, which are very expensive,
• Individual classifiers like support vector machine (SVM), decision tree (DT), and naive Bayes (NB) have low accuracy,
• The class imbalance problem is tackled using under- and over-sampling methods, which create information loss and duplication of data, leading to underfitting and overfitting issues,
• In some cases, class imbalance problems or uneven distribution of samples is not tackled in a proper way, which pushes the ML/DL toward the majority class, which leads to biased results,
• Individual classifiers suffer in overfitting, which decreases their generalization property, and
• Most of the researchers focus on bagging and boosting methods. They ignore the efficacy of stacking methods for detecting malicious patterns in EC data.
Therefore, this article aims to develop a new model that solves the aforementioned concerns. So, a DL-based meta-learner is proposed, which has two folds. At fold-0, conventional ML classifiers learn and extract diverse knowledge from EC data. These multiple classifiers learns based on the same dataset, but differently. After this, a multilayer perceptron (MLP) is employed, which is trained and tested using prediction results of fold-0 classifiers. An MLP model gives different weightage to each classifier on its prediction capability and establishes a non-linear relationship among them. This process improves its performance and helps overcome the overfitting problem of individual classifiers. Furthermore, the class imbalance problem is a severe issue in ETD. Due to this, ML/DL models tend toward the majority class and ignore the minority class samples. Consequently, these classifiers lead to false alarms and produce biased results. This study developed a hybrid approach based on Adaptive Synthetic (oversampling) and TomekLinks (undersampling) to tackle the class imbalance problem. The main contributions of this study are mentioned here.
• A deep learning-based meta-learner model is developed to detect malicious patterns in the EC data. According to the analyzed literature, this is the first study that utilizes the meta-learner concept in smart grids.
• Uneven distribution of class samples is a severe issue, handled through a hybrid approach.
• Extensive experiments are conducted on the real dataset to evaluate the efficacy of the proposed meta-learner model and compare its results with those of other boosting, bagging, and standalone models.
The remaining article is organized as follows. Related work and description of the proposed model are explained in Section 2 and Section 3, respectively. The experimental and results discussion is given in Section 4. The conclusive note on this study is presented in Section 5.
In this section, existing ETD methods that are already proposed in the literature are comprehensively discussed. These methods analyze the EC data and differentiate between normal and malicious patterns. Jokar et al. (2015) proposed a consumption pattern-based electricity theft detector based on the SVM classifier. However, they do not utilize any feature engineering technique to select and extract optimal attributes from EC data. Moreover, the SVM classifier has a large execution time and performs poorly on noisy datasets. Punmiya and Choe (2019) worked on optimal feature selection using stochastic and built-in modules of gradient boosting classifiers (GBCs). They proved that fewer features reduce ML models’ complexity and overfitting issue while increasing their performance in terms of the detection rate. However, GBCs have a large number of hyperparameters, which are difficult to be tuned.
In Buzau et al. (2018), a solution for NTL detection is presented. The different features are derived from EC data and historical information of smart meters using z-score, K-means clustering, and local outlier factors. The derived features are fed as input into several ML algorithms like SVM, LR, K-nearest neighbor, and extreme gradient boosting (XGB). The work performed in this study to tackle the curse of the dimensionality issue is mostly based on manual feature engineering, which is a very time-consuming and expensive task. Buzau et al. (2019) proposed a hybrid DL model with a self-learning ability to extract abstract or latent features from EC data. Moreover, this is the first study that integrates both sequential and non-sequential information. However, this study does not tackle the class imbalance problem, which affects the model’s performance in real-world scenarios (Qin et al., 2020).
Zheng et al. (2017) developed a hybrid DL model based on a convolutional neural network and MLP. The former is utilized to extract latent or abstract patterns, while the latter is employed to retrieve global knowledge in EC data. Extensive experiments are conducted to evaluate the performance of the proposed model, and the authors argue that a hybrid model performs better than individual ones. However, a DL model requires a huge volume of data and computation power, which is the main hurdle for its real-time applications in the smart grid. Another DL-based model is proposed to detect the losses at the generation and consumption sides (Nabil et al., 2019; Takiddin et al., 2020). Li W. et al. (2019) developed a multimodel based on RNN, MLP, and LSTM layers. Moreover, its performance is measured by employing the simple moving average. The model is trained on real data collected using a VeraEdge controller. However, the accuracy is only utilized to check the model performance, which is not a good measure to evaluate DL or ML models, where data are unevenly distributed. The high dimensionality of data is another concern that badly affects the efficacy of ML or DL models. Ramos et al. (2016) utilized metaheuristic techniques to select optimal features from EC data. Huang and Xu (2021) extracted features using a stacked denoising autoencoder, while Kong et al. (2021) employed the kernel fuzzy C-means algorithm and a simple autoencoder for this purpose.
Gunturi and Sarkar (2021) proposed an energy theft detector that is based on ensemble approaches. They argue that bagging models perform better as compared to boosting ones. Moreover, near-miss and synthetic minority oversampling techniques are employed to tackle uneven distribution of data. However, undersampling methods lose valuable information from data, while oversampling techniques create an overfitting problem. The convolutional neural network (Li S. et al., 2019) is employed to extract the features, which are fed as input to the RF to differentiate between normal and malicious samples. However, their proposed model yields a low detection rate and a high false-positive rate (FPR).
The diagram of the proposed framework is shown in Figure 1. The EC dataset is taken from an electric utility and reduced from 1 min to half-hourly because a high sampling rate affects consumers’ privacy and intensive computation resources are required to train ML and DL models. The acquired dataset only contains normal samples. So, malicious samples are generated by applying theft cases and concatenating them with normal samples. The description of the theft cases is given as follows. After applying theft cases, the dataset is deemed suitable for applying ML/DL classifiers. However, the dataset has an imbalanced nature, which tends the ML/DL toward the majority class and ignores the minority class samples. Consequently, their performance is affected. So, a newly developed sampling approach is applied, which generates the samples of minority classes to solve the class imbalance problem. To avoid data leakage issues, the sampling approach is only applied to training data. After performing the data preprocessing steps, it is time to choose/develop an appropriate classification strategy for the identification of malicious and normal samples. “Unity is strength” is a well-known quotation that is best utilized by ensemble approaches. In the current era, stacked ensembles have received considerable attention, where they have been combined with ML frameworks to win many Kaggle and Netflix competitions (Olasehinde et al., 2020). In this article, a stacked-based meta-learner strategy is adopted, which has two-fold benefits. In the first fold, multiple well-performing classifiers get diverse knowledge in different ways on the EC dataset, and in the second fold, an MLP is chosen as a meta-learner, which takes the diverse knowledge of these classifiers as input and generates accurate and robust results. The description of each step is given as follows.
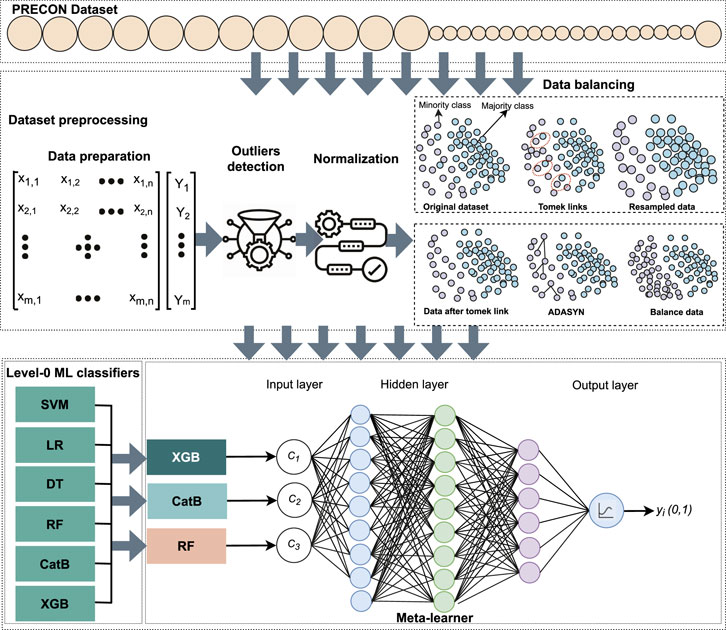
FIGURE 1. Proposed model.
The PRECON1 dataset is utilized in this study to evaluate the performance of the proposed meta-learner strategy. It is collected by students of Lahore University of Management Sciences from Lahore, Pakistan’s second largest city. The dataset includes EC usage reports of 42 houses for 1 year, which belonged to people from different financial and demographic backgrounds. The consumers who participated in this research agreed to share their EC patterns. So, it is a reasonable assumption that all consumers are honest (Nadeem et al., 2019). Moreover, the large number of electricity usage patterns, long period of measurements, and public availability of this dataset make it an excellent source for research in the smart grid domain. Moreover, the sampling rate is reduced from 1 min to half-hourly by simply taking the mean because a high data sampling rate requires intensive computational resources for training of ML/DL models and also affects consumer privacy. Now, a vector, Xt = {xt1, xt2, xt3 … xt48}, contains 48 values to represent 1 day.
Theft attacks to generate malicious samples: For supervised learning methods, a labeled dataset containing both benign and malicious samples is required. However, the PRECON dataset only contains normal samples because theft cases rarely happen in real-world scenarios. The first approach is to apply clustering algorithms to detect malicious patterns in the EC data. However, these clustering algorithms do not give optimal results because the minor changes affect the overall distribution of data. So, a good approach is to convert the data into a supervised learning problem where each record has an associated target label as a malicious or normal sample.
where [x11, x12, … x1n] is the record of a consumer and yi is an associated label. In the index, xmn, m indicates the record number and n is the associated value. To generate the malicious samples for conversion of data into a supervised learning problem, six theft attacks are applied to the normal records, and their descriptions are given as follows in Table 1. e1(⋅) multiplies meter readings with the same random number and reports less consumption as compared to actual usage. e2(⋅) sends zero or complete consumption to an electric utility. In the case of e3(⋅), a meter reading is multiplied with a different random number after each interval. e4(⋅) and e5(⋅) report mean consumption or random factor of mean consumption to the electric utility. e6(⋅) sends a reverse order of meter readings. e5(⋅) and e6(⋅) launch attacks against voltage control mechanisms, shift the EC order from on-peak hours to off-peak hours, and reduce the electricity bill (Jokar et al., 2015). Figure 2 shows the EC of a consumer before and after applying the theft attacks.

TABLE 1. Theft cases.
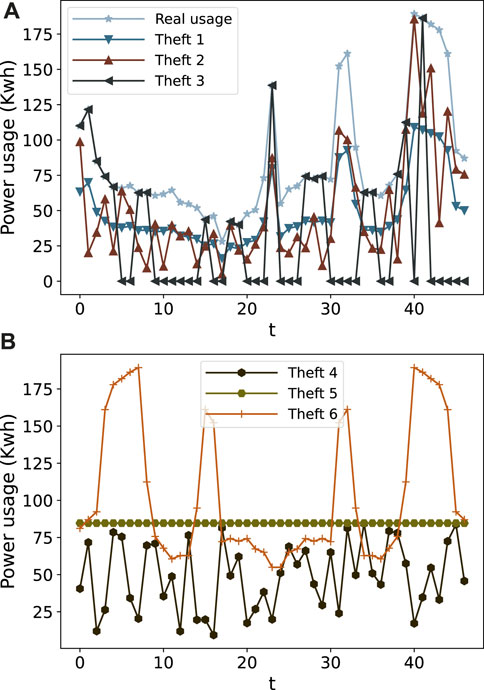
FIGURE 2. (A, B) EC before and after applying theft attacks.
Data preprocessing is an important step in the analysis of big data. In the literature, garbage in and garbage out is a well-known quotation about this step, which indicates that the performance of ML algorithms completely depends upon the quality of data. So, analyzing data that are not carefully screened generates poor results and misleads the decision process. So, in this article, a data preprocessing module is developed to enhance result quantification in terms of true positive (TP), true negative (TN), false positive (FP), and false negative (FN). The data preprocessing steps start with handling outliers, progresses with data standardization, and finally, the class imbalance problem is tackled using a newly developed hybrid sampling approach.
During data analysis, some erroneous values (i.e., outliers) are found in the PRECON data that mislead the training process of a model. Because of this, it takes longer training time, and ultimately generates mediocre results. So, outliers are restored using the following Eq. 1.
Here, O shows μ(xi) + 2* σ(xi), while μ and σ indicate the average and standard deviation, respectively.
ML or DL models learn the mapping among the input features (with different scales and values) and a target variable. If a model is trained on the features with larger values, it will learn the weights of larger values and ignore the smaller ones. Consequently, it will produce unstable results with high generalization errors. So, after removing the outliers, min–max normalization is applied to handle the scaling issue, and its mathematical form is elaborated in Eq. 2.
where min (Xi) and max(Xj) are minimum and maximum values in the record of consumer i, respectively.
Class imbalance is a major issue in ETD in which the sample of honest consumers (majority class samples) is higher than the sample of malicious consumers (minority class samples). It creates an uneven distribution of target variables, and data are skewed toward the majority class. So, ML or DL models are biased toward majority class samples and ignore minority ones. If they are trained on imbalanced data, they give biased results, which are unacceptable in the ETD domain because electric utilities have a limited budget for onsite inspection (Batista et al., 2003). Furthermore, for the efficient and unbiased performance of supervised learning models, it is necessary to extract and learn valuable patterns from balanced data. Although the considered dataset in this study has an imbalanced nature, and this case occurs in more ETD scenarios, it is necessary to balance the EC data before extracting features and patterns. Hence, to solve the declared issue, a new sampling approach is proposed that holds the characteristics of undersampling and oversampling approaches to reduce the misclassification rate. This approach is based on Adaptive Synthetic (ADASYN) and TomekLinks, is named AST, and is used for the first time in the smart grid domain to handle uneven data distribution.
In AST, ADASYN is a sampling approach that generates the minority class samples by leveraging the concept of adaptive learning, which overcomes the bias issue and focuses on those samples that are hard to learn. The generation of minority class samples starts by counting the number of majority class samples around the minority samples and then calculating the density distribution ri…m. Here, m is the total number of samples of the minority class. r decides how many new samples will be generated around each minority class sample xi. After that, a random xzi sample is chosen from K-nearest neighbors of xi, and a new sample is created by using ai = xi + (xi − xzi) × λ and added into the data. λ is a random number whose value lies between 0 and 1. This process continues until the desired distribution of both classes is not achieved. More information about the working mechanism of ADASYN can be found here (He et al., 2008).
Although oversampling approaches solve the class imbalance problem, they still have some issues like blindness of neighbor selection, sample overlapping, and noise inference (Jiang et al., 2021; Khan et al., 2021). As in the case of sample overlapping, some newly generated data points may be invaded into majority class data due to undefined clusters. Another concern is that noise inference may introduce some noisy data points near the decision boundary and confuse the learning algorithm. To address the mentioned issues, TomekLinks is introduced, which magically removes those samples that are hard to learn.
It creates a pair of samples and measures the Euclidean distance d(xi, xj) between them. xi belongs to the majority class, while xj is part of the minority class. The generated pair is declared as a Tomeklink if no sample xk follows the following conditions d(xi, xk) < d(xi, xj) or d(xj, xk) < d(xi, xj). So, in this way, the unwanted samples from the majority class are removed to equalize the class distribution. Further information about TomekLinks can be found here (Tomek, 1976).
To develop the AST method, ADASYN and TomekLinks methods are combined by exploiting the Python imbalanced library. This library has been developed by experts to perform sampling tasks. It has built-in sampling approaches (Lemaître et al., 2017). First, TomekLinks is applied to remove the unwanted samples near the decision boundary, which are hard to learn. After that, ADASYN is utilized to equalize the distribution of both classes. It is possible that excellent results can be achieved with undersampling and oversampling approaches. However, the former may discard valuable information that is critical for making a robust decision boundary, while the latter synthesizes or duplicates the samples that increase the generalization error (bias) on the test data. The literature work indicates that interesting results can be achieved by combining both strategies, where a modest amount of oversampling of the minority class increases biases toward the minority class while a modest amount of undersampling of the majority class reduces bias toward majority samples. In the case of the PRECON dataset, it contains 1 (minority): 8 (majority) class samples. First, TomekLinks is applied, which removes redundant samples from PRECON data by utilizing link concepts. Next, ADASYN is exploited, which produces a ratio for both classes of 1:1 by synthesizing or generating the samples of minority classes. This phenomenon can be observed in Figures 3A, B, where green and red samples represent majority and minority class samples before and after handling uneven distribution of data, respectively.
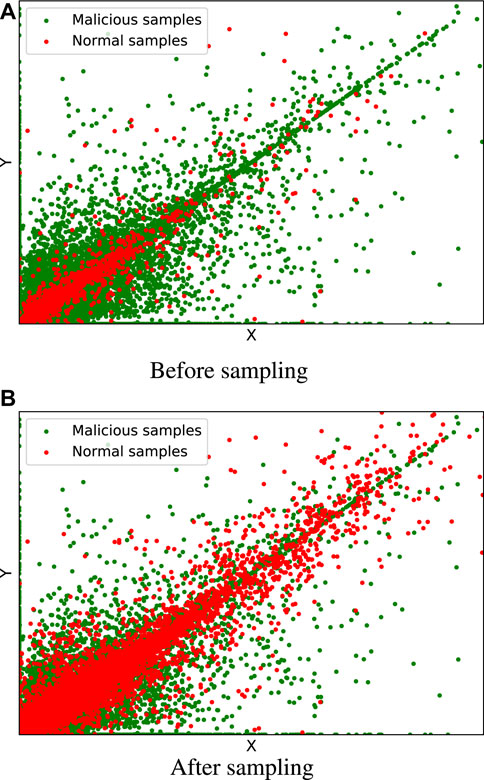
FIGURE 3. Data distribution of PRECON. (A) Before Sampling, (B) After Sampling.
Support vector machine: The SVM is a supervised learning method, which is mostly used for classification and regression tasks. It was developed in the well-known AT&T Bell Laboratories by Vladimir Vapnik. As mentioned in the literature, it is mostly used for anomaly detection in electric utilities (Jokar et al., 2015). The SVM algorithm moves the input features into high-dimensional data space and draws a decision boundary between samples of both classes with the help of support vectors. The support vectors are data points, which are taken from the training dataset.
In this study, C and radial basis function (RBF) hyperparameters are utilized to achieve good results. The C controls the misclassification rate, while the RBF converts the complex and non-linear patterns into linear ones. However, the noise factor cannot be discarded in real-world scenarios. So, a small change in testing data suddenly decreases its performance. That is why it is very difficult to find the right kernel function. Moreover, its computation and memory complexity is increased in the case of large datasets because it draws a large number of support vectors in high-dimensional data space, which are stored in memory (Jokar et al., 2015).
Gradient boosting classifiers: They are well-known in the research and data science community. They are utilized for both classification and regression tasks. These methods are based on ensemble trees, which learn specific rules to classify between normal and anomalous data points, and these are called gradient boosting methods because they use gradient loss function to reduce the wrong predictions of weak learners and convert them into strong ones. XGB and categorical boosting (CatB) are the most regularized versions of gradient boosting methods. XGB is a popular algorithm in the Kaggle community, and it won 17 competitions out of 29 in 2015. It utilizes the Gini index, similarity score, and regularization parameters to improve the predictive performance of weak learners.
On the other hand, CatB utilizes order boosting and oblivious decision trees to learn decision rules from EC data. These trees have equal splitting criteria on each node, which makes CatBoost less prone to overfitting and increases its prediction performance on testing data. Although experimental results indicate that gradient boosting classifiers give good results, they continuously minimize the loss function value, which overemphasizes outliers and has a high chance of overfitting. In most cases, they require more than 1,000 trees, which increases computational and memory complexity. Moreover, they have a large number of hyperparameters that are difficult to tune (Punmiya and Choe, 2019).
Random forest (RF) is an ensemble algorithm that first builds a forest of decision trees and then uses the wisdom of majority to decide about anomalous or non-anomalous EC patterns. RF eradicates the limitations of the decision tree algorithm and controls its overfitting problem. It also gives better prediction results than a decision tree algorithm. However, it gives lower performance than gradient-boosting algorithms and is computationally expensive because it builds a large number of decision trees to overcome the overfitting issue (Qiao and Yang, 2020).
Decision tree: It is a simple supervised machine learning algorithm that is utilized for both classification and regression problems. It draws a simple tree-like structure where decision rules are learned from root nodes to leaf nodes to differentiate between normal and malicious theft patterns. It is simple, easy to understand, and easy to implement. However, it has a high chance of overfitting because, in the case of large datasets, it creates a complex decision structure. Moreover, it has an unstable nature because a small change in data leads to a completely different tree structure. DT follows a greedy search strategy, which cannot guarantee to return an optimal solution.
Logistic regression: It is a basic model in binary classification, where input features are multiplied with a weight matrix, which is learned during the training process. It is also known as a one-layer neural network. However, it is unable to learn complex and non-linear patterns in EC data because it considers the linear relationship between input and output variables.
In previous studies, a large number of multiple classifiers, either DL or ML, were applied to smart grid data to detect the anomalies; however, none generated fully accurate results, and mistakes were noted in different aspects. In the current era, ensemble approaches, especially stacking, have won many Kaggle competitions and proven their own worth. Stacking (stacked) is an ensemble approach that is mostly adopted to reduce the generalization error by combining the predictions of multiple classifiers. It is based on a meta-learner which is responsible for merging the predictions of ML classifiers and getting skills or knowledge from EC data in a diverse way. In the first phase, multiple ML classifiers Ci(1−6) are applied to EC data, which get independently diverse knowledge in a parallel fashion and provide a vector of their predictions. After that, the prediction of the three best classifiers C1−3 is utilized to build a new dataset X = [c1, c2, c3]. This new dataset is fed into a meta-learner classifier for its training. Once the meta-learner is trained, its performance is analyzed on the test data. The complete working of the framework can be seen in the form of a flowchart in Figure 4. In this article, the MLP model is used as a meta-learner to stack prediction of multiple classifiers. An MLP is inspired by the working mechanism of the human brain and used in diverse applications. From input to output prediction, it learns the non-linear approximation functions between input and output layers. There are many layers among them, which are called hidden layers. These layers are stacked in a hierarchical manner, which endows characteristics to learn or extract non-linear relationships from high-dimensional EC data with little guidance.
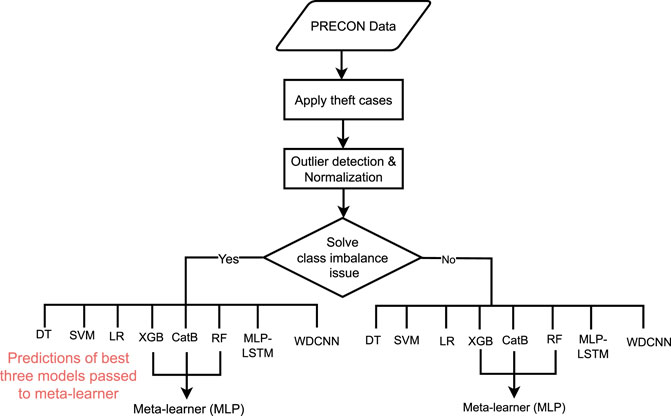
FIGURE 4. Flowchart of the proposed framework.
The architecture of the MLP is shown in Figure 1, where the leftmost layer is the input layer and the rightmost one is the output layer with one neuron. The middle layers are known as hidden layers that are made up of neurons, activation functions, and dropout layers, which are used to establish mapping between input and output layers, control overfitting issues, and help generate accurate results. To classify the samples, an objective function is defined that measures the error between actual scores and predicted scores. In addition, the MLP model modifies the hyperparameters to adjust the weights and biases of hidden layers and utilizes optimizers, especially stochastic gradient descent (SGD), to reduce the objective function error. However, in this study, the Adam optimizer is adopted to tune the weights and biases of middle layers because it adopts the characteristics of both SGD and RMSprop (Khozeimeh et al., 2022; Kingma and Ba, 2014). Additionally, it leverages the concepts of moving the average to update the hyperparameters.
Furthermore, each layer consists of multiple neurons, which have activation functions, which are a key part of the MLP. In literature, multiple activation functions are studied to enhance the performance of DL models like tanh, sigmoid, and softmax; however, recent work shows that rectified linear unit (ReLU) outperforms other ones and prevents the model from falling into vanishing and exploding gradient problems. The experimental results show that ReLU performs better at hidden layers, while softmax and sigmoid give good results at the output layer. More details about the MLP can be found at Xiao et al. (2018), where the authors use it for binary classification in the medical domain.
Due to the large size of the PRECON dataset, all preprocessing and model-building steps are performed in Google Colaboratory and Kaggle platforms by taking the power of distributed computing. The DL models are built-in TensorFlow, while ML models are deployed with the help of the Scikit-learn library. Data preprocessing and exploration steps are performed using NumPy, Pandas, Matplotlib, and Scikit-learn libraries.
To evaluate the performance of the proposed framework, the PRECON dataset is reduced into training data, validation data, and testing data. Training and validation parts are exploited to tune the hyperparameters, while the testing part is exploited to check the ML models’ performance. In the literature, it is seen that the error obtained on the validation part is reported as the final error (Krstajic et al., 2014). This procedure leads to a poor generalization in which the ML models suffer from overfitting problems (Buzau et al., 2018; Varma and Simon, 2006).
One of the most commonly used metrics for evaluating the performance of ML/DL models is accuracy. However, it does not give a real assessment of their prediction capability. A naïve classifier would achieve 90% accuracy on imbalanced data because it becomes biased toward majority class samples. The literature work shows that ROC-AUC has proved to be an excellent performance measure for imbalanced datasets. It is a ratio between the TPR and FPR, the value of which can be changed by varying decision thresholds on the curve. However, this metric is only focused on positive class samples and ignores negative ones. In the real-world scenario, both classes have equal importance, which is why the PR curve and F1-score are also considered. Moreover, electric utilities have a low budget for onsite inspections. So, the FPR is also taken into consideration because it tells how many positive samples are misclassified by the predictor.
In this section, we compare the performance of the proposed meta-learner strategy with baseline models and existing state-of-the-art models in the smart grid domain.
Comparison with the state-of-the-art models: the performance of the proposed meta-learner strategy is compared with the WD-CNN (Zheng et al., 2017) and MLP-LSTM (Buzau et al., 2019) models. Both models were recently published in top-tier journals. The WD-CNN model is developed to classify the normal and malicious samples in electricity consumption. The model contains MLP and CNN layers. The MLP layers are utilized to capture global knowledge, while CNN layers are considered to retrieve temporal patterns from data. In the MLP-LSTM model, the authors developed a hybrid algorithm, which leverages the advantages of MLP and LSTM layers. The EC data are fed into the LSTM model to capture periodic patterns, while the metadata of the smart meter is passed into MLP models to learn local features. In this article, the authors conducted extensive experiments and proved that the hybrid model gives better results than simple models. In addition, in this study, the manual procedure is considered to tune the hyperparameters of WD-CNN and MLP-LSTM models.
In case study 1, the six ML classifiers, XGB, CatB, RF, DT, LR, and SVM, are introduced. These classifiers are trained on the PRECON dataset that is provided by the Energy Informatics group in Pakistan. After this, the meta-ensemble learning strategy is proposed for integrating the predictions of base models into the MLP model. This process significantly reduces the number of features, which overcomes the overfitting issue and provides better data for accurate predictions. As shown in Figure 5A, EC data are directly fed into the MLP model, where it can be observed that the model faces the overfitting issue and gives a high loss value on the testing data as compared to the training data. Now, training data are prepared from predictions of base models and fed as input into the MLP model. The process reduces the dimensionality of data and overcomes the overfitting issue, which can be seen in Figure 5B. In the first case, data have an imbalanced nature, which is why models give biased results and are attracted toward the majority class and ignore the minority class. So, the ROC curve is employed to evaluate the true effectiveness of all implemented models. The meta-ensemble strategy achieves a 0.919 ROC-AUC value that is more than its counterparts, which is shown in Figure 6A. Although it is a good performance indicator, it focuses only on positive class samples and ignores the negative ones. So, the PR curve is taken into consideration because it gives equal weightage to both samples. The meta-learner strategy obtains 0.987 PR-AUC values. It is more than its base models or counterparts, which can be viewed in Figure 6B. Other important performance metrics are also considered, such as accuracy, precision, recall, F1-score, and FPR. The models attain different values on base and meta-ensemble strategy, which indicates that each base model has different skills on the trained data. So, this is an ideal situation, where stacking strategies achieve optimal results. In addition, the performance of the proposed meta-learner strategy is compared with that of existing state-of-the-art models: MLP-LSTM and WDCNN. In Table 2, it can be seen that the proposed meta-learner strategy gives better results than both models.
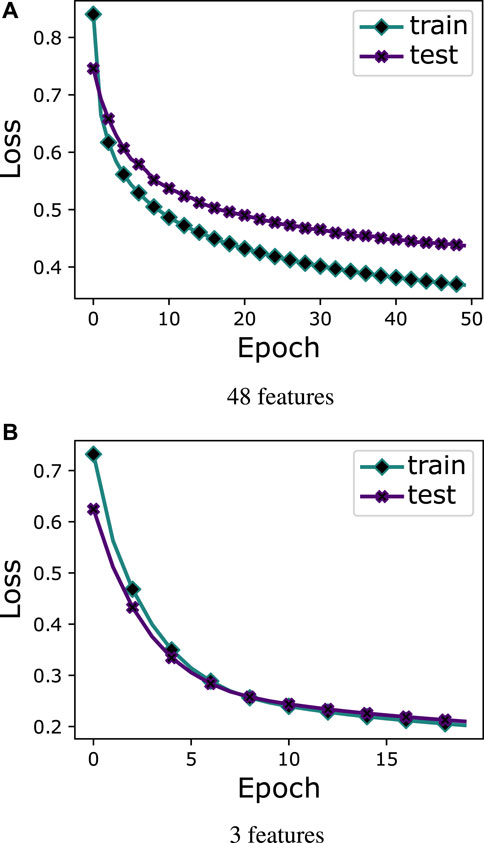
FIGURE 5. Performance analysis with imbalanced data. (A) 48 features, (B) 3 features.
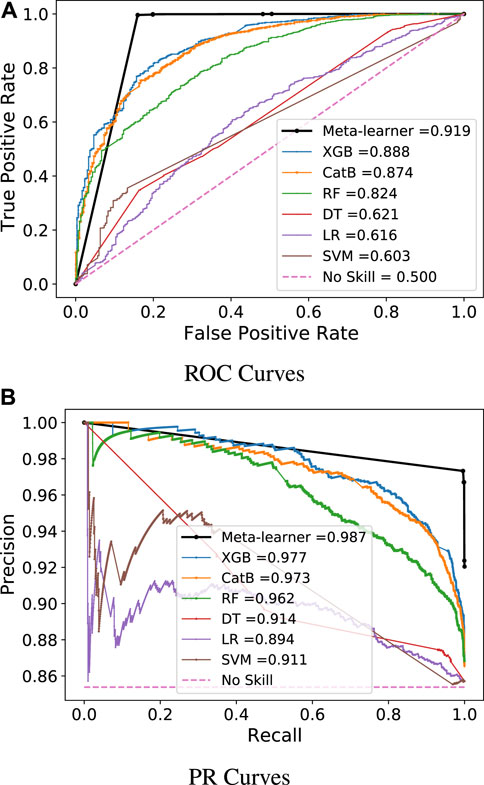
FIGURE 6. Performance analysis with imbalanced data. (A) ROC Curves, (B) PR Curves.
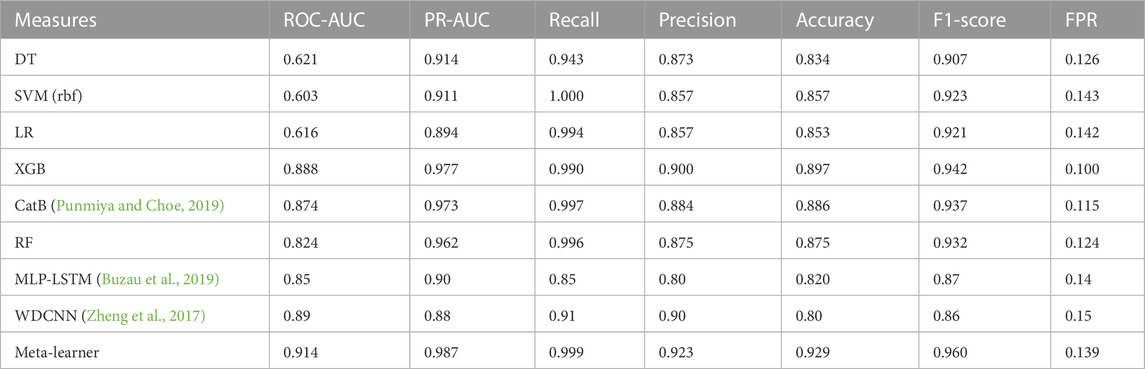
TABLE 2. Performance analysis of the meta-learner with imbalanced data.
In case study 2, the class imbalance problem is solved using AST because ML/DL models give biased results on imbalanced datasets, where they tend toward majority class samples and ignore the minority ones. Balanced data with all features and prediction of base models (fold-0 learners) are fed into the MLP. As shown in Figure 7A, it can be observed that MLP suffers from the overfitting problem with all 48 features. Figure 7B proves that MLP gives good results with the ensemble strategy and does not suffer from overfitting problems, which indicates that ensemble strategies are a good option for real-world applications.
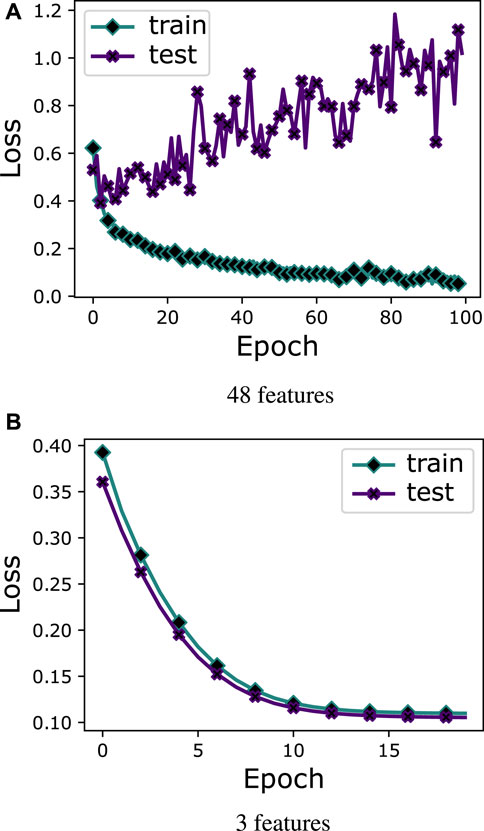
FIGURE 7. Performance analysis with balanced data. (A) 48 features, (B) 3 features.
As shown in Figure 8A, the performance of base models and meta-learner ensemble strategy on balanced data is evaluated through PR curves, which indicate that the meta-learner performs better as compared to base models. Moreover, the DT, LR, and SVM achieve 0.507, 0.481, and 0.486 ROC-AUC on balanced data, respectively, which are low as compared to values that they attain on imbalanced data. DT is a fundamental classifier. However, its performance decreased as the number of samples increased. It also suffered from overfitting problems. LR is a one-layer neural network, which is unable to learn optimal patterns from complex data like EC data, while the SVM does not give good performance on noisy datasets. Due to the aforementioned reasons, these three base models do not give good performance even after solving the class imbalance problem. Furthermore, boosting and bagging models perform well on both balanced and imbalanced data. RF attains 0.856, while XGB and CatB achieve 0.896 and 0.901 ROC-AUC values on balanced data, respectively. RF is a bagging strategy classifier, which gives good results on large datasets. However, it is computationally expensive because it requires high resources to train multiple DTs. XGB and CatB are boosting classifiers whose performance will be improved with an increasing number of learners. The deep learning-based meta-learner strategy achieves a value of 0.910 ROC-AUC, which is more than the ROC-AUC values of all base models. The PR curves of all classifiers are shown in Figure 8B, which indicates that the meta-learner ensemble strategy achieves a 0.988 PR-AUC value, which is more than that of all base models. As is indicated in the literature, the FPR is an important performance measure for electric utilities because its high value directly relates to onsite inspection costs. The proposed strategy achieves a 0.014 FPR value, which is lower than that of all base models. So, this strategy has good efficacy for real-world applications in the smart grid domain because it reduces onsite inspection costs for electric utilities by generating fewer false alarms. Finally, the performance of the meta-learner strategy is compared with that of two deep learning models, which were recently published in top-tier journals, and several other studies used them as baseline models. Both baseline models are trained on the balanced dataset. In Table 3, it can be seen that the proposed meta-learner strategy gives better results than both models and also achieves a lower FPR value. However, the performance of deep learning models largely depends on the selection of hyperparameter ranges. Due to the limited availability of computational resources, the hyperparameters are manually tuned, which may be another valid reason for the lower performance of WD-CNN and MLP-LSTM models. Table 3 shows the f1-score, accuracy, precision, and recall values of all baseline models and the proposed ensemble strategy on balanced data.
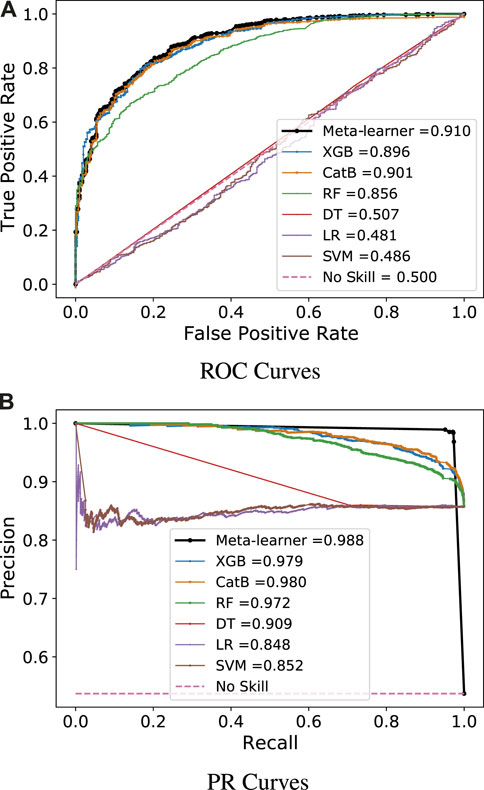
FIGURE 8. Performance analysis with balanced data. (A) ROC Curves, (B) PR Curves.
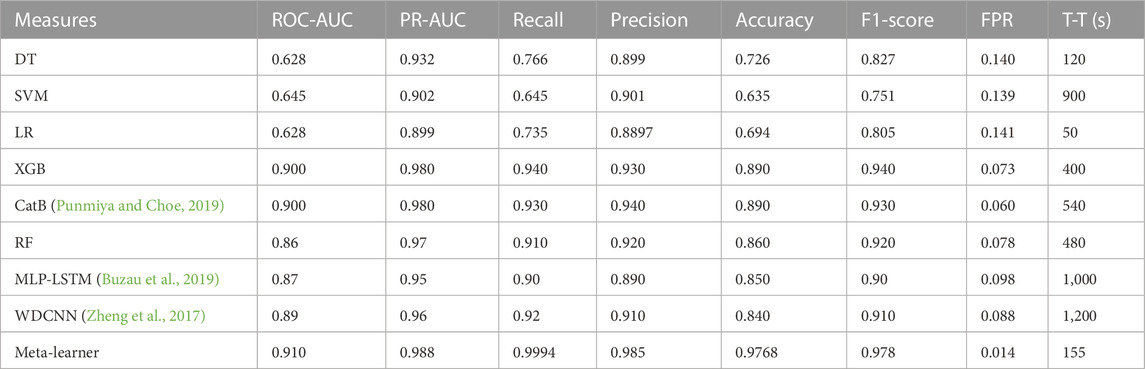
TABLE 3. Performance analysis of the meta-learner with balanced data.
Scalability: here, we measure the running time of each ML and DL model for the selected dataset, which is mentioned in Table 3. The running time is measured for a single train–test split where it can be seen that, as usual, the running time of the DL models is more than that of the ML models. However, the running time of the proposed meta-learner strategy is less than that of baselines and other compared algorithms because the proposed strategy takes the output of the best three models as input to differentiate between normal and abnormal samples, while other models are trained on a PRECON dataset with 48 features.
Based on the aforementioned results, it is concluded that the proposed DL-based meta-learner approach yields satisfactory results and outperforms all individual models, including bagging and boosting approaches, for the detection of NTLs. Electricity theft is a primary reason for NTLs. The accurate prediction of these losses will not only reduce electricity theft cases but also provide direct benefits to electric utilities and consumers.
In this article, the comparison is conducted between the meta-learner ensemble approach that is developed in this study and the traditional six ML classifiers. These traditional classifiers are advanced ones and are mostly used for ETD in the literature. In Punmiya and Choe (2019); Jokar et al. (2015), the authors employ CatB, XGB, LightBoost, and SVM to differentiate between benign and normal samples. All these classifiers give different results on the same dataset. So, we believe that the same type of situation can be seen in other datasets. This is the main motivation to develop an ensemble model that integrates the advantages of all classifiers, ignores their shortcomings, and gives accurate and unbiased classification results. That is why the meta-learner ensemble approach is proposed, which gives a superior performance as compared to standalone classifiers. In addition, results in the literature indicate that single classifiers give an unstable performance on diverse datasets due to different data distributions, sample sizes, and redundant features (Xiao et al., 2018). By going deeper into the output of conventional ML classifiers, the proposed ensemble strategy gives more weightage to classifiers with high accuracy and ignores those with lower ones. So, in this way, the meta-learner strategy fully utilizes the advantages of standalone models and gives better results with a high accuracy rate.
Moreover, the performance of the proposed meta-learner ensemble strategy is compared with that of the majority voting classifier, which has applications in diverse fields and has achieved tremendous results. In Li S. et al. (2019), the authors utilize an advanced version of the majority voting classifier to differentiate between normal and theft samples. Furthermore, it is observed that the DL-based meta-learner approach gives superior values of performance indicators than the majority voting algorithm, which is also proved in Xiao et al. (2018). The results can be formulated as the majority voting algorithm gives equal weightage to each classifier and establishes the linear relationship among them. In addition, in the proposed strategy, MLP is utilized on fold-1, which gives different weightage to each participating classifier on its prediction ability and automatically learns hidden intricate structures, including non-linear relationships. Furthermore, MLP is a DL model, which has complex non-linear functions like hyperbolic tangent, sigmoid, and rectified linear unit. These functions have the ability to learn non-linear relationships among predictions of fold-0 classifiers and class labels.
Furthermore, false alarms are a limiting factor that reduces the efficacy of an ETD system. Once a false alarm is generated, an on-site inspection is performed for its final verification. However, electric utilities have a limited budget for this purpose. So, in real-world applications, a classifier which has a low FPR is preferred (Jokar et al., 2015). The proposed meta-learner strategy achieves a low FPR on both balanced and imbalanced datasets as compared to bagging, boosting, and individual classifiers that are shown in Tables 2, 3.
In this article, the DL-based meta-learner model is proposed for the detection of non-technical losses. According to the reviewed literature, this is the first model in the smart grid domain that utilizes the diverse knowledge of multiple classifiers and automatically learns hidden intricate features, including non-linear relationships, among them. It controls the overfitting issue, gives high accuracy, and surpasses state-of-the-art methods, including bagging and boosting classifiers. Moreover, the proposed model is evaluated on a real EC dataset, which is provided by PRECON, the largest energy informatics group in Pakistan. Furthermore, class imbalance is a severe issue in ETD, which affects ML/DL models’ performance. So, a hybrid sampling approach is developed to handle the class imbalance problem. The meta-learner model achieves 0.914, 0.987, 0.999, 0.923, 0.929, 0.960, and 0.139 ROC-AUC, PR-AUC, recall, precision, accuracy, F1-score, and FPR values on imbalanced data, while it attains 0.910, 0.988, 0.9994, 0.985, 0.9768, 0.978, and 0.014 ROC-AUC, PR-AUC, recall, precision, accuracy, F1-score, and FPR values on balanced data, respectively. In both cases, the proposed model outperforms other baseline models, which indicates that the meta-learner is a good option for the classification of malicious and normal samples. In the future, we will evaluate the performance of the proposed model in other domains.
The original contributions presented in the study are included in the article/Supplementary Material, further inquiries can be directed to the corresponding author. The PRECON dataset is publicly available for research purposes, which can be downloaded from this link (https://web.lums.edu.pk/∼eig/precon.html).
Conceptualization: FS, SA, ZU, KA, and MA. Resources: ZU, KA, and MA. Methodology and implementation: ZU, KA, SA, and MA. Paper writing, editing: FS, SA, and ZU. Review, revise: SA, ZU, KA, and MA. Funding: KA and MA. Supervision: SA and KA.
This Research is funded by Research Supporting Project Number (RSPD2023R553), King Saud University, Riyadh, Saudi Arabia.
The authors declare that the research was conducted in the absence of any commercial or financial relationships that could be construed as a potential conflict of interest.
All claims expressed in this article are solely those of the authors and do not necessarily represent those of their affiliated organizations, or those of the publisher, the editors, and the reviewers. Any product that may be evaluated in this article, or claim that may be made by its manufacturer, is not guaranteed or endorsed by the publisher.
1Pakistan Residential Electricity Consumption Dataset.
Ahir, R. K., and Chakraborty, B. (2022). Pattern-based and context-aware electricity theft detection in smart grid. Sustain. Energy, Grids Netw. 32, 100833. doi:10.1016/j.segan.2022.100833
Ahmed, S., Lee, Y., Hyun, S.-H., and Koo, I. (2019). Unsupervised machine learning-based detection of covert data integrity assault in smart grid networks utilizing isolation forest. IEEE Trans. Inf. Forensics Secur. 14, 2765–2777. doi:10.1109/tifs.2019.2902822
Aryanezhad, M. (2019). A novel approach to detection and prevention of electricity pilferage over power distribution network. Int. J. Electr. Power Energy Syst. 111, 191–200. doi:10.1016/j.ijepes.2019.04.005
Aslam, S., Herodotou, H., Mohsin, S. M., Javaid, N., Ashraf, N., and Aslam, S. (2021). A survey on deep learning methods for power load and renewable energy forecasting in smart microgrids. Renew. Sustain. Energy Rev. 144, 110992. doi:10.1016/j.rser.2021.110992
Batalla-Bejerano, J., Trujillo-Baute, E., and Villa-Arrieta, M. (2020). Smart meters and consumer behaviour: insights from the empirical literature. Energy Policy 144, 111610. doi:10.1016/j.enpol.2020.111610
Batista, G. E., Bazzan, A. L., and Monard, M. C. (2003). “Balancing training data for automated annotation of keywords: A case study,” in II Brazilian Workshop on Bioinformatics, 10–18.
Buzau, M. M., Tejedor-Aguilera, J., Cruz-Romero, P., and Gómez-Expósito, A. (2018). Detection of non-technical losses using smart meter data and supervised learning. IEEE Trans. Smart Grid 10, 2661–2670. doi:10.1109/tsg.2018.2807925
Buzau, M.-M., Tejedor-Aguilera, J., Cruz-Romero, P., and Gómez-Expósito, A. (2019). Hybrid deep neural networks for detection of non-technical losses in electricity smart meters. IEEE Trans. Power Syst. 35, 1254–1263. doi:10.1109/tpwrs.2019.2943115
Chang, Z., Zhang, Y., and Chen, W. (2019). Electricity price prediction based on hybrid model of adam optimized lstm neural network and wavelet transform. Energy 187, 115804. doi:10.1016/j.energy.2019.07.134
Chen, J., Nanehkaran, Y., Chen, W., Liu, Y., and Zhang, D. (2023). Data-driven intelligent method for detection of electricity theft. Int. J. Electr. Power & Energy Syst. 148, 108948. doi:10.1016/j.ijepes.2023.108948
Glauner, P., Meira, J. A., Valtchev, P., State, R., and Bettinger, F. (2016). The challenge of non-technical loss detection using artificial intelligence: A survey. arXiv preprint arXiv:1606.00626.
Gunturi, S. K., and Sarkar, D. (2021). Ensemble machine learning models for the detection of energy theft. Electr. Power Syst. Res. 192, 106904. doi:10.1016/j.epsr.2020.106904
Haq, E. U., Pei, C., Zhang, R., Jianjun, H., and Ahmad, F. (2023). Electricity-theft detection for smart grid security using smart meter data: A deep-cnn based approach. Energy Rep. 9, 634–643. doi:10.1016/j.egyr.2022.11.072
He, H., Bai, Y., Garcia, E. A., and Li, S. (2008). “Adasyn: adaptive synthetic sampling approach for imbalanced learning,” in 2008 IEEE international joint conference on neural networks (IEEE world congress on computational intelligence) (Ieee), 1322–1328.
Huang, Y., and Xu, Q. (2021). Electricity theft detection based on stacked sparse denoising autoencoder. Int. J. Electr. Power & Energy Syst. 125, 106448. doi:10.1016/j.ijepes.2020.106448
Ibrahim, N., Al-Janabi, S., and Al-Khateeb, B. (2021). Electricity-theft detection in smart grids based on deep learning. Bull. Electr. Eng. Inf. 10, 2285–2292. doi:10.11591/eei.v10i4.2875
Jiang, H., Wang, K., Wang, Y., Gao, M., and Zhang, Y. (2016). Energy big data: A survey. IEEE Access 4, 3844–3861. doi:10.1109/access.2016.2580581
Jiang, Z., Pan, T., Zhang, C., and Yang, J. (2021). A new oversampling method based on the classification contribution degree. Symmetry 13, 194. doi:10.3390/sym13020194
Jokar, P., Arianpoo, N., and Leung, V. C. (2015). Electricity theft detection in ami using customers’ consumption patterns. IEEE Trans. Smart Grid 7, 216–226. doi:10.1109/tsg.2015.2425222
Khan, I. U., Javeid, N., Taylor, C. J., Gamage, K. A., and Ma, X. (2021). A stacked machine and deep learning-based approach for analysing electricity theft in smart grids. IEEE Trans. Smart Grid 13, 1633–1644. doi:10.1109/tsg.2021.3134018
Khattak, A., Bukhsh, R., Aslam, S., Yafoz, A., Alghushairy, O., and Alsini, R. (2022). A hybrid deep learning-based model for detection of electricity losses using big data in power systems. Sustainability 14, 13627. doi:10.3390/su142013627
Khozeimeh, F., Sharifrazi, D., Izadi, N. H., Joloudari, J. H., Shoeibi, A., Alizadehsani, R., et al. (2022). Rf-cnn-f: random forest with convolutional neural network features for coronary artery disease diagnosis based on cardiac magnetic resonance. Sci. Rep. 12, 11178–11212. doi:10.1038/s41598-022-15374-5
Kingma, D. P., and Ba, J. (2014). Adam: A method for stochastic optimization. arXiv preprint arXiv:1412.6980.
Kong, X., Zhao, X., Liu, C., Li, Q., Dong, D., and Li, Y. (2021). Electricity theft detection in low-voltage stations based on similarity measure and dt-ksvm. Int. J. Electr. Power & Energy Syst. 125, 106544. doi:10.1016/j.ijepes.2020.106544
Krstajic, D., Buturovic, L. J., Leahy, D. E., and Thomas, S. (2014). Cross-validation pitfalls when selecting and assessing regression and classification models. J. cheminformatics 6, 10–15. doi:10.1186/1758-2946-6-10
Langendahl, P.-A., Roby, H., Potter, S., and Cook, M. (2019). Smoothing peaks and troughs: intermediary practices to promote demand side response in smart grids. Energy Res. Soc. Sci. 58, 101277. doi:10.1016/j.erss.2019.101277
Lemaître, G., Nogueira, F., and Aridas, C. K. (2017). Imbalanced-learn: A python toolbox to tackle the curse of imbalanced datasets in machine learning. J. Mach. Learn. Res. 18, 1–5.
León, C., Biscarri, F., Monedero, I., Guerrero, J. I., Biscarri, J., and Millán, R. (2011). Variability and trend-based generalized rule induction model to ntl detection in power companies. IEEE Trans. Power Syst. 26, 1798–1807. doi:10.1109/tpwrs.2011.2121350
Li, S., Han, Y., Yao, X., Yingchen, S., Wang, J., and Zhao, Q. (2019a). Electricity theft detection in power grids with deep learning and random forests. J. Electr. Comput. Eng. 2019, 1–12. doi:10.1155/2019/4136874
Li, W., Logenthiran, T., Phan, V.-T., and Woo, W. L. (2019b). A novel smart energy theft system (sets) for iot-based smart home. IEEE Internet Things J. 6, 5531–5539. doi:10.1109/jiot.2019.2903281
McLaughlin, S., Holbert, B., Fawaz, A., Berthier, R., and Zonouz, S. (2013). A multi-sensor energy theft detection framework for advanced metering infrastructures. IEEE J. Sel. Areas Commun. 31, 1319–1330. doi:10.1109/jsac.2013.130714
Nabil, M., Ismail, M., Mahmoud, M., Shahin, M., Qaraqe, K., and Serpedin, E. (2019). “Deep learning-based detection of electricity theft cyber-attacks in smart grid ami networks,” in Deep learning applications for cyber security (Springer), 73–102.
Nadeem, A., Arshad, N., Ahmad, S. F., Ibrahim, K. E., Alotaibi, M. R., Siddiqui, N., et al. (2019). Precon: pakistan residential electricity consumption dataset. Proc. Tenth ACM Int. Conf. Future Energy Syst. 304, 52–60. doi:10.1016/j.cbi.2019.03.001
Olasehinde, O. O., Johnson, O. V., and Olayemi, O. C. (2020). “Evaluation of selected meta learning algorithms for the prediction improvement of network intrusion detection system,” in 2020 International Conference in Mathematics, Computer Engineering and Computer Science (ICMCECS) (IEEE), 1–7.
Peng, L., Liu, S., Liu, R., and Wang, L. (2018). Effective long short-term memory with differential evolution algorithm for electricity price prediction. Energy 162, 1301–1314. doi:10.1016/j.energy.2018.05.052
Punmiya, R., and Choe, S. (2019). Energy theft detection using gradient boosting theft detector with feature engineering-based preprocessing. IEEE Trans. Smart Grid 10, 2326–2329. doi:10.1109/tsg.2019.2892595
Qiao, W., and Yang, Z. (2020). Forecast the electricity price of us using a wavelet transform-based hybrid model. Energy 193, 116704. doi:10.1016/j.energy.2019.116704
Qin, H., Zhou, H., and Cao, J. (2020). Imbalanced learning algorithm based intelligent abnormal electricity consumption detection. Neurocomputing 402, 112–123. doi:10.1016/j.neucom.2020.03.085
Ramos, C. C., Rodrigues, D., de Souza, A. N., and Papa, J. P. (2016). On the study of commercial losses in Brazil: A binary black hole algorithm for theft characterization. IEEE Trans. Smart Grid 9, 676–683. doi:10.1109/tsg.2016.2560801
Saraiva, F. d. O., Bernardes, W. M., and Asada, E. N. (2015). A framework for classification of non-linear loads in smart grids using artificial neural networks and multi-agent systems. Neurocomputing 170, 328–338. doi:10.1016/j.neucom.2015.02.090
Shehzad, F., Javaid, N., Aslam, S., and Javaid, M. U. (2022). Electricity theft detection using big data and genetic algorithm in electric power systems. Electr. Power Syst. Res. 209, 107975. doi:10.1016/j.epsr.2022.107975
Takiddin, A., Ismail, M., Zafar, U., and Serpedin, E. (2020). Robust electricity theft detection against data poisoning attacks in smart grids. IEEE Trans. Smart Grid 12, 2675–2684. doi:10.1109/tsg.2020.3047864
Varma, S., and Simon, R. (2006). Bias in error estimation when using cross-validation for model selection. BMC Bioinforma. 7, 91–98. doi:10.1186/1471-2105-7-91
Xiao, Y., Wu, J., Lin, Z., and Zhao, X. (2018). A deep learning-based multi-model ensemble method for cancer prediction. Comput. methods programs Biomed. 153, 1–9. doi:10.1016/j.cmpb.2017.09.005
Zheng, Z., Yang, Y., Niu, X., Dai, H.-N., and Zhou, Y. (2017). Wide and deep convolutional neural networks for electricity-theft detection to secure smart grids. IEEE Trans. Industrial Inf. 14, 1606–1615. doi:10.1109/tii.2017.2785963
Keywords: power system, advanced metering infrastructure, deep learning, metaheuristics, smart grids
Citation: Shehzad F, Ullah Z, Alhussein M, Aurangzeb K and Aslam S (2023) Deep learning-based meta-learner strategy for electricity theft detection. Front. Energy Res. 11:1232930. doi: 10.3389/fenrg.2023.1232930
Received: 01 June 2023; Accepted: 31 August 2023;
Published: 27 September 2023.
Edited by:
Muhammad Babar Rasheed, University of Alcalá, SpainReviewed by:
Shameem Ahmad, American International University-Bangladesh, BangladeshCopyright © 2023 Shehzad, Ullah, Alhussein, Aurangzeb and Aslam. This is an open-access article distributed under the terms of the Creative Commons Attribution License (CC BY). The use, distribution or reproduction in other forums is permitted, provided the original author(s) and the copyright owner(s) are credited and that the original publication in this journal is cited, in accordance with accepted academic practice. No use, distribution or reproduction is permitted which does not comply with these terms.
*Correspondence: Zahid Ullah, emFoaWQudWxsYWhAcG9saW1pLml0
Disclaimer: All claims expressed in this article are solely those of the authors and do not necessarily represent those of their affiliated organizations, or those of the publisher, the editors and the reviewers. Any product that may be evaluated in this article or claim that may be made by its manufacturer is not guaranteed or endorsed by the publisher.
Research integrity at Frontiers
Learn more about the work of our research integrity team to safeguard the quality of each article we publish.