 Wei Wang1,2
 Jun Liu
94% of researchers rate our articles as excellent or good
Learn more about the work of our research integrity team to safeguard the quality of each article we publish.
Find out more
ORIGINAL RESEARCH article
Front. Energy Res. , 14 July 2023
Sec. Advanced Clean Fuel Technologies
Volume 11 - 2023 | https://doi.org/10.3389/fenrg.2023.1231958
This article is part of the Research Topic Advances in Geomechanics Research and Application for Deep Unconventional Reservoirs View all 35 articles
As the burial depth of shale exploitation increases, it is challenge to form fracture networks through hydraulic fracturing technology. When cryogenic fluid contacts with hot rock, heat exchange process occurs and temperature gradient is generated at the rock surface, resulting in thermal stress. Once the thermal stress exceeds the tensile strength, the fractures are generated. To study the initiation and propagation of fractures induced by thermal shock, a thermal-mechanical (TM) coupled two-dimensional model is developed in the paper. To simulate the heat exchange process, the heat convective boundary is applied in the surface between the fluid and the rock. In addition, the initiation and propagation of fractures are described by the cohesive zone model. The accuracy and reliability of the numerical model is validated by an existing analytical solution. Under the thermal shock, the temperature at the contact surface drops quickly. The stress distribution is determined by the temperature variation. The variations of temperature and stress are greatly affected by the heat exchange coefficient. With the fractures embedded in the model, the initiation and propagation of fractures are analysed. The multi-fracture propagation induced by thermal shock exhibits competition effect. With the propagation of fractures, the stress distribution in the rock changes. The heat exchange coefficient has a significant effect on fracture initiation and propagation, presenting more fractures generation in the larger coefficient.
Shale gas is a type of clean and efficient energy resource. Through long-term research and engineering practice, the development technology of shale gas in middle-shallow layer (<3,500 m) is relatively mature. With the deepening of the exploration, the deep shale gas (with the buried depth of over 3,500 m) is a highly promising resource, which takes over 65% of the whole shale gas reserve in China. Currently, the development of deep shale gas has made preliminary technical progress, but many challenges are reported in field, especially in the hydraulic fracturing as the key technique of shale gas efficiency development (Zhao et al., 2022).
Compared with shale gas in middle-shallow layer, the formation temperature and overburden pressure of deep shale increase, as well as the formation closure pressure, crustal stress difference, elastic modulus, failure strength and other mechanical parameters also increase in varying degrees (Guo et al., 2021). The reservoir characteristics listed above bring disadvantages to the hydraulic fracturing of deep shale gas, such as: (1) plasticity of shale is enhanced, which makes the fractures difficult to initiate and propagate; (2) it is challenge to improve the complexity of fractures and the volume of reservoir reconstruction; (3) the transportation of the proppant becomes difficult due to the narrow fracture width. At present, it is more realistic to form micro fractures with main fractures and relatively small extension ranges in deep shale hydraulic fracturing (Chang et al., 2022). It can be concluded that it is of great challenge to obtain an ideal fracturing region in deep shale reservoirs.
In addition to bearing external loads, rocks can also withstand thermal stress caused by internal temperature changes. Thermal crack is also an important factor in rock failure. Numerical simulation researches show that larger injecting fluid can effectively reduce the bottom hole temperature, with a maximum temperature drop of 80°C (well depth of 4,000 m) (Zhang et al., 2019). Field experiments and physical simulation experiments of enhanced geothermal extraction also indicate that reservoir permeability is improved by injecting cryogenic fluid into hot dry rocks (Garcia et al., 2015), (Rutqvist et al., 2015). Based on the above research conclusions, some researchers propose a type of fracturing method, namely, cryogenic fracturing technology (Tomac and Gutierrez., 2017). When cryogenic fluid is injected into a high-temperature formation, the temperature causes rock shrinkage and generate tensile stress. As the tensile stress is greater than the critical stress, fractures are generated in the rock (Enayatpour et al., 2018a). In addition, the cooling effect of cryogenic fluid can also effectively reduce the crustal stress and the critical value of fracture initiation or propagation, which is conducive to form a larger range of fracture network (Enayatpour et al., 2018b). Hence, a series of research on the cryogenic fracturing are conducted. For example, according to the experimental results, multiple cryogenic shocks could generate new fractures, increase the width of existing fractures, and rock characteristics would affect the generation of fractures (Cha et al., 2017; Wang et al., 2016; Enayatpour et al., 2018a; Enayatpour et al., 2018b) established a hydraulic fracturing model for shale reservoir under thermal shock (sharp thermal gradient). They analyzed the mechanism and effect of cryogenic fracturing, as well as the impact of rock thermophysical parameters and mechanical parameters. Based on the plane strain model for the initiation/propagation of secondary fractures, (Tran et al., 2012) discussed the effect of initial effective stress, elastic modulus, filtration loss, and temperature difference on the propagation of secondary fractures during cryogenic fracturing. (Bahr et al., 2010) found that the spacing between thermal shock fractures was proportional to the fracture length and inversely proportional to the propagation speed. Kim and Kemeny (Kim and Kemeny, 2009) analysed the effect of rapid cooling and unloading on rock damage by slowing heating and rapid cooling tests. (Dahi et al., 2014) investigated the effect of temperature on preexisting fractures and newly initiated fractures in the process of hydraulic fracturing. Generally, thermal shock has been recognized as an important type of fracturing.
Recently, liquid nitrogen (LN2) or liquid carbon dioxide (LCO2) is considered as fracturing fluid because of the strong thermal shock process. Many researches on the cryogenic fracturing are focused on LN2 or LCO2. (Cha et al., 2014) investigated the feasibility of fracture stimulation by using cryogenic fluids to create a strong thermal gradient surrounding a borehole. The experimental results showed that the material properties played a key role in the generation of fractures. (Han et al., 2020) found that after the immersion of cryogenic fluid nitrogen, shale rock exhibited obvious brittleness failure characteristics. In addition, (Wang et al., 2016; Qin et al., 2018; Zhang et al., 2016) and (Yang et al., 2019) conducted tri-axial fracturing experiments and the experimental phenomena indicated that larger complex fracture network can be obtained by cryogenic LN2 fracturing. (Cai et al., 2014) analysed the properties of sandstone, marble and shale after liquid nitrogen cooling. (Yao et al., 2017) developed a numerical model to identify the influence of different confining stress, injection pressure and failure criteria on the cryogenic fracturing.
Numerical method is a feasible method to study the cryogenic fracturing technology. Generally, cryogenic fracturing involves complex physical processes, which includes thermal conduction/convection, rock deformation, fracture initiation/propagation, fluid flow and phase transition. Additionally, the material properties vary with the temperature (Burlayenko et al., 2016), (Trevisan et al., 2016), especially for the heterogeneity (Huang et al., 2019) (Huang et al., 2023). Actually, it is difficult to consider these processes in the numerical model simultaneously. Most researches focus on the thermal shock process (e.g., thermal/mechanical response and the fracturing process), and some factors can be discussed. Unlike conventional hydraulic fracturing, as the low-temperature fluid enters the main fracture, secondary fractures with alternate length on the surface of the main fracture are formed due to thermal shock (Tang et al., 2020; Tang et al., 2016). Understanding the competitive propagation of multiple fractures is very important. It is beneficial to improve the volume and complexity of the fracture network. Unfortunately, rare researches are conducted to study the non-uniform propagation of fractures along rock surface, as well as the influence factors.
This study develops a TM coupled two-dimensional model in ANSYS software. It should be noted that heat convective boundary, rather than the first temperature boundary, is considered in the model. The initiation and propagation of fractures are described by the cohesive zone model. The accuracy and reliability of the numerical model is validated by an existing analytical solution. Thereafter, under the thermal shock, the temperature and stress distribution are discussed in the elastic stage. With the fractures embedded in the model, the initiation and propagation of fractures are analysed, as well as the effect of the heat exchange coefficient. Generally, this work should help to analyse the thermal shock performance to enhance the reservoir stimulation.
As cryogenic fracturing is a complex physical process, some assumptions are made to develop the numerical model (Tran et al., 2012; Tang et al., 2016; Tang et al., 2020).
(1) Only the thermal shock is considered in the model. Herein, the fluid flow in the fracture is ignored.
(2) The properties of rock keep constant with temperature change.
(3) Several fractures are preset in the model to simulate the competitive propagation of multiple fractures. Only the tension failure is considered.
(4) The rock matrix exhibits linear elastic mechanical behavior.
(5) The relationship between heat flux vector and thermal gradients obeys Fourier’s law.
Based on the assumptions expressed above, the governing equations of the thermalelasticity are as follows (Xu., 2016):
where {ε} is the total strain vector; S is the entropy density; {σ} is the stress vector; △T (=T-Tref) is the temperature change; T is the current temperature; Tref is the reference temperature; T0 is the absolute reference temperature; (D) is the elastic stiffness matrix; {α} is the vector of coefficients of thermal expansion; ρ is the density; and Cp is the specific heat at constant stress or pressure.
Using {ε} and △T as independent variables, and replacing the entropy density S in Eq. 2 by heat density Q using the second law of thermodynamics (Q = T0S) for a reversible change, the following equation is obtained:
where {β} is the vector of thermoelastic coefficients; and Cv is the specific heat at constant strain or volume.
The first law of thermodynamics states that thermal energy is conserved. Specializing this to a differential control volume, and the equation is written as (Zhao et al., 2023):
where {L} is the vector operator; {v} is the velocity vector for mass transport of heat; {q} is the heat flux vector; q0 is the heat generation rate per unit volume.
Fourier’s law is used to relate the heat flux vector to the thermal gradients:
where [K] is the conductivity matrix.
Substituting the parameter Q in Eq. 4 into Eq. 7 produces the coupled equation of TH model.
To avoid the stress singularity in the crack tip, the cohesive zone model is adopted to simulate the initiation and propagation of the fracture in the numerical model. The model is realized by interface element. Then, by defining the relationship between normal force and deformation, as well as tangential force and slip deformation, the mechanical behavior of the fracture is simulated. In this study, a bilinear traction-separation law is employed to describe the relationship, and the failure criterion is the maximum principal tensile stress criterion. The constitutive relation of the cohesive zone model is shown in Figure 1 (Tan et al., 2021).
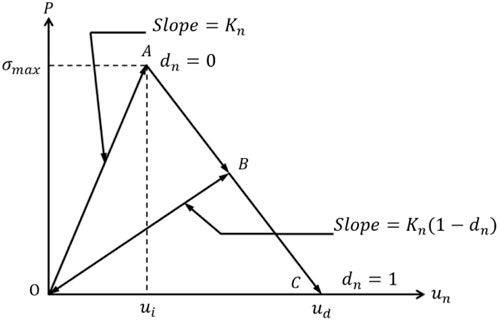
FIGURE 1. Constitutive relation of the cohesive zone model.
In the numerical calculation, the relationship between the tensile stress and the gap between interface elements is described in the following equations:
where P is the tension stress; Kn is the normal stiffness of fracture surface; un is the gap between interface elements; ui is the gap when P reaches to the maximum value; ud is the gap when P is zero; dn is the parameter which is used to describe the softening of material.
For rock, when un < ui, the material is in the elastic stage; when ui ≤ un ≤ ud, damage occurs in the material and the degree is described by dn; when un > ud, macroscopic fracture is occurred in the material and there is no force between interface elements.
To validate the coupled TM model developed in the paper, the analytical solution of thick-walled cylinder under thermal shock is adopted as simulation example. The two-dimensional model is described in Figure 2A. The outer and inner radius of the model are 25 mm and 2.5 mm, respectively. For the thermal boundary condition, the temperature of the external and inner walls is 2°C and 145°C, respectively. For the mechanical boundary condition, the axial stress of the external and inner walls is 0 MPa. In steady state condition, Xu (Xu, 2016) deduced the analytical solutions of the distribution of the temperature (T) and the hoop stress (σθ):
where b is the inner radius; a is the outer radius; Ta is the temperature at the inner wall; Tb is the temperature at the external wall; r represents the distance between any point and the centre of the circle; E is the elastic modulus; μ is the Poisson’s ratio.
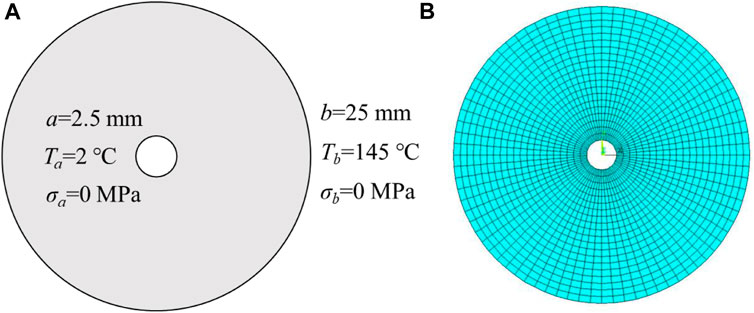
FIGURE 2. Description of the thick-walled cylinder model: (A) geometric modeling with initial boundary conditions; (B) finite element model.
According to the description of the thick-walled cylinder model, the numerical model is developed (Figure 2B), and the relevant parameters are listed in Table 1.
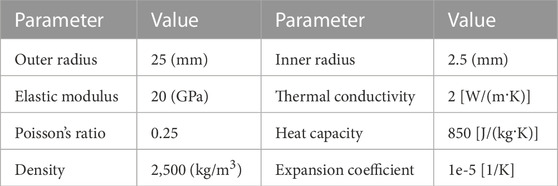
TABLE 1. Parameters of the thick-walled cylinder under thermal shock (Tang et al., 2020; Tang et al., 2016; Zhao et al., 2023).
The comparison between the analytical solution and the numerical results is shown in Figure 3. The results include the temperature and hoop stress at different positions. The results obtained from the numerical model are identical to the analytical solution (Figure 3). As the variable parameter r increases from 2.5 mm to 25 mm, the temperature increases nonlinearly (Figure 4A). The rate of change gradually decreases. For the stress induced by temperature gradient, with the increase of r, the hoop stress changes from tension stress to compress stress (Figure 4B). Consistent with the trend of temperature change, the rate of stress change is first fast and then slow. The maximum tension stress obtained from the analytical solution and the numerical result is 30.2 MPa and 29.4 MPa, respectively. The maximum compress stress obtained from the analytical solution and the numerical result is 7.9 MPa and 8.2 MPa, respectively. The error is less than 4%, which can be ignored. Thus, the accuracy of the coupled TM model is verified.
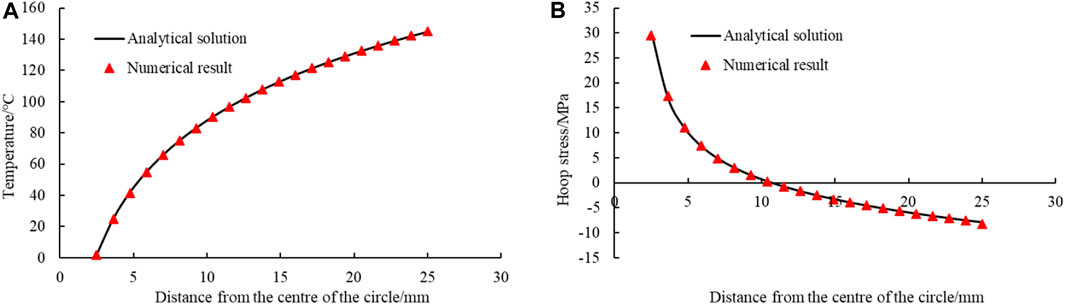
FIGURE 3. Variation in results at different positions: (A) temperature; and (B) hoop stress.
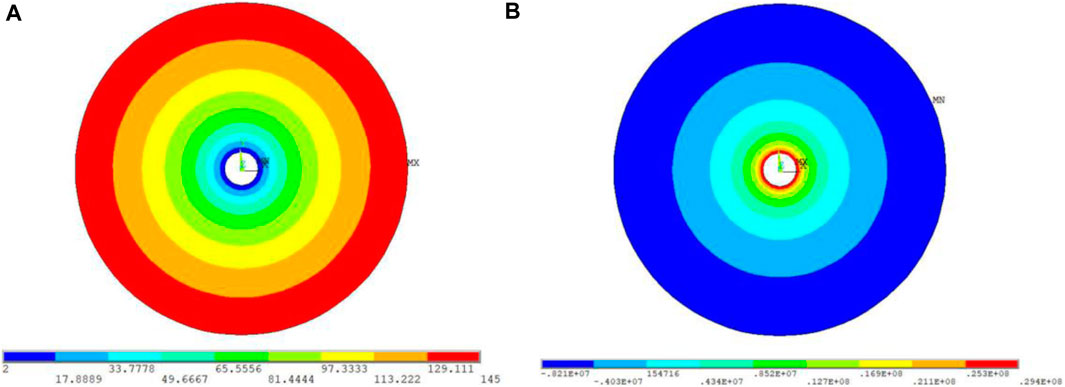
FIGURE 4. Distribution of the physical fields: (A) temperature; and (B) hoop stress.
There are two cases developed in the paper: (1) Case 1: only the elastic behavior is considered. Then, the distribution of stress and temperature is discussed; (2) Case 2: the numerical model consists of matrix system and fracture system. Under thermal shock, the matrix is assumed to behave elastically and rock damage occurs in the fracture system.
For the two cases, a plate with the size of 50 mm × 25 mm is developed. The model is discretized into 20,000 coupled-field quadrilateral elements (Figure 5A). For the second case, to study the competitive propagation of multiple fractures induced by thermal shock, nineteen fractures are embedded in the model. The spacing between two fractures is 2.5 mm (Figure 5B). The fractures are simulated with the cohesive elements and the number of elements is 1900. The relevant physical parameters are listed in Table 2.
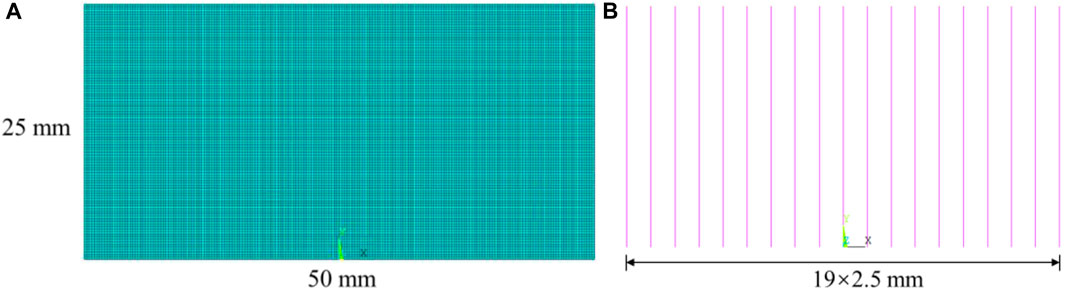
FIGURE 5. Conceptual model of thermal shock: (A) matrix system, and (B) fracture system.
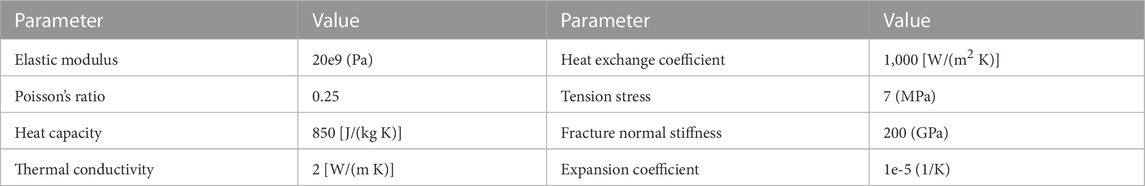
TABLE 2. Physical properties (Tang et al., 2020; Tang et al., 2016; Zhao et al., 2023).
The initial and boundary conditions of the TM model are listed as follows.
(1) Stress field. The bottom of the model is constrained along the y-direction, and the other surfaces are unconstrained.
(2) Temperature field. The initial temperatures of the rock and cryogenic fluid are 200°C and 20°C, respectively. The heat exchange occurs in the upper surface. In most studies, the boundary condition is defined as the first thermal boundary condition. For example, the upper surface is set by assuming that the temperature equals to that of cryogenic fluid, namely, 20°C. However, the definition ignores the process of heat exchange between hot rock and cryogenic fluid. The temperature of the rock surface in contact with cryogenic fluid does not immediately reach to 20°C. It is a heat convective boundary, rather than the first thermal boundary. The efficient of the heat exchange is described by the convective heat transfer coefficient between the fluid and the rock.
To describe the variation of the temperature at different time along the y direction, the nodes located in the middle of the plate (x = 0.025 m) are selected. With the distance from the upper surface increases from 0 m to 0.025 m, the temperature variations are shown in Figure 6. When the hot rock is subjected to thermal shock, it is a transient heat conduction process. The effect of the heat exchange cannot immediately occur in the whole rock. The efficient is determined by the thermal conductivity. Hence, the effect of the heat exchange time is an important factor when the temperature field is analysed. Generally, the temperature variation at different time is similar. As the heat exchange time continues, the temperature inside the rock gradually decreases. As shown in Figure 7, with the contact time between rock surface and cryogenic fluid increases, the temperature at the upper surface drops quickly. For example, when the time increases from 1 s to 50 s, the temperature drops from 133°C to 48°C. In a short period of time (e.g., t = 1 s, 5 s and 10 s), the process of the heat exchange only affects a certain distance from the upper surface, and the temperature of the region far away from the upper surface keeps constant. When the heat exchange time is 50 s, the temperature of larger region has dropped. With the location increases from 0 to 0.025 m, the variation rate of the temperature exhibits a characteristic of first fast and then slow. For the location which is at 0.02 m from the upper surface, the temperature is 195°C and has only dropped by 5°C.
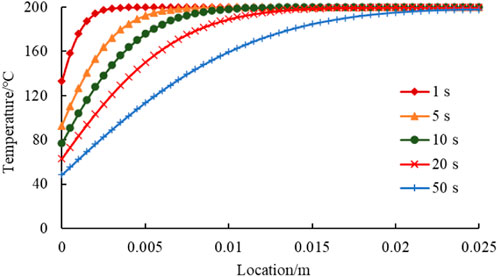
FIGURE 6. Temperature variation in the plate at different time.
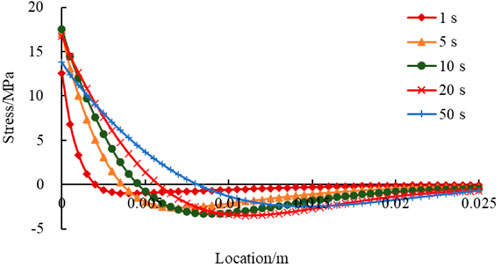
FIGURE 7. Stress variation in the plate at different time.
During the process of heat exchange, the temperature distribution is non-uniform. Then, the temperature stress is induced by the temperature gradient. With the distance from the upper surface increases from 0 m to 0.025 m, the stress (along the x direction) variations are shown in Figure 7. At the thermal shock boundary, the temperature gradient is the highest. Hence, the maximum tensile stress (σt) occurs at the upper surface. When the heat exchange time is 1 s, σt is 12.5 MPa, which is greater than the tensile strength of shale. It can be seen that thermal shock in a short time is enough to generate damage in the rock. Similar with the temperature distribution, the stress occurs in the position which is near the upper surface. As the time of thermal shock increases, tensile stress is generated in a larger area inside the rock. With the location increases from 0 to 0.025 m, the stress quickly decreases, and the stress state transitions from tensile stress to compressive stress. Compare with the tensile area, the range of stress variation in the compressive area is relatively small.
At the upper surface (x = 0.025 m), the variations of temperature with time are shown in.
Figure 8A. After the heat exchange of 50 s, the temperature decreases from 200°C to 50°C. The decline rate shows a trend of first fast and then slow (a) (b).
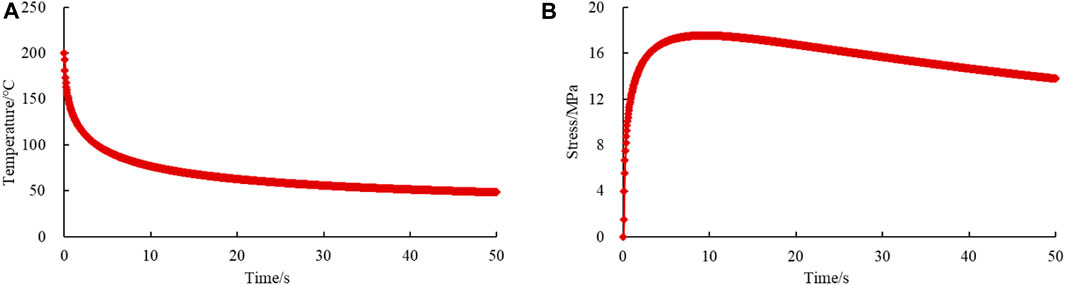
FIGURE 8. Variation of physical parameters with time at the upper surface (x = 0.025 m): (A) temperature; and (B) stress.
Figure 8A). In the first 5 s, the decrease of temperature can be up to 107°C. Over the next 5 s, the decrease of temperature is 16°C. Then, within the remaining 40 s, the temperature dropped by only 27°C. The decrease of temperature mainly occurs at the initial stage. For example, the temperature drop value in the first 5 s accounts for over 70% of the total decrease value. As the heat exchange continues, the temperature decreases slowly and tends to stabilize. According to the simulation results, it takes a time for the temperature at the boundary to decrease to the ambient temperature. More importantly, the efficiency of the thermal shock is determined by the heat exchange coefficient, and this parameter of different fluid varies greatly. Unfortunately, the first thermal boundary condition can not consider the effect of different fluid on the heat exchange. Applying this type of the boundary condition to the heat exchange surface is unreasonable. Otherwise, the effect of temperature stress will be overestimated.
At the upper surface (x = 0.025 m), the variations of stress with time are shown in Figure 8B. The stress variation is greatly determined by the temperature variation. Generally, the stress changes with time can be divided into three stages (a) (b).
Figure 8B firstly, the stress quickly increases to 12.5 MPa within 1 s. It corresponds to the stage of rapid decrease of temperature. Then, the stress slowly increases to the maximum stress, namely, 17.5 MPa, within the next 8.5 s. In the following heat exchange process, the stress decreases slowly. The final tensile stress value is 13 MPa. During the initial stage of thermal shock, the temperature of the heat exchange surface decreases rapidly and the cooling area is limited, which leads to a continuous increase in temperature gradient. Hence, the tensile stress generated at the heat exchange boundary continues to increase. Subsequently, due to the larger cooling area and the slow decrease rate of temperature at the upper surface, the temperature gradient gradually decreased, thereby reducing the tensile stress at the heat exchange boundary. Based on the stress variation with time, it can be concluded that once there is no damage occurred in the rock at the initial stage, there will be no damage in the later stage.
The effect of the heat exchange coefficient on the variations of temperature and stress is shown in Figure 9. The heat exchange coefficient determines the decrease degree of the temperature. For example, when the values of the coefficient are 1000 W/(m−2 K−1) and 100 W/(m−2 K−1), the temperature drop is 150°C and 53°C, respectively. The difference is close to three times. Smaller heat exchange coefficient generates lower temperature gradient (Figure 9A). For the smaller coefficient of 100 W/(m−2 K−1), the stress increases slowly during the whole thermal shock process (Figure 9B). After the thermal shock of 10 s, the stress is only 4 MPa, which is much lower than 18 MPa when the coefficient is 1000 W/(m−2 K−1). Therefore, the heat exchange coefficient is an important parameter when selecting cryogenic fluid in thermal shock design.
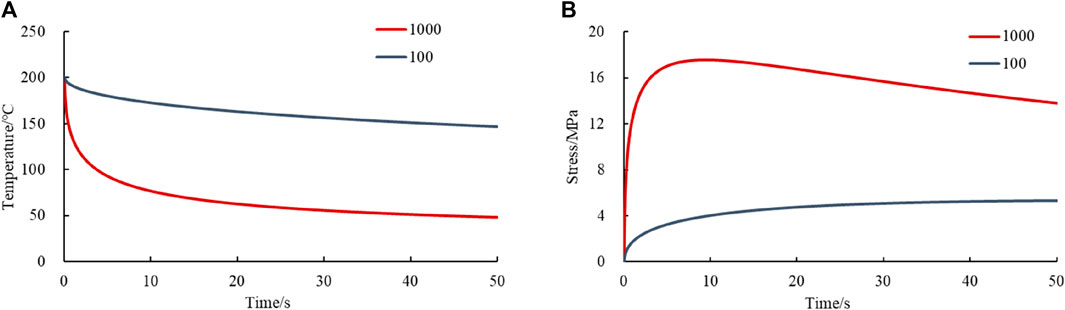
FIGURE 9. Effect of the heat exchange coefficient on the physical parameters at the upper surface (x = 0.025 m): (A) temperature, and (B) stress.
When the tension stress exceeds the tensile strength, the fractures are generated in the rock. As the stress distribution is analysed above, the initiation of the fracture occurs at the upper surface, and the fractures propagate forward as the thermal shock continues. The initiation and propagation of multi-fracture is shown in Figure 10. In the initial stage (t = 0.1 s), the maximum tension stress is 3.7 MPa which is lower than the tension strength (7 MPa). Then, there is no fracture occurred in the upper surface. With thermal shock continues, the tension stress increases. Once the stress is greater than the tension stress, the rock is damaged. When t = 1 s, some fractures are generated and mainly concentrated in the middle area, which is determined by the stress distribution. The length of these fractures is relatively similar. Due to the small spacing between adjacent fractures, the propagation of a fracture inevitably affects the propagation of surrounding fractures. Hence, the multi-fracture propagation induced by thermal shock exhibits competition effect. During the subsequent thermal shock (t = 5–50 s), the competition effect is mainly manifested in three aspects: (1) there is difference in the fracture length; (2) the propagation rate of some fractures slows down, even being suppressed; and (3) some fractures change from the open state to the close state. After the thermal shock with 50 s, only two fractures keep propagating.
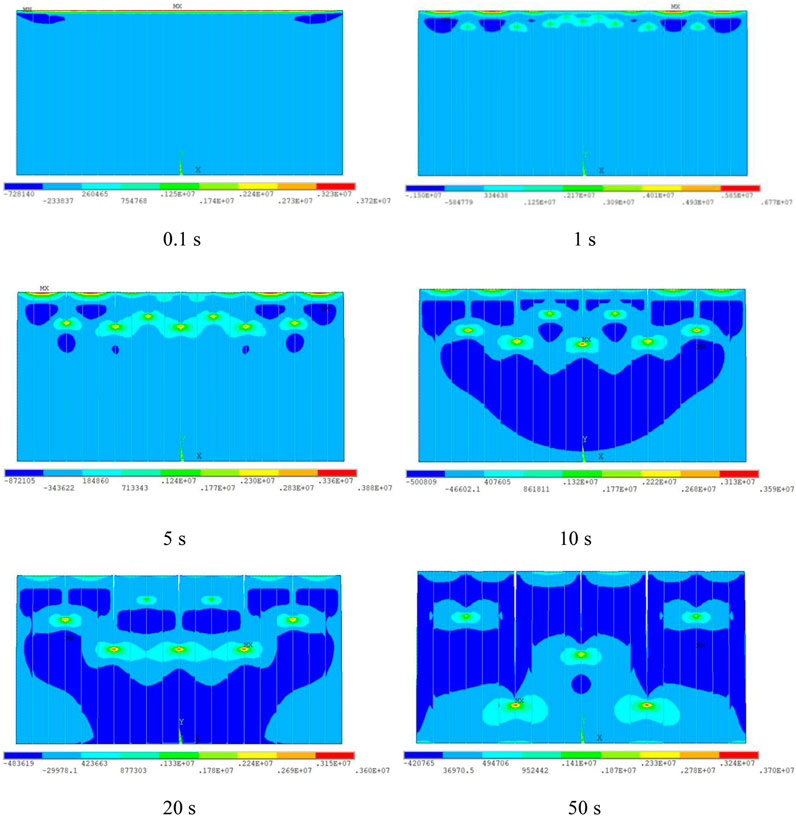
FIGURE 10. Propagation of fractures and stress distribution under thermal shock when heat exchange coefficient is 1,000 W/(m−2 K−1).
With the propagation of fractures, the stress distribution in the rock changes. When t = 0.1 s, the influence of thermal shock is mainly at the upper surface. The region is in a shrinkage state, and presents a tensile stress state. The interior of the rock is not affected by thermal shock and is in the compression state with low stress. With the heat exchange process continues (t = 1–5 s), the region surrounding the upper surface is affected by the fracture propagation. At the fracture tip, a stress concentration zone is formed. Because the temperature gradient is still high, the maximum tension stress occurs in the upper surface. When t = 10–20 s, the temperature gradient becomes small, and the maximum tension stress occurs in the fracture tip. It is noted that due to the stress release during fracture propagation, the maximum tension stress is small, which is lower than 4 MPa. In the interior of the rock, the influence of thermal shock is obvious gradually. The compressive stress decreases in the compression region. Finally, when t = 50 s, except for the region around the fracture tip, the other region in the rock is in a low stress zone.
When the heat exchange coefficient is 500 W/(m−2 K−1), the propagation of fractures and stress distribution in the rock is shown in Figure 11. Unlike the former case, smaller coefficient induces lower temperature gradient. Then, the induced stress is also smaller. For example, when t = 1 s, the maximum stress in the upper surface is 6.8 MPa. During the period of thermal shock of 1 s, no fractures is generated in the rock. When t = 5 s, three fractures are generated. With thermal shock continues, the fractures propagate forward. However, there are no new fractures occurring. Generally, the characteristics is similar with the case with the coefficient of 1000 W/(m−2 K−1).
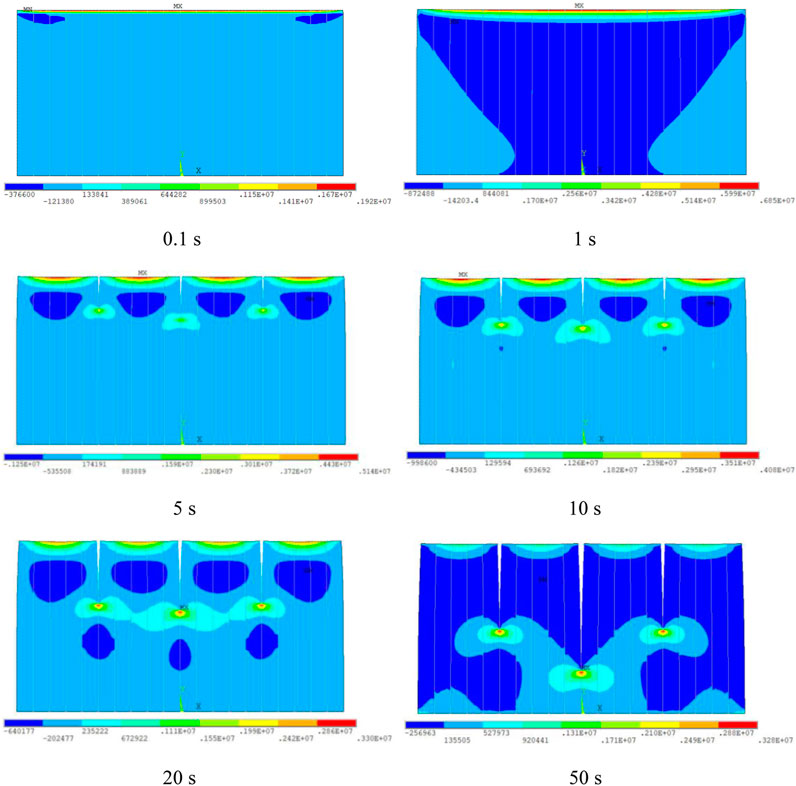
FIGURE 11. Propagation of fractures and stress distribution under thermal shock when heat exchange coefficient is 500 W/(m−2 K−1).
When the heat exchange coefficient is 100 W/(m−2 K−1), the stress distribution in the rock is shown in Figure 12. The maximum tension stress increases with the process of heat exchange. However, after the thermal shock of 50 s, the maximum tension stress is 5 MPa, which is lower than 7 MPa. Thus, there is no fractures generated in the rock.
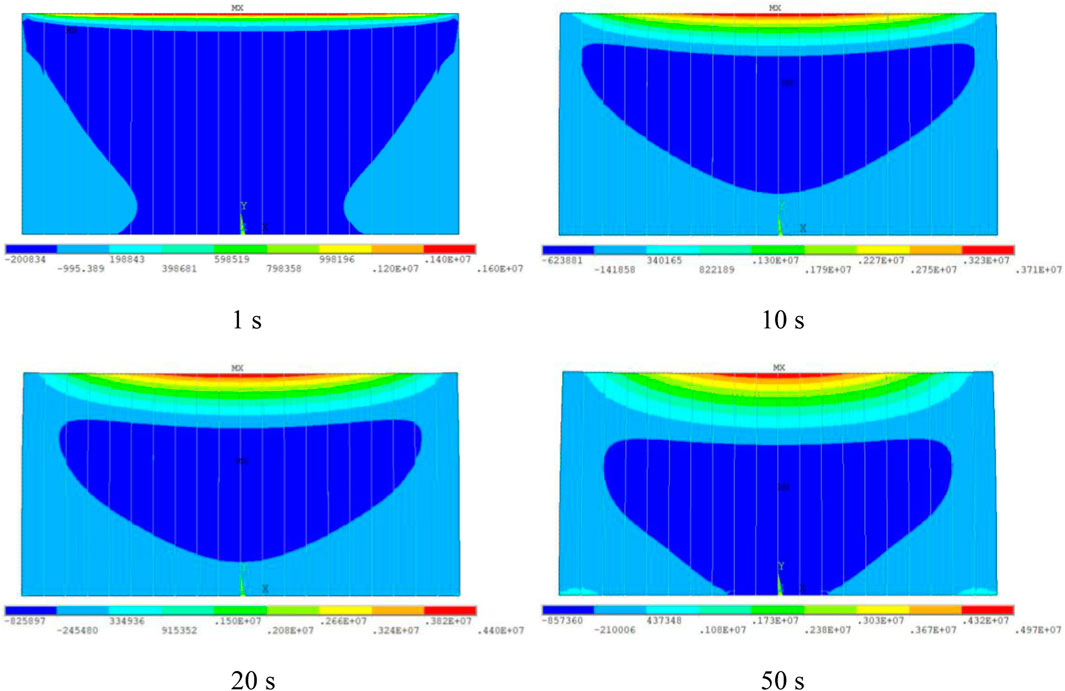
FIGURE 12. Stress distribution when the heat exchange coefficient is 100 W/(m−2 K−1).
Based on the analysis above, the heat exchange coefficient has a significant effect on fracture initiation and propagation. When the coefficient is small (e.g., 100 W/(m−2·K−1)), there is no fracture generated in the rock. As the coefficient increases, the induced tension stress becomes high and lead to the fracture initiation. More important, the larger the coefficient, the more fractures are generated. Therefore, the fractures induced by thermal shock not only depend on the temperature difference between the hot rock and the cryogenic fluid, but also are determined by the heat exchange coefficient. By applying the heat convective boundary, the effect of the fracturing fluid on the fracture initiation and propagation can be further discussed.
In this paper, a TH coupled model is developed to study the thermal shock process. The novel model considers the heat conductive boundary between the hot rock and the cryogenic fluid. Then, effect of the thermal shock on the distribution of the temperature and stress, as well as the initiation and propagation of fractures are analysed. The conclusions are summarized as follows:
(1) Once the thermal shock occurs, the temperature at the upper surface drops quickly. The temperature inside the rock gradually decreases. With the location increases from 0 to 0.025 m, the variation rate of the temperature exhibits a characteristic of first fast and then slow. Due to the temperature gradient, the stress occurs in the rock. With the location increases from 0 to 0.025 m, the stress quickly decreases, and the stress state translates from tensile stress to compressive stress.
(2) At the upper surface, the temperature decline rate shows a trend of first fast and then slow. The stress changes with time can be divided into three stages, which is very important to rock damage. Once there is no damage occurred in the rock at the initial stage, there will be no damage in the later stage. In addition, the variations of temperature and stress are greatly affected by the heat exchange coefficient.
(3) With thermal shock continues, the tension stress increases. As the stress is greater than the tension strength, the rock is damaged. The multi-fracture propagation induced by thermal shock exhibits competition effect. This process is very important to further fracturing. With the propagation of fractures, the stress distribution in the rock changes. The heat exchange coefficient has a significant effect on fracture initiation and propagation. The larger the coefficient, the more fractures are generated.
The original contributions presented in the study are included in the article/supplementary material, further inquiries can be directed to the corresponding author.
All authors listed have made a substantial, direct, and intellectual contribution to the work and approved it for publication.
This study was financially supported by the major project of National Natural Science Foundation of China (Grant No. 52192622), the Key Laboratory of Shale Gas Exploration, Ministry of Natural Resources (Grant No. KLSGE-202103) the Science and Technology Department of Sichuan Province (Grant Nos. 2021YFH0118 and 2021YFH0048) and the Natural Science Foundation of Chongqing, China (Grant No. CSTB2022NSCQ-BHX0721).
Author YL was employed by the China Petroleum Xinan Oil & Gas Field Company Chongqing Gas Mine.
The remaining authors declare that the research was conducted in the absence of any commercial or financial relationships that could be construed as a potential conflict of interest.
All claims expressed in this article are solely those of the authors and do not necessarily represent those of their affiliated organizations, or those of the publisher, the editors and the reviewers. Any product that may be evaluated in this article, or claim that may be made by its manufacturer, is not guaranteed or endorsed by the publisher.
Bahr, H. A., Hans-Jürgen, W., Bahr, U., Hofmann, M., Fischer, G., Lampenscherf, S., et al. (2010). Scaling behavior of thermal shock crack patterns and tunneling cracks driven by cooling or drying. J. Mech. Phys. Solids58 (9), 1411–1421. doi:10.1016/j.jmps.2010.05.005
Burlayenko, V. N., Altenbach, H., Sadowski, T., and Dimitrova, S. D. (2016). Computational simulations of thermal shock cracking by the virtual crack closure technique in a functionally graded plate. Comput. Mater. Sci.116, 11–21. doi:10.1016/j.commatsci.2015.08.038
Cai, C., Li, G., Huang, Z., Shen, Z., Tian, S., and Wei, J. (2014). Experimental study of the effect of liquid nitrogen cooling on rock pore structure. J. Nat. Gas Sci. Eng.21, 507–517. doi:10.1016/j.jngse.2014.08.026
Cha, M., Alqahtani, N. B., Yin, X., Kneafsey, T. J., Yao, B., and Wu, Y. S. (2017). Laboratory system for studying cryogenic thermal rock fracturing for well stimulation. J. Petroleum Sci. Eng.156, 780–789. doi:10.1016/j.petrol.2017.06.062
Cha, M. S., Yin, X. L., Kneafsey, T., Johanson, B., Alqahtani, N., Miskimins, J., et al. (2014). Cryogenic fracturing for reservoir stimulation - laboratory studies. J. Nat. Gas Sci. Eng.124, 436–450. doi:10.1016/j.petrol.2014.09.003
Chang, X., Xu, E., Guo, Y. T., Yang, C. H., Hu, Z. W., and Guo, W. (2022). Experimental study of hydraulic fracture initiation and propagation in deep shale with different injection methods. J. Petroleum Sci. Eng.216, 110834. doi:10.1016/j.petrol.2022.110834
Dahi, T. A., Ahmadi, M., Wang, W., and Olson, J. E. (2014). Thermal reactivation of microfractures and its potential impact on hydraulic-fracture efficiency. SPE-180071-PA19, 761–770. doi:10.2118/163872-pa
Enayatpour, S., Van, O. E., and Patzek, T. (2018b). Thermal cooling to improve hydraulic fracturing efficiency and hydrocarbon production in shales. J. Nat. Gas Sci. Eng.62, 184–201. doi:10.1016/j.jngse.2018.12.008
Enayatpour, S., Van, O. E., and Patzek, T. (2018a). Thermal shale fracturing simulation using the Cohesive Zone Method (CZM). J. Nat. Gas Sci. Eng.55, 476–494. doi:10.1016/j.jngse.2018.05.014
Garcia, J., Hartline, C., Walters, M., Wright, M., Rutqvist, J., Dobson, P. F., et al. (2015). The northwest geysers EGS demonstration project, California- Part1: Characterization and reservoir response to injection. Geothermics63, 97–119. doi:10.1016/j.geothermics.2015.08.003
Guo, J. C., Zhao, Z. H., Lu, Q. L., Yi, C. B., and Chen, C. G. (2021). Research progress in key mechanical theories of deep shale network fracturing. Nat. Gas. Ind.41 (01), 102–117. doi:10.3787/j.issn.1000-0976.2021.01.009
Han, S. C., Gao, Q., Cheng, Y. F., Yan, C. L., Han, Z. Y., and Shi, X. (2020). Experimental study on brittle response of shale to cryogenic fluid nitrogen treatment. J. Nat. Gas Sci. Eng.194, 107463. doi:10.1016/j.petrol.2020.107463
Huang, L. K., He, R., Yang, Z. Z., Tan, P., Chen, Z. W., Li, X., et al. (2023). Exploring hydraulic fracture behavior in glutenite formation with strong heterogeneity and variable lithology based on DEM simulation. Eng. Fract. Mech.278, 109020. doi:10.1016/j.engfracmech.2022.109020
Huang, L., Liu, J., Zhang, F., Donstov, E., and Damjanac, B. (2019). Exploring the influence of rock inherent heterogeneity and grain size on hydraulic fracturing using discrete element modeling. Int. J. Solids Struct.176, 207–220. doi:10.1016/j.ijsolstr.2019.06.018
Kim, K. M., and Kemeny, J. (2009). “Effect of thermal shock and rapid unloading on mechanical rock properties,” in 43rd US Rock Mechanics Symposium and 4th US-Canada Rock Mechanics Symposium, Asheville, North Carolina, June - 1 July 2009 (American Rock Mechanics Association), 1–10.
Qin, L., Zhai, C., Liu, S., and Xu, J. (2018). Mechanical behavior and fracture spatial propagation of coal injected with liquid nitrogen under triaxial stress applied for coalbed methane recovery. Eng. Geol.233, 1–10. doi:10.1016/j.enggeo.2017.11.019
Rutqvist, J., Jeanne, P., Dobson, P. F., Garcia, J., Hartline, C., Hutchings, L., et al. (2015). The northwest geysers EGS demonstration project, California-Part2: Modeling and interpretation. Geothermics63, 120–138. doi:10.1016/j.geothermics.2015.08.002
Tan, P., Jin, Y., and Pang, H. W. (2021). Hydraulic fracture vertical propagation behavior in transversely isotropic layered shale formation with transition zone using XFEM-based CZM method. Eng. Fract. Mech.248, 107707. doi:10.1016/j.engfracmech.2021.107707
Tang, S. B., Wang, J. X., and Chen, P. Z. (2020). Theoretical and numerical studies of cryogenic fracturing induced by thermal shock for reservoir stimulation. Int. J. Rock Mech. Min. Sci.125, 104160. doi:10.1016/j.ijrmms.2019.104160
Tang, S. B., Zhang, H., Tang, C. A., and Liu, H. Y. (2016). Numerical model for the cracking behavior of heterogeneous brittle solids subjected to thermal shock. Int. J. Solids Struct.80, 520–531. doi:10.1016/j.ijsolstr.2015.10.012
Tomac, I., and Gutierrez, M. (2017). Coupled hydro-thermo-mechanical modeling of hydraulic fracturing in quasi-brittle rocks using BPM-DEM. J. Rock Mech. Geotechnical Eng.9 (1), 92–104. doi:10.1016/j.jrmge.2016.10.001
Tran, D., Settari, A., and Nghiem, L. (2012). “Initiation and propagation of secondary cracks in thermo-poroelastic media,” in 46th U.S. Rock Mechanics/Geomechanics Symposium, Chicago, Illinois, June 2012 (American Rock Mechanics Association).
Trevisan, A., Borzi, G. P., Movchan, N. V., Movchan, A. B., and Brun, M. (2016). Thermal shock driven fracture in a structured solid: Dynamic crack growth and nucleation. Int. J. Fract.202, 167–177. doi:10.1007/s10704-016-0118-6
Wang, L., Yao, B., Cha, M., Alqahtani, N. B., Patterson, T. W., Kneafsey, T. J., et al. (2016). Waterless fracturing technologies for unconventional reservoirs-opportunities for liquid nitrogen. J. Nat. Gas Sci. Eng.35, 160–174. doi:10.1016/j.jngse.2016.08.052
Yang, R. Y., Huang, Z. W., Shi, Y., Yang, Z. Q., and Huang, P. P. (2019). Laboratory investigation on cryogenic fracturing of hot dry rock under triaxial-confining stresses. Geothermics79, 46–60. doi:10.1016/j.geothermics.2019.01.008
Yao, B. W., Wang, L., Yin, X. L., and Wu, Y. S. (2017). Numerical modeling of cryogenic fracturing process on laboratory-scale Niobrara shale samples. J. Nat. Gas Sci. Eng.48, 169–177. doi:10.1016/j.jngse.2016.10.041
Zhang, X., Lu, Y., Tang, J., Zhou, Z., and Liao, Y. (2016). Experimental study on fracture initiation and propagation in shale using supercritical carbon dioxide fracturing. Fuel190, 370–378. doi:10.1016/j.fuel.2016.10.120
Zhang, Z., Xiong, Y. M., Mao, L. J., Lu, J., Wang, M., and Peng, G. (2019). Transient temperature prediction models of wellbore and formation in well-kick condition during circulation stage. J. Petroleum Sci. Eng.175, 266–279. doi:10.1016/j.petrol.2018.12.044
Zhao, J. Z., Ren, L., Jiang, T. X., Hu, D. F., Wu, L. Z., Wu, J., et al. (2022). Ten years of gas shale fracturing in China: Review and prospect. Nat. Gas. Ind. B9 (2), 158–175. doi:10.1016/j.ngib.2022.03.002
Keywords: thermal shock, TM coupled model, distribution of temperature, stress initiation and propagation of fractures, heat exchange coefficient
Citation: Wang W, Zhao P, Liao Y, Zhang Y, Peng J, Xian H and Liu J (2023) Investigating fracture initiation and propagation in deep buried shale due to thermal shock: a numerical approach. Front. Energy Res. 11:1231958. doi: 10.3389/fenrg.2023.1231958
Received: 31 May 2023; Accepted: 28 June 2023;
Published: 14 July 2023.
Edited by:
Peng Tan, CNPC Engineering Technology R & D Company Limited, ChinaReviewed by:
Jie Chi, China University of Petroleum (Huadong), ChinaCopyright © 2023 Wang, Zhao, Liao, Zhang, Peng, Xian and Liu. This is an open-access article distributed under the terms of the Creative Commons Attribution License (CC BY). The use, distribution or reproduction in other forums is permitted, provided the original author(s) and the copyright owner(s) are credited and that the original publication in this journal is cited, in accordance with accepted academic practice. No use, distribution or reproduction is permitted which does not comply with these terms.
*Correspondence: Peng Zhao, c2N1X3poYW9wZW5nQDE2My5jb20=
Disclaimer: All claims expressed in this article are solely those of the authors and do not necessarily represent those of their affiliated organizations, or those of the publisher, the editors and the reviewers. Any product that may be evaluated in this article or claim that may be made by its manufacturer is not guaranteed or endorsed by the publisher.
Research integrity at Frontiers
Learn more about the work of our research integrity team to safeguard the quality of each article we publish.