 Chuanyu Xiong1
 Jialun Sun
- 1State Grid Hubei Electric Power Company Limited Economic Research Institute, Wuhan, Hubei, China
- 2State Grid Hubei Electric Power Co., Ltd., Wuhan, Hubei, China
- 3State Grid Hubei Electric Power Research Institute, Wuhan, Hubei, China
- 4College of Electrical and New Energy Engineering, China Three Gorges University, Yichang, Hubei, China
With the large-scale growth and grid connection of intermittent renewable energy such as wind and solar, the problem of increasing renewable energy curtailment rate and system backup flexibility has become increasingly prominent. In order to solve the problem of high proportion of renewable energy scientific consumption and flexible and stable operation of energy system. We propose a flexible and economical dispatch method based on data-driven multi-regional power system. For the problem of economic dispatch of multi-area power system, a mathematical calculation model is established to satisfy the constraints of unit output, system power balance, unit ramp rate, and valve point effect, and to consider the requirement of minimizing the cost of multi-area power load comprehensively. Based on data-driven, this paper adopts an improved fruit fly optimization algorithm to quickly find the global optimal solution. The calculations are performed by IEEE6 simulation test system, and the results verify the feasibility of the proposed algorithm. The improved fruit fly optimization algorithm is compared and analyzed with other algorithms considering the quality of the obtained solutions. The results show the effectiveness and superiority of the proposed algorithm in solving multi-area economic dispatching problems in real power systems.
1 Introduction
In response to global climate change, the structural characteristics of the energy system are gradual shift to efficiency, cleanliness and sustainability (Li et al., 2021).A high proportion of wind and solar energy promote the low-carbon development of multi-energy system economy. But there are many problems. On the one hand, it is transmitted by the original system factors such as force limitation, electric energy storage characteristics, and low effectiveness of demand-side response interactive management have highlighted the problem of increasing the curtailment rate of renewable energy in the system. On the other hand, renewable energy sources such as wind and solar contribute to themselves. There is extreme volatility and intermittency that cannot be achieved smoothly and stably Large-scale grid integration. The force is increasing, the regulation capacity is insufficient, and the renewable energy is further affected consumption has an impact. Therefore, how to coordinate the scale development of renewable energy. The issue of flexible scheduling of multi-energy systems is crucial (Wang et al., 2021; Zongxiang et al., 2022).
In power system operation, economic dispatch is an important optimization problem. The goal of power systems economic dispatch is to minimize the total cost of generation while meeting the constraints of a single region. In contrast, the economic dispatch of a multi-regional power system typically involves dividing the generator set into several interconnected generating zones. The dispatch model calculates the system’s power generation capacity and the amount of electricity exchanged between regions, while meeting constraints such as power demand and motor characteristics, thereby minimizing the overall power generation capacity cost. The economic dispatch of the power system is an important link affecting the economic operation of the power system. This solution model reduces the power generation and operating costs of the system by rationalizing the output of each unit in the power system and optimizing the system operation and disassembly schedule (Ma et al., 2018; Ma et al., 2019; Zhang et al., 2022).
Currently, there are more algorithms on economic dispatch of power systems. Wang et al. (2022) proposed an improved state transition algorithm (MTSTA) based on mirror transformation and dynamic axesion transformation, and a new repair method of constraint handling combined with penalty function was used to deal with constraint conditions. Barukčić et al. (2022) adopted NSGA-II algorithm and considered the wind power fluctuations on the dynamic economic dispatch of spinning reserve constraints. As a commonly used optimization algorithm for solving complex problems, the swarm intelligence algorithm has greater advantages in the optimization of economic dispatch of power systems. The swarm intelligence algorithm solves the optimal solution for the economic dispatch of the power system by simulating individual generating units as bionic individuals and combining the power consumption path and demand. Xiao-hong and He (2017) proposed gravitational search-particle swarm optimization algorithm, and the individual with the largest particle fitness was obtained. According to the optimal individual position (Chen et al., 2022), the optimal economic dispatching scheme of power systems was obtained. Aiming at the problems of premature convergence in the traditional particle swarm optimization algorithm, a multi-agent particle swarm optimization algorithm based on chaos is used to solve it. Thus, the paper established a dynamic optimization dispatching model for power system with system frequency regulation constraints (Zhang and Ma, 2023). Author J. Yang, J. Liu, Y. Xiang, S. Zhang and J. Liu proposes a real-time dynamic scheduling strategy considering economic operation and complementary regulatory capabilities. They considered the uncertainty of photovoltaic and load demand, and studied the integrated power system of zero-carbon hydropower station (PV) pumped storage (PHS). The power fluctuation of the upper grid co-coupling point (PCC) after PHS participation is alleviated (Yang et al., 2023). In Literature (Pradeep Kumar and Pillai, 2020), V. Pradeep Kumar and A. S. Pillai use dynamic schedulers to compare static scheduling. Discover that dynamic scheduling adds flexibility and time-constrained guarantees. The author’s study provides a comparison of the performance of fixed-priority and dynamic priority scheduling algorithms for automotive subsystems.
The economic dispatch problem is characterized by high-dimensional, non-convex, discrete, multi-constrained, and numerous local minima, which leads to a great difficulty in finding the optimal solution. The traditional bionic swarm intelligence algorithm is not prominent enough in local and global search capability, and the optimal extreme value solution is not accurate enough. In this paper, three test systems with different characteristics, IEEE6, IEEE40, and IEEE10, are selected and optimally scheduled using an improved fruit fly optimization algorithm. Among them, the IEEE6 machine test system and the IEEE40 machine test system are static scheduling models, and the IEEE10 machine test system is a dynamic scheduling model. Different test systems have different objective functions and constraints, and the treatment of the con-straints in the specific optimization process will also be different.
2 Introduction to traditional economic scheduling
2.1 Objective function
The model has the optimization objective of minimizing the operating cost of the system, and its functional expression is Chen et al. (2022)
Where,
In general, the generation cost of a thermal power unit can be expressed by its consumption characteristic function with the mathematical expression
In this equation,
When optimizing the two test systems, IEEE10 and IEEE40, threshold effects need to be considered. The valve point effect refers to the wire drawing effect that occurs when the turbine of a thermal power unit is suddenly opened by the intake valve (Xiao-hong and He, 2017). When considering the valve point effect, the traditional consumption characteristic function cannot accurately represent the input-output relationship of the unit. The solution is to superimpose a sinusoidal function on top of the traditional consumption characteristic function to correctly represent the power generation cost of thermal power units. If the valve point effect is taken into account, the objective function can be expressed as
Where,
The total operating cost curve of thermal power units considering the valve point effect is shown in Figure 1. It can be seen from the figure that due to the valve point effect, the originally smooth curve is non-convex. This leads to many local minima in the process of optimizing this test system, which increases the difficulty of optimization and puts high demands on the performance of the optimization algorithm.
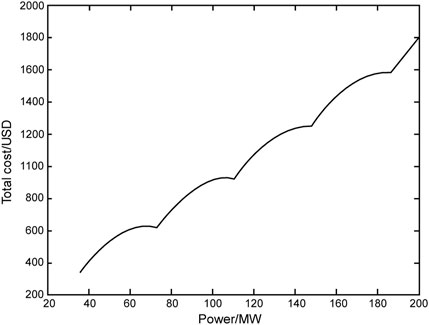
FIGURE 1. The total cost function of thermal power units taking into account the valve point effect.
2.2 Mathematical model of the traditional economic dispatching problem
2.2.1 System power balance constraint
The system power balance constraint is composed of the active output of the unit, the system network power loss and the total system load.
Where
The system network power loss is
In practical simulations, since a strict system power balance is difficult to achieve, the general treatment is to set a very small value (Chen et al., 2022)
2.2.2 Unit output constraint
2.2.3 Unit ramp rate constraints
Unit ramp rate constraints is an important constraint to be considered in dynamic dispatching. In dynamic dispatch, it is necessary to consider the upper and lower limits of unit output as well as the unit ramp rate constraints. The unit ramp rate constraints can be represented as (Zhang and Ma, 2023).
Where:
2.2.4 Unit prohibited operating zones constraints
When a thermal power unit is in operation, there will be some subintervals within its operation interval. When thermal power units are operated within these subintervals, it will lead to excessive amplitude of unit bearing vibration. Therefore, it is necessary to set up prohibited operating zones within the operation interval to avoid these subintervals during the operation of the unit to prevent excessive vibration of the unit bearings. The operation interval with the prohibited operating zones set can be expressed as (Yang et al., 2023)
Where,
Due to the high parameter dimension and complex model state, this paper relies on experience to select parameters.
3 Constraint heuristic processing strategy
Most of the swarm intelligence optimization algorithms use the penalty function method when dealing with the constraints in constrained optimization problems (Hosseinnezhad et al., 2014; Huo et al., 2015). The penalty function method requires an appropriate penalty factor to ensure the accuracy of the optimization and the efficiency of the whole optimization process when dealing with constraints. If the penalty factor is not set properly, it is very likely to make the optimization result less than expected and make the algorithm fall into local optimum in the process of finding the best. Therefore, this paper deals with the constraints through a heuristic processing strategy, thus avoiding unsatisfactory optimization results due to improper selection of penalty factors (Roy et al., 2014; Mishra et al., 2022). At the same time, different test systems consider different constraints and adjust the heuristic processing strategy as follows.
3.1 Strategies for handling static dispatching constraints
In this paper, we consider the system power balance constraint, unit output constraint, unit prohibited operating zones constraints and network power loss in optimizing the IEEE6 test system. In the optimization of the IEEE40 machine test system, the power balance constraint and the upper and lower limits of unit output are considered, and the network power loss and the operating exclusion zone constraint are ignored. The heuristic processing flow for the constraints of the two test systems is shown in Figure 2. The specific steps are as follows (Sa-Ngiamvibool et al., 2011):
• Step 1: Determine whether any unit i satisfies the upper and lower limits of unit output and the prohibited operating zones constraints (When dealing with the constraints of the IEEE40 test system, only whether the upper and lower output constraints are met is considered, and no prohibited operating zones constraints are considered.). The set of all prohibited operating zones of unit i is denoted by
• Step 2: Determine whether the system satisfies the power balance constraint. The inequality between unit output and network power loss and load of the test system is denoted by
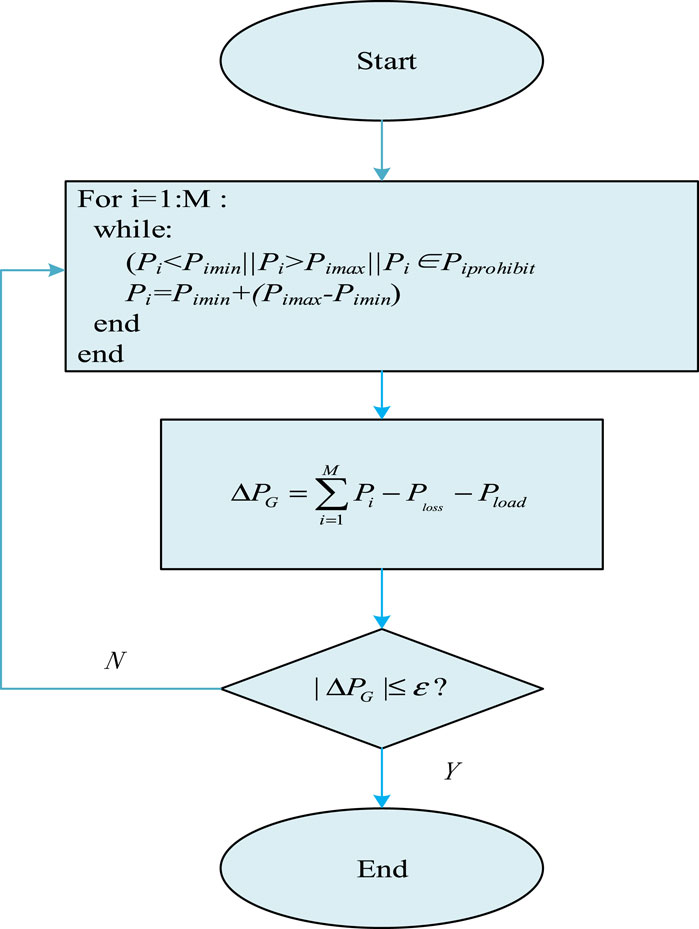
FIGURE 2. Heuristic processing flow chart for static dispatch constraints.
3.2 Strategies for handling dynamic dispatching constraints
The system power balance constraint, unit output constraint, and unit climbing constraint are considered in optimizing the IEEE10 machine test system, and the network power loss is ignored. The heuristic processing flow of the constraints is shown in Figure 3. The specific steps are as follows:
• Step 1: Determine whether any unit meets the upper and lower capacity constraints at the first dispatch. If the constraint is not satisfied, the output value of the unit needs to be readjusted to meet the upper and lower limits of the unit output.
• Step 2: Determine whether the test system satisfies the power balance constraint at the first dispatch (set
• Step 3: Integrate the ramp rate constraints and the upper and lower unit output constraints into a set of constraints. The algorithm uses
• Step 4: Determine whether it is possible for unit i to satisfy the power balance constraint between
• Step 5: Determine whether any unit i satisfies the constraints in the range
• Step 6: Determine whether the test system satisfies the power balance constraint at the dispatching moment t. If the test system does not satisfy the power balance constraint at dispatch moment t, the imbalance is distributed equally to each unit to adjust the unit output, and then returns to Step 5. If the test system satisfies the power balance constraint at dispatch moment t, it proceeds to the next step.
• Step 7: Determine if the last dispatching moment has been reached. The algorithm uses T to represent the total number of scheduling periods for the test system. If the last dispatching moment has not been reached, return to Step 3 for the heuristic processing process of the constraints for the next dispatching moment. If the last dispatching moment has been reached, the unit output values for all dispatching moments are output.
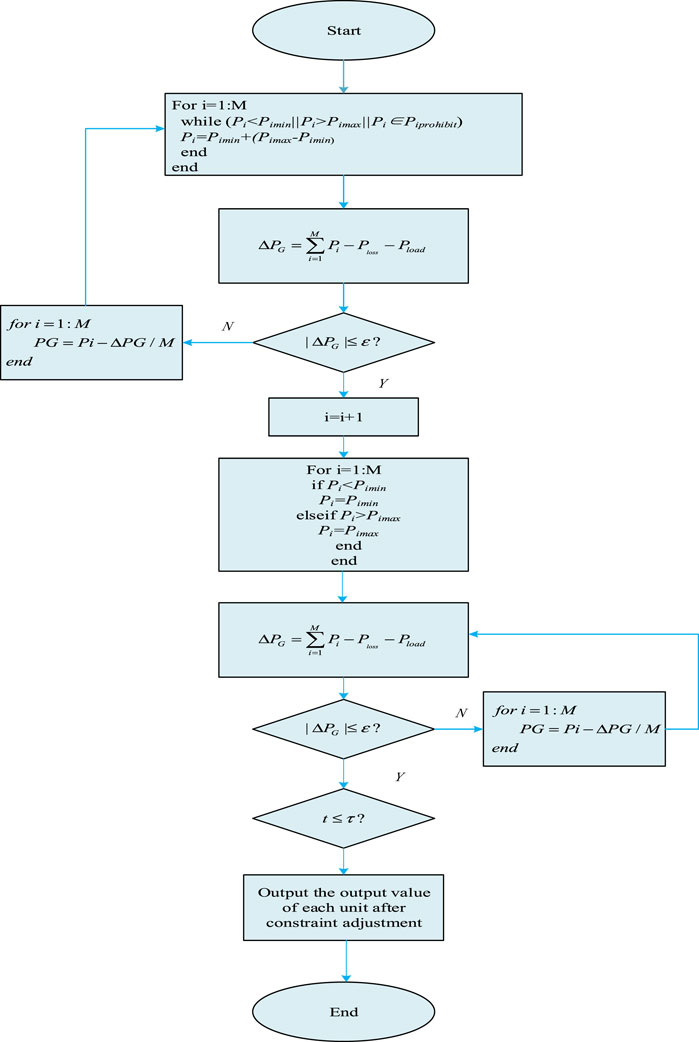
FIGURE 3. Heuristic processing flow chart for dynamic dispatch constraints.
4 Economic dispatch of power system based on improved fruit fly optimization algorithm
The algorithm flow is shown in Figure 4. The specific steps are shown in Figure 4.
• Step 1: Initialize the relevant parameters: set the total cost of system power generation
• Step 2: The individual fruit fly is given a search radius R as well as a random direction and distance to search using olfaction.
• Step 3: Execute a heuristic constraint processing strategy for each individual fruit fly so that each individual fruit fly satisfies the constraint.
• Step 4: Use the location
• Step 5: Find the individual fruit fly with the best flavor concentration in the fruit fly population.
• Step 6: The taste concentration and location information of the optimal fruit fly individual are recorded and retained, and all fruit flies in the population use vision to fly to the location of the optimal fruit fly individual.
• Step 7: determines whether this iteration is the first one. If not, determine whether the best flavor concentration produced by this iteration is less than the best flavor concentration produced by the previous iteration (i.e., better economy). If the best flavor concentration produced by this iteration is greater than the best flavor concentration produced by the previous iteration, Step 2 is executed.
• Step 8: Iterate to find the best. If the current number of iterations is less than the maximum number of iterations “Maxgen”, Step 2 will be executed, if the current number of iterations is equal to the maximum number of iterations, the result will be output and the optimization process will be finished.
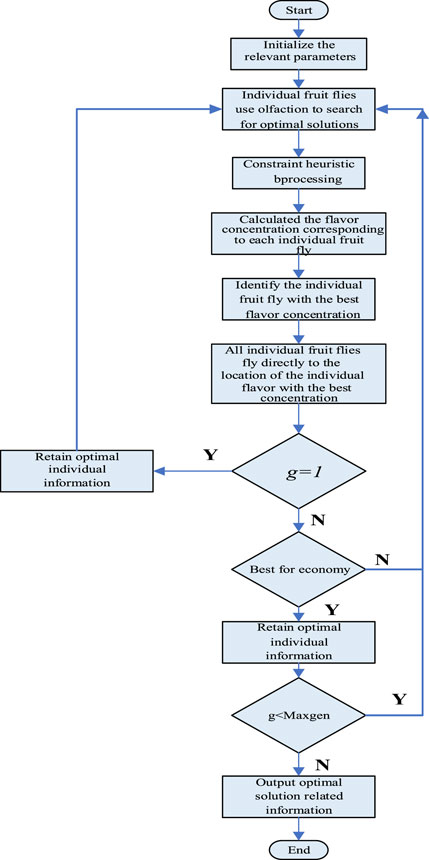
FIGURE 4. Flow chart of economic dispatch based on improved fruit fly optimization algorithm.
5 Example analysis
The example is based on the IEEE6 test system, and the system data are shown in Table 1. The total load of the system is 1260 MW, and each unit contains upper and lower output limits as well as two sets of prohibited operating zones constraints, taking into account the network power losses. The algorithm mentioned in this article does not guarantee convergence at any parameter setting. In this paper, the algorithm is executed in strict accordance with the scheduling optimization process, and the setting of each parameter is considered in detail to ensure that the model converges within a reasonable range to ensure that other performance of the model is not affected.
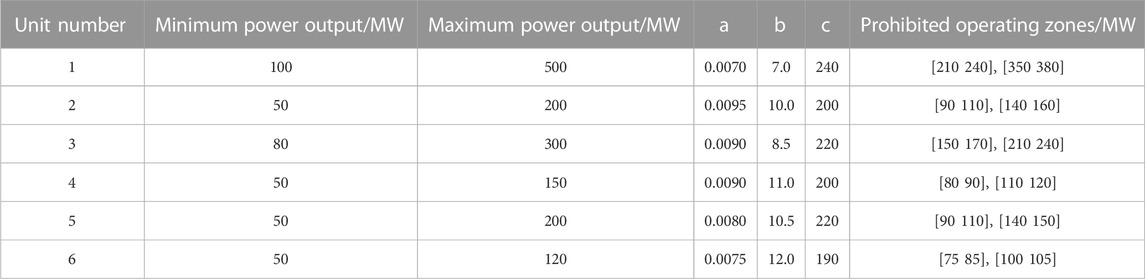
TABLE 1. Parameters related to the algorithm test system.
The unit contains upper and lower output limits and prohibited operating zones constraints, resulting in a discontinuous and non-convex solution space for this test system.
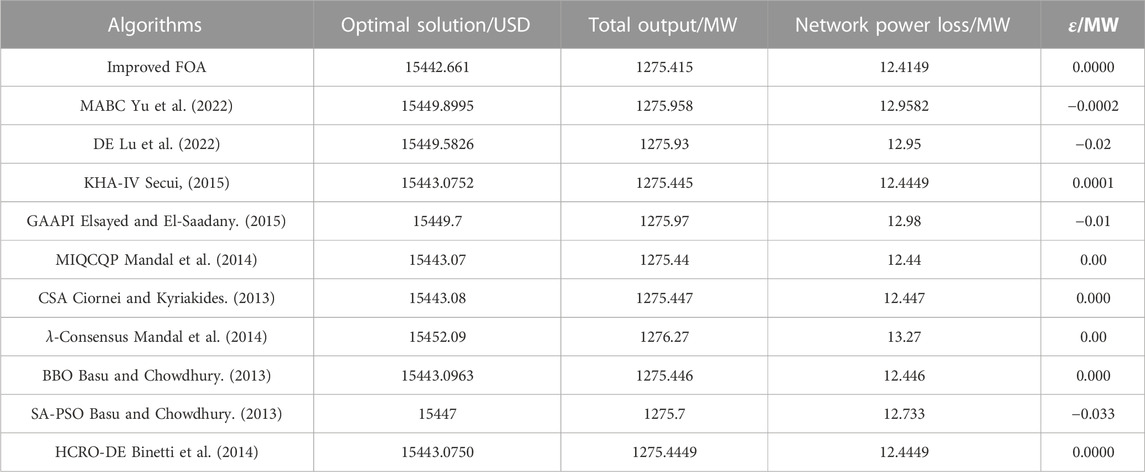
TABLE 2. Comparison of the optimal solutions of different algorithms.
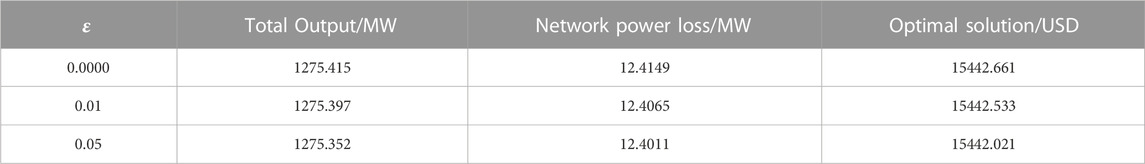
TABLE 3. Optimization results with different solving accuracy.

FIGURE 5. Convergence characteristic diagram of improved FOA.
From Table 2, it can be observed that the optimal solutions of MIQCQP, CSA,
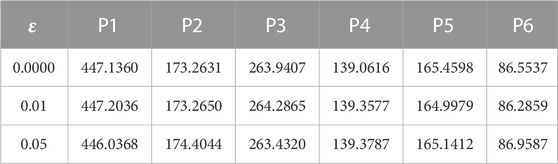
TABLE 4. P1-P6 Optimization results with different solving accuracy.
As can be seen from Figure 5, the improved FOA shows good convergence in the search for the best FOA. In terms of optimization time, while optimizing the IEEE6 test system, the time required to improve FOA is 2.21 s, while the time required for SA-PSO and HCRO-DE is 7.58 s and 4.17 s, respectively. In terms of the number of iterations, the improved FOA only needs 73 iterations to reach the optimal value, while the CSA requires more than 100 iterations to reach the optimal value.
Taking into account the quality of the resulting solution, the improved fruit fly optimization algorithm is compared and analyzed with other algorithms. The results show that the algorithm has good effectiveness and superiority in solving the problem of multi-regional economic dispatch of actual power system.rior in solving the multi-regional economic dispatching problem of the actual power system.
Data availability statement
The raw data supporting the conclusion of this article will be made available by the authors, without undue reservation.
Author contributions
JS mainly establishes the implementation ideas of the paper and the detailed strategy of algorithm optimization in this paper, author CX models the paper and analyzes the results to reach the final conclusion, and the other authors supplement and improve the subtle aspects such as the format and graphing of the paper. All authors contributed to the article and approved the submitted version.
Funding
This research was funded by the State Grid Headquarters Science and Technology Project (No. 5400-202122573A-0-5-SF).
Acknowledgments
Thanks to the support of by the State Grid Headquarters Science and Technology Project (No. 5400-202122573A-0-5-SF). Thanks to all the authors of this article for their contributions in this article.
Conflict of interest
Authors CX and LM were employed by the company State Grid Hubei Electric Power Company Limited Economic Research Institute. Author LX was employed by the company State Grid Hubei Electric Power Co., Ltd.
The remaining authors declare that the research was conducted in the absence of any commercial or financial relationships that could be construed as a potential conflict of interest.
Publisher’s note
All claims expressed in this article are solely those of the authors and do not necessarily represent those of their affiliated organizations, or those of the publisher, the editors and the reviewers. Any product that may be evaluated in this article, or claim that may be made by its manufacturer, is not guaranteed or endorsed by the publisher.
References
Barukčić, M., Varga, T., Benšić, T., and Jerković Štil, V. (2022). Optimal allocation of renewable energy sources and battery storage systems considering energy management system optimization based on fuzzy inference. Energies 15 (19), 6884. doi:10.3390/en15196884
Basu, M., and Chowdhury, A. (2013). Cuckoo search algorithm for economic dispatch. Energy 60 (7), 99–108. doi:10.1016/j.energy.2013.07.011
Binetti, G., Davoudi, A., Lewis, F. L., Naso, D., and Turchiano, B. (2014). Distributed consensus-based economic dispatch with transmission losses. IEEE Trans. Power Syst. 29 (4), 1711–1720. doi:10.1109/tpwrs.2014.2299436
Chen, Z., Wang, Z., Li, X., and Zhang, C. (2022). Economic dispatching of power systems based on gravitational search-particle swarm optimization algorithm. J. Univ. Jinan(Science Technol. 36 (5), 603–608.
Ciornei, I., and Kyriakides, E. (2013). A GA-API solution for the economic dispatch of generation in power system operation. IEEE Trans. Power Syst. 28 (1), 570. doi:10.1109/TPWRS.2011.2168833
Elsayed, W. T., and El-Saadany, E. F. (2015). A fully decentralized approach for solving the economic dispatch problem. IEEE Trans. Power Syst. 30 (4), 2179–2189. doi:10.1109/tpwrs.2014.2360369
Hosseinnezhad, V., Rafiee, M., Ahmadian, M., and Ameli, M. T. (2014). Species-based quantum particle swarm optimization for economic load dispatch. Int. J. Electr. Power & Energy Syst. 63 (12), 311–322. doi:10.1016/j.ijepes.2014.05.066
Huo, Y., Jiang, P., Zhu, Y., Feng, S., and Wu, X. (2015). Optimal real-time scheduling of wind integrated power system presented with storage and wind forecast uncertainties. Energies 8 (2), 1080–1100. doi:10.3390/en8021080
Li, Z., Chen, S., Dong, W., Liu, P., Du, E., Ma, L., et al. (2021). Low carbon transition pathway of power sector under carbon emission constraints. Proc. CSEE 41 (12), 3987–4001. in Chinese.
Lu, J., Xu, L., Jin, J., and Shao, Y. (2022). A mixed algorithm for integrated scheduling optimization in AS/RS and hybrid flowshop. Energies 15 (20), 7558. doi:10.3390/en15207558
Ma, H., Wang, B., Gao, W., Zhu, C., Zhu, C. L., Zheng, Z., et al. (2019). Operation optimization of energy storage equipment participating in auxiliary service in regional integrated energy system. Automation Electr. Power Syst. 43 (8), 34–40+68.
Ma, H., Wang, B., Gao, W., Liu, D., Sun, Y., and Liu, Z. (2018). Optimal scheduling of an regional integrated energy system with energy storage systems for service regulation. Energies 11, 195. doi:10.3390/en11010195
Mandal, B., Roy, P. K., and Mandal, S. (2014). Economic load dispatch using krill herd algorithm. Int. J. Electr. Power & Energy Syst. 57 (5), 1–10. doi:10.1016/j.ijepes.2013.11.016
Mishra, P., Miller, E., Santhanagopalan, S., Kevin, B., and Meintz, A. (2022). A framework to analyze the requirements of a multiport megawatt-level charging station for heavy-duty electric vehicles. Energies 15 (10), 3788. doi:10.3390/en15103788
Pradeep Kumar, V., and Pillai, A. S. (2020). “Dynamic scheduling algorithm for A utomotive safety critical systems,” in 2020 Fourth International Conference on Computing Methodologies and Communication (ICCMC), Erode, India, March 11-13, 2020, 815–820.
Roy, P. K., Bhui, S., and Paul, C. (2014). Solution of economic load dispatch using hybrid chemical reaction optimization approach. Soft Comput. 24, 109–125. doi:10.1016/j.asoc.2014.07.013
Sa-Ngiamvibool, W., Pothiya, S., and Ngamroo, I. (2011). Multiple tabu search algorithm for economic dispatch problem considering valve-point effects. J. Electr. Power & Energy Syst. 33 (4), 846–854. doi:10.1016/j.ijepes.2010.11.011
Secui, D. C. (2015). A new modified artificial bee colony algorithm for the economic dispatch problem. Energy Convers. Manag. 89 (89), 43–62. doi:10.1016/j.enconman.2014.09.034
Wang, H., Yue, C., Yan, X., Hou, J., Liu, S., Zhao, T., et al. (2021). Influence of system inertia on flexibility resource analysis for an interconnection system with a high proportion of intermittent renewable energy. Power Syst. Prot. Control 49 (18), 44–51. in Chinese.
Wang, P.-k., Wang, C., and Zhang, H.-L. (2022). Dynamic economic dispatching of power system with wind farms based on improved state transition algorithm. Comput. Simul. 39 (9), 130–135+155.
Xiao-hong, H. A. O., and He, Kan (2017). Dynamic economic dispatch considering wind power penetration based on NSGA-II. Electron. Des. Eng. 25 (11), 170–175.
Yang, J., Liu, J., Xiang, Y., Zhang, S., and Liu, J. (2023). Data-driven optimal dynamic dispatch for hydro-PV-PHS integrated power systems using deep reinforcement learning approach. CSEE J. Power Energy Syst. 9 (3), 846–858. doi:10.17775/CSEEJPES.2021.07210
Yu, Q., Dong, Y., Du, Y., Yuan, J., and Fang, F. (2022). Optimizing operation strategy in a simulated high-proportion wind power wind–coal combined base load power generation system under multiple scenes. Energies 15 (21), 8004. doi:10.3390/en15218004
Zhang, J., Wang, B., Wang, H., Ma, H., Ma, F., Li, Y., et al. (2022). Operation state evaluation method of Smart distribution network based on free probability theory. Front. Energy Res. 9, 803010. doi:10.3389/fenrg.2021.803010
Zhang, L., and Ma, Y. (2023). Dynamic optimal dispatch of power system considering system frequency regulation constraints. Electron. Des. Eng. 31 (2), 188–193. doi:10.14022/j.issn1674-6236.2023.02.040
Keywords: multi-area economic dispatching, multi-source data-driven, clean energy systems, new power system, constraint planning
Citation: Xiong C, Xu L, Ma L, Hu P, Ye Z and Sun J (2024) Research on large-scale clean energy optimal scheduling method based on multi-source data-driven. Front. Energy Res. 11:1230818. doi: 10.3389/fenrg.2023.1230818
Received: 29 May 2023; Accepted: 17 July 2023;
Published: 08 January 2024.
Edited by:
Fuqi Ma, Xi’an University of Technology, ChinaReviewed by:
Guangsheng Pan, Southeast University, ChinaHongxia Wang, University of Denver, United States
Copyright © 2024 Xiong, Xu, Ma, Hu, Ye and Sun. This is an open-access article distributed under the terms of the Creative Commons Attribution License (CC BY). The use, distribution or reproduction in other forums is permitted, provided the original author(s) and the copyright owner(s) are credited and that the original publication in this journal is cited, in accordance with accepted academic practice. No use, distribution or reproduction is permitted which does not comply with these terms.
*Correspondence: Jialun Sun, MjAyMTA4NTgwMDIxMjIzQGN0Z3UuZWR1LmNu