 Nan Wang
 Dong Wang2
 Xiaoyan Ji
- 1Energy Engineering, Department of Engineering Science and Mathematics, Luleå University of Technology, Luleå, Sweden
- 2Sinopec Nanjing Chemical Research Institute, Nanjing, China
CO2 capture using monoethanolamine (MEA) is one of the important decarbonization options and often considered as a benchmark, while the optimal MEA contraction and systematic process study are still lacking. In this work, firstly, the MEA concentrations between 15 and 30 wt% were studied from both process simulations with Aspen Plus and experimental measurements in the pilot-scale. 20 wt% MEA was identified as the preferable solution. Subsequently, a systematic analysis was conducted for CO2 capture using 20 wt% MEA with/without CO2 compression to study how various parameters, including gas flow rate, CO2 concentration, and CO2 removal rate, affected the energy demand and techno-economic performances quantitatively. The influence of each parameter on both energy demand and cost showed an obvious non-linear relationship, evidencing the importance of systematic analysis for further study on decarbonization. The evaluation indicated that the regeneration heat required the largest portion of energy demand. The economic analysis showed that the capital cost was more sensitive to the selected parameters than the operational cost, while the operational cost created a major change in the overall cost. In addition, the gas flow rate and CO2 concentration were the main parameters affecting the cost, rather than the CO2 removal rate. Finally, it was suggested that, for a new plant, CO2 capture showed the minimum investment cost per ton CO2 when operating the plant on a large scale, high CO2 concentration, and high CO2 removal rate; for an existing plant, the capture preferred to run with the high CO2 removal rate.
1 Introduction
Anthropogenic emission of CO2 is one of the main causes of global warming. According to the Intergovernmental Panel on Climate Change (IPCC), global anthropogenic emissions of CO2 should be reduced to net-zero by 2050 to avoid a temperature increase of greater than 1.5°C (Masson-Delmotte et al., 2018). The main sources of CO2 emissions are the combustion of fossil fuels and industrial processes, such as the cement industry. To mitigate CO2 emissions, different decarbonization options have been proposed, such as improving energy efficiency, using hydrogen-based energy, replacing fossil fuels with biomass, combining with carbon capture and storage (CCS) processes, etc. Among all these options, the CCS with novel CO2 capture, such as membrane, adsorption with zeolites, absorption with new solvents like ionic liquids, are promising for deployment in the future, but restricted by the low technology readiness level (TRL) in the current. Among the CCS technologies, chemical absorption is the most mature one with the advantages of high stability, capacity, and TRL, and specifically, monoethanolamine (MEA) is the most used solvent in numerous processes because of its excellent capture performance (Li et al., 2013). It is of importance to evaluate the most technology-ready MEA-based CO2 capture process as detailed as possible in case of urgent deployment of CO2 mitigation in a short-term period. Besides, in the long-term period, a solid conclusion of the MEA-based CO2 capture process is necessary to function as the reference for evaluating the newly developed advanced technologies.
Many researchers were focusing on the MEA-based CO2 capture in coal-fired and gas-fired power plants owing to its largest share of anthropogenic CO2 emissions, the effect of the CO2 capture process on the overall plant efficiency and electricity price has been studied, and efforts have been made in order to compensate the plant efficiency as well (Abu-Zahra et al., 2007a; Dave et al., 2011; Duan et al., 2012; Gupta et al., 2015). Later, the research effort was shifted to other industrial sectors, as industrial emissions were considered as another important CO2 source. On the one hand, techno-economic analyses and comparisons have been conducted to assess the feasibility of the MEA-based CO2 capture process in the iron and steel sector and aluminum production (Hassan et al., 2007; Mathisen et al., 2013; Mathisen et al., 2014; Sundqvist et al., 2018; Liu et al., 2019). Another study evaluated the performance of different amine(s)-based solvents at comparably higher CO2 concentrations (Laribi et al., 2019). A configuration study compared various options and proposed ones to further reduce the energy demand of the capture process (Dubois and Thomas, 2018). On the other hand, some researchers have devoted themselves to combining the experimental data with various models and improving the existing capture processes, in order to reduce the investment from research and development to the plant operation (Abu-Zahra et al., 2007a; Li et al., 2014; Li et al., 2016a; Garcia et al., 2017; Moioli and Pellegrini, 2019).
Most of the research mentioned above uses the 30 wt% aqueous MEA solutions as the reference case, i.e., 30 wt% aqueous MEA as the optimal concentration compromised between capture performance and MEA degradation and corrosion. The results from the pilot plant study conducted by Notz et al. also suggested 30 wt% MEA (Notz et al., 2012). While others indicate that the selection of MEA concentration needs to be carefully considered with other parameters, such as CO2 concentration (Gardarsdottir et al., 2015). Arachchige and Melaaen studied the effects of MEA concentration on the removal efficiency and concluded that 22–25 wt% MEA concentration as the optimal region for maximizing the removal efficiency (Arachchige and Melaaen, 2012), while others suggested even higher than 30 wt% MEA (Abu-Zahra et al., 2007b; Li et al., 2016b). Besides, a rapid corrosion rate was observed when using 30 wt% MEA, and prone degradation in the high MEA concentration was also mentioned by Wagner (Wagner, 2006). Replacing carbon steel with stainless steel 316L can only partially moderate the corrosion issue (Fytianos et al., 2016). Additionally, it has been pointed out that 30 wt% MEA can lead to other problems, such as thermal and oxidative degradation, as well as high bulge temperature. However, to the best of our knowledge, no clear and universal conclusion has been drawn regarding the selection of MEA concentration, and the concentration study, especially lower than 30 wt%, is limited and needs to be fulfilled. Another information shortage is that the gas from different industries differs in CO2 concentration, gas flow rate and other conditions, and the CO2 removal rate can be adjusted significantly (Garđarsdóttir et al., 2015; Nguyen and Zondervan, 2018). All the mentioned scenarios may have significant impacts on the selection of optimal MEA concentration when different industries and plants are interested. It is worthy to note that, in many of the research, only the energy demand was used as the key performance indicator for the MEA concentration selection, even though the investment presents a straightforward way of demonstrating how the MEA concentration influences the overall economics in the plant level.
This work is to analyze the effect of MEA concentrations (15–30 wt%) on the performance of the MEA-based CO2 capture process and identify the optimal concentration of MEA on different operation conditions via Aspen Plus simulation. Experimental data of 30 wt% MEA from the literature and new pilot experiments with 20 wt% MEA were provided for model validation. Finally, the energy demands and CAPEX/OPEX of the capture plant were predicted under various CO2 concentrations, gas flow rates, and removal rates.
2 Methodologies
In this work, pilot-scale experiments were carried out for CO2 capture with 20 wt% MEA, as the previous results on the pilot-scale testing were only available for 30 wt% MEA. The experimental set-up and procedures were described in this section. The systematic investigation of CO2 capture was mainly based on process simulations with the commercial software Aspen Plus, the process and the corresponding specifications were described briefly, and the methods for estimating energy demand and cost were summarized.
2.1 Pilot experimental testing
2.1.1 Chemicals and materials
In experiments, the inlet gas containing 12.5 Vol % CO2 was prepared. The gas preparation started with the pressure release from the CO2 gas cylinder (99.9% purity provided by Nanjing special gases Co., Ltd.) to the gas reservoir, and the CO2 was blown into the gas buffer tank, in which the flow rate of CO2 was controlled by the pressure relief valve and flowmeter. Air was blown directly from the atmosphere. The air and CO2 were well mixed and then fed into the absorber at a certain flow rate. The gas composition, temperature, and pressure were measured by Kane KM9106E combustion analyzer (Keison, UK). The 20 wt% aqueous MEA solution was prepared by mixing MEA (Jiaxing Jinyan Chemical Co., Ltd.) and deionized water.
2.1.2 Experimental set-up and specifications
The experimental set-up used for pilot-testing is depicted in Figure 1. Two thermometers (Kangle Instruments Co., Ltd.) were equipped at the top and bottom of absorber and desorber, respectively, to measure the temperature of columns. Similarly, two pressure gauges (XueHu Special Instrument Technology Co., Ltd.) were equipped at the top and bottom of absorber and desorber, respectively, to record the column pressure. The specifications are listed in Table 1. In the absorption-desorption process, CO2 in the gas stream was absorbed by the 20 wt% MEA solution, and then the CO2-rich solvent was preheated by a rich-lean heat exchanger (HEX) and sent to the regeneration column. The regenerated CO2 gas stream was condensed in a condenser to separate water and obtain a 99% CO2 product. The CO2-lean solvent from the reboiler was pumped to the rich-lean heat exchanger to recover the heat. The CO2-lean solvent stream was further cooled and then recirculated to the absorber with a solvent makeup stream to compensate for the solvent loss.
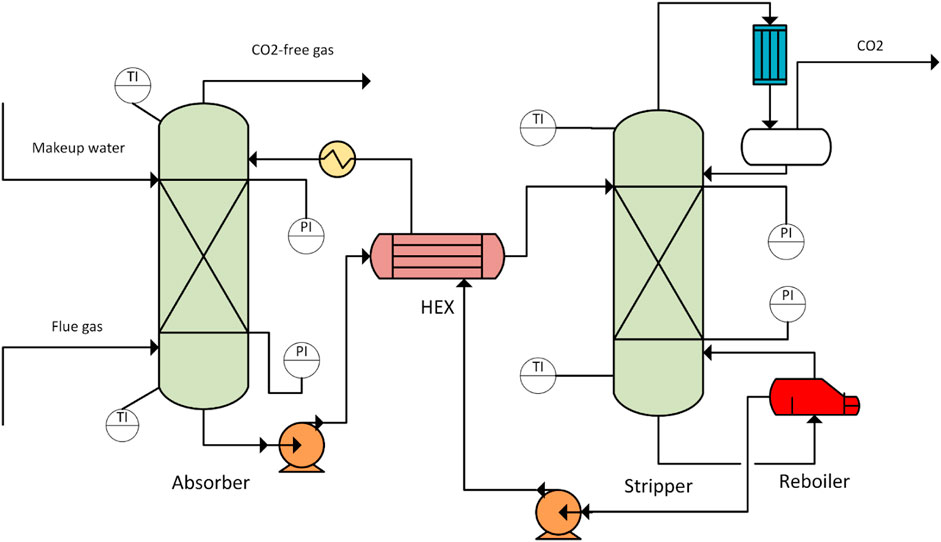
FIGURE 1. Schematic flow diagram of the pilot test with 20 wt% MEA solution.
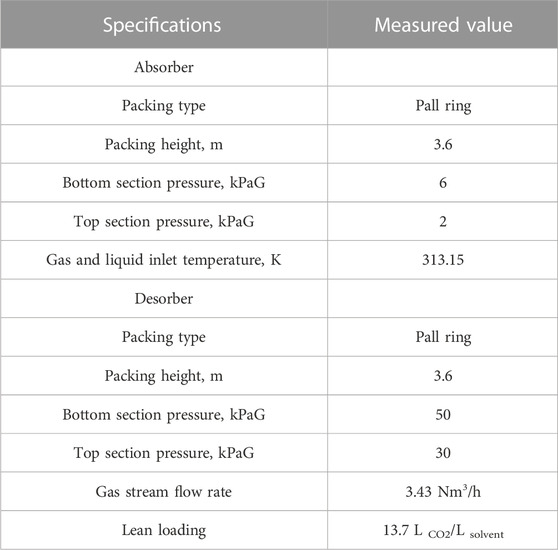
TABLE 1. Experimental specifications of 20 wt% MEA-based CO2 capture process.
2.2 Process and simulation
2.2.1 Process description
In simulations, the MEA-based capture process combined with a CO2 compression unit is shown in Figure 2. The inlet gas travels through a pretreatment unit to cool the gas and reduce the water content. The treated gas is then fed into the absorber, where CO2 is reactively absorbed by the MEA solvent. The CO2-rich solvent exiting the absorber is pumped into the internal heat exchanger, where the CO2-rich solvent is preheated and fed into the regeneration column. The CO2 exiting from the top of the regeneration column then flows into a series of compression units to reach a specific condition for transportation, storage, or utilization. The makeup streams, which contain water and MEA, are added into the recycle stream.

FIGURE 2. Schematic diagram of the MEA-based CO2 capture process in Aspen Plus.
2.2.2 Process specifications
The inlet gas may contain O2, CO2, H2O, N2, CO, H2, and several trace components, such as NOx and SOx. However, to simplify the process, only O2, CO2, H2O, and N2 were considered, and the gas was assumed to contain 2.4 wt% O2, 4.2 wt% H2O, and balanced CO2 and N2 concentrations.
In this study, two gas flow rates were assumed, and the large flow rate was 252.7 ton/hr (i.e., 70.2 kg/s), corresponding to the full capacity of the St. Marys cement plant (Hassan, 2005). The medium gas flow rate was half the large flow rate, representing the capacity of a medium-sized plant. The CO2 concentration of 31.8 wt% is the original data from the St. Marys cement plant, and then the CO2 concentration was further expanded to a range of 10–50 wt% for generalizing the study. The CO2 removal rate was defined as the ratio between the amount of CO2 captured in the process and the total amount of CO2 entered the process. It was set between 65% and 95% to investigate its influence on the energy demand and economy (cost), and values lower than 65% were not included owing to the CO2 capture requirement. These parameters are listed in Table 2. Based on these parameters, 60 cases of various CO2 removal rates, gas flow rates, and CO2 concentrations were created for process simulation. Other process parameters are listed in Table 3.
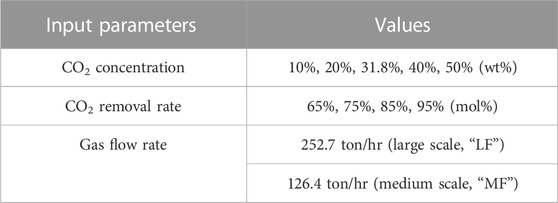
TABLE 2. Input parameters in the process simulation.
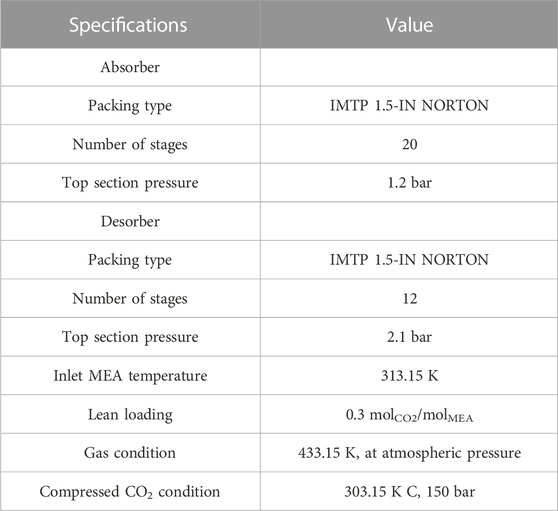
TABLE 3. Initial specifications in the MEA-based CO2 capture process.
2.2.3 Simulation specifications
The process development strategy follows the same principle as the study by Penteado et al. (2016). Both columns were designed with the equilibrium model and then switched to the rate-based model that simultaneously described the mass and heat transfer rate phenomena with equilibrium and kinetic controlled reactions. A design specification was set in the absorber to reach a certain capture target by varying the lean MEA flow rate. The other two design specifications were configured in the desorber: one matched the lean CO2 loading of 0.3 molCO2/molMEA by varying the reboiler duty, and the other ensured that the gas stream exiting the desorber reached 98 mol% CO2 purity by changing the distillate flow rate. The heights for both columns were determined by sensitivity analyses, where the required lean MEA flow rate in the absorber and the minimum reboiler duty in the desorber were calculated.
The recycle stream should be closed in the process simulation to achieve process stability and simulation convergence. However, closing the recycle stream by a blocked connection increases the computing time and could create convergence problems. In addition, the labor becomes more complex when adjusting the operating conditions. Thus, in this study, the method described by Penteado et al. was used to improve the stability and usability of the simulation, i.e., instead of connecting the lean MEA recycle stream with the absorber inlet, a transfer block was used to virtually close the recycle. This was performed using two steps. 1) The design specifications were used to fix the lean loading of the bottom stream from desorber, and 2) a balance block was created to control the flow rates of the makeup streams. These two steps ensured that the recycle stream and lean MEA stream were nearly identical in composition and flow rate. The initial specifications of the process are listed in Table 3. It is worth noting that IMTP 1.5-IN NORTON was chosen in this work because of the following reasons: 1) the surface area of this type of packing is available in the database, and 2) a similar IMTP packing was used in the pilot plant, where the data was used for the validation of process simulation. The comparison with the experimental data using a similar packing will increase the reliability of holdup calculation, leading to credible results.
The simulation results depend on the accuracy of the properties, phase equilibria, mass and heat transfer, and reaction kinetics. Proper models were chosen to calculate the required thermodynamic properties (enthalpy, entropy, Gibbs free energy, and volume) and transport properties (viscosity, thermal conductivity, diffusion coefficient, and surface tension) in the liquid and vapor phases. The thermodynamic and transport properties were extracted from the Aspen Plus database and configured in the component specifications.
The electrolyte non-random two liquid model was used to describe the non-ideal behaviors of the liquid phase, and the Redlich-Kwong equation of state was chosen for the vapor phase to describe the phase equilibria (Liu et al., 1999; Zhang et al., 2009; Zhang and Chen, 2010). Both models have been implemented in Aspen Plus and verified for MEA-based technologies for CO2 capture (Chalmers and Gibbins, 2007; Thiele et al., 2007; Hi et al., 2015). The parameters (pure, binary, and electrolyte-pair) for all the components were maintained as default values, as this simulation was conducted based on the example file used for the MEA-CO2 system.
The widely used reaction mechanism described by Freguia and Rochelle (2003) with three equilibrium reactions and two reversible kinetically controlled reactions was adopted, and the corresponding parameters were obtained from Austgen et al. (1989), Pinsent et al. (1956), and Hikita et al. (1977). The reactions and corresponding kinetic parameters are listed in the Supplementary Table SA).
For the mass and heat transfer calculations, the Onda-68 correlation was selected for the mass transfer coefficient and interfacial area. The Chilton and Colburn correlation was applied to obtain the heat transfer coefficient, and the packing holdups were calculated using the approach by Bravo et al. (1992).
2.3 Energy demand and economic analyses
The energy calculation in this study consisted of two scenarios: the energy demand of the process with and without a compression unit. Energy demands in the MEA-based CO2 capture process are: 1) the heating duty of the reboiler for solvent regeneration and the heaters; 2) the electric power required for the blower, pumps, and CO2 compressor; and 3) the cooling duty of the condenser for solvent regeneration and the coolers. The energy demand mentioned above was estimated in energy power and then converted into cost with the energy prices listed in Table 4 for discussion and comparison.
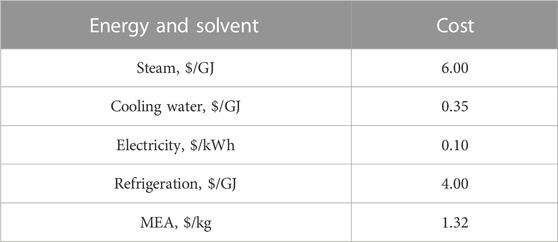
TABLE 4. Utilities and solvent prices.
An economic analysis was conducted with the Aspen Process Economic Analyzer (APEA) based on the industry-standard Icarus System (Aspen, 2010). Figure 3 shows the procedures of economic analysis in the APEA. The APEA is an equipment-based approach to estimate the economy. It maps and sizes the equipment to create a volumetric model, which is used to estimate the total installed cost. With other input parameters used in the APEA, the template defines the equipment-based parameters required in the analysis. It also defines the currencies and interest rates for the cost calculation, and the investment options offer the plant life setting and operating hours that could be used for quantitatively calculating the operational cost. The stream and utility prices assist the material and energy cost processes. With this information, the cost can be evaluated and generated (e.g., equipment and utilities).
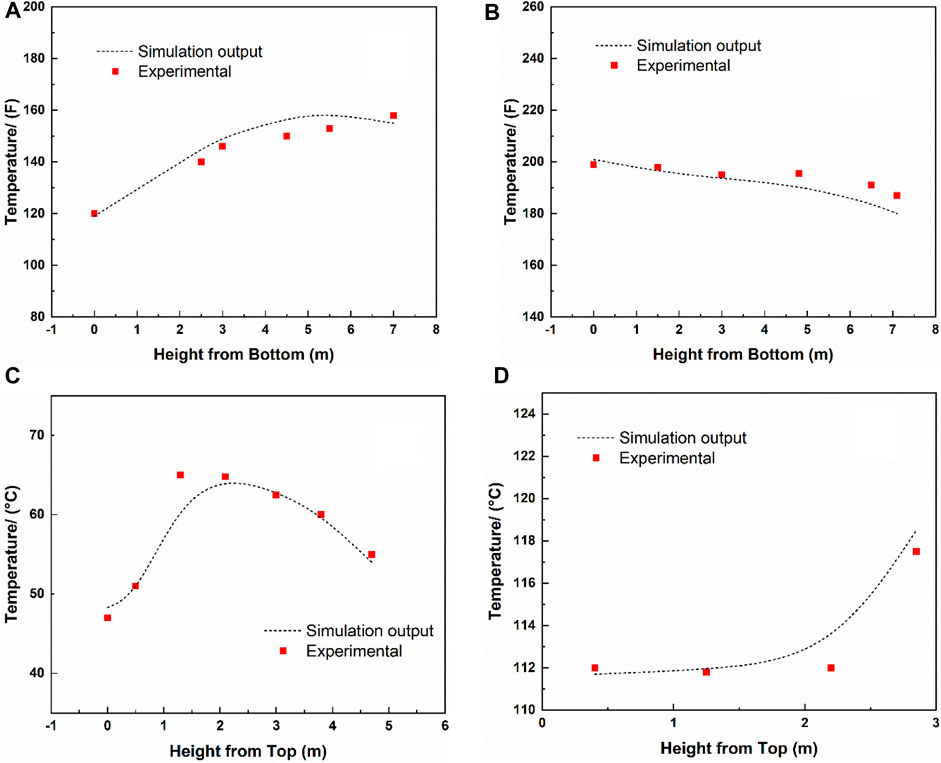
FIGURE 3. The liquid temperature profiles as simulation outputs and pilot plant experimental data. (A) absorber and (B) desorber of the pilot plant at the University of Texas at Austin, (C) absorber and (D) desorber of the pilot plant at the University of Kaiserslautern.
The annualized total cost (ATC) was calculated as a sum of the operational cost (OPEX) and capital investment cost (CAPEX). ATC was estimated using Eq. 1.
where CAPEX is the total cost of the plant, which consists of the direct and indirect costs, i.e., the total installed cost, contracts, contingencies, overheads, and other costs; OPEX is the summation cost of the raw material, utility, operating labor, maintenance, operating charges, plant overhead, and general and administrative cost; i is the interest rate, and N is the operating life of the plant. In this study, i was set to 10%; N was set to 25 years, and the plant operating time was assumed to be 8,700 h per year (Biegler et al., 1997). Other parameters used for the CAPEX and OPEX calculations were set to the default values. Table 4 lists the utilities and solvent prices used in the OPEX calculation (Eurostat, 2016; Jakobsen et al., 2017).
3 Results and discussion
In this study, pilot-testing was conducted, proving new experimental results. The process was configurated in Aspen Plus with the initial specifications listed in Table 3, and the simulation was validated with the practical data using both 20 and 30 wt% MEA solvent. Then the effect of MEA concentrations on the process performance was investigated, and optimal MEA concentration was determined. Afterward, a systematic study was conducted based on process simulation, where the effects of MEA concentration, along with selected parameters, on the energy and cost results were analyzed individually and interactively.
3.1 Experimental results and simulation validations
3.1.1 New experimental results for 20 wt% aqueous MEA and the corresponding model validation
Using the experimental set-up described in Figure 1, the key experimental results of CO2 capture, i.e., CO2 removal rate, desorber bottom section temperature, and gas-to-liquid ratio, with 20 wt% MEA are listed in Table 5. This is the first time to report the data with 20 wt% MEA, and no comparison with other available data can be conducted.
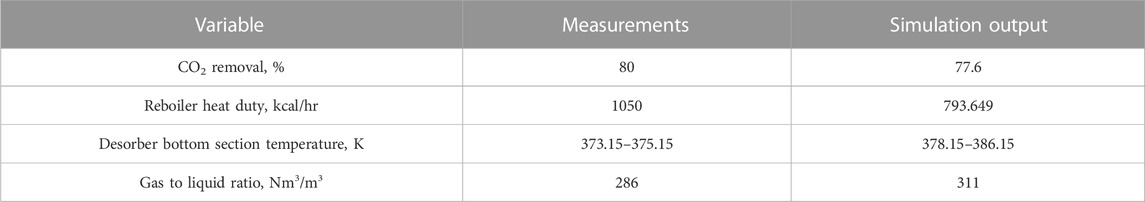
TABLE 5. Key experimental and simulation results for validation of 20 wt% MEA solvent.
The newly determined experimental results were used to validate the process simulation results, where the simulations were performed under the same conditions used at the real pilot plants. As shown in Table 5, a comparable simulation output proved a reliable process model in our study with 20 wt% MEA solvent. However, due to the undesirable insulation on the regeneration column, the reboiler heating duty recorded in the experiment was higher than the simulation results but still in an acceptable range if the heat loss was considered.
3.1.2 Validation of simulation with 30 wt% aqueous MEA pilot plants results
In 3.1.1, the simulation results were validated with 20 wt% aqueous MEA. Moreover, the experimental results with 30 wt% MEA solutions taken from the pilot plants at the University of Texas at Austin and the University of Kaiserslautern (Dugas, 2006; Notz et al., 2012) were used for further validation.
For 30 wt% MEA, again, the simulations were conducted under the same conditions used at the real pilot plants. The comparison results are listed in Table 6 and depicted in Figure 3, showing that good agreements were obtained between the simulation output and experimental data. The minor difference in the reboiler heating duty from that in the pilot plant data at the University of Texas at Austin can be explained by the re-absorption in the desorber, which was also reported by Zhang et al. (2009).
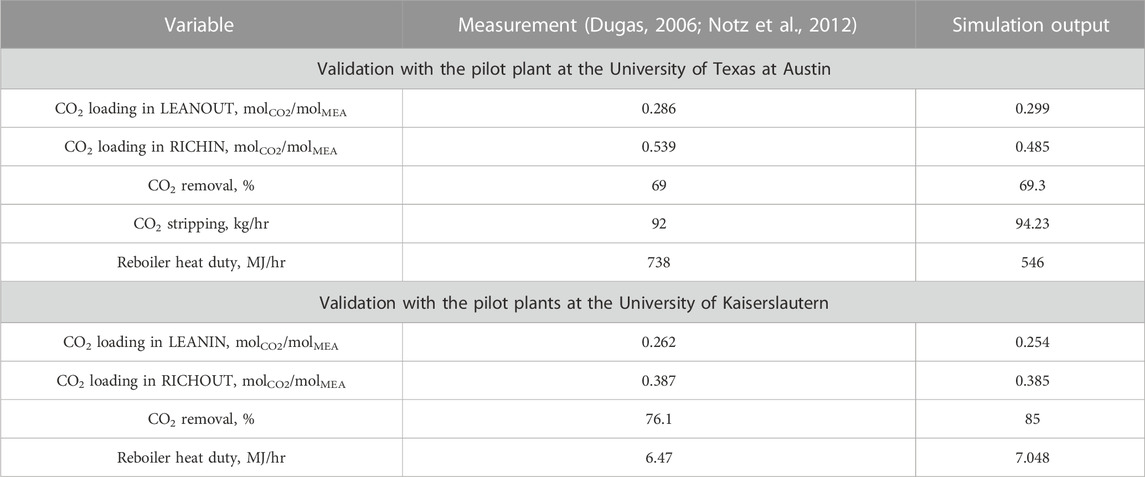
TABLE 6. Simulation and experimental results for 30 wt% MEA solvent.
3.2 The effect of MEA concentrations under different selected parameters
For the MEA-based technologies for CO2 capture, 30 wt% MEA is often used in academic research, while a lower concentration of MEA solution is widely used in industrial applications. To further study the CO2 capture performance with different MEA concentrations, solvents with 15–30 wt% MEA were selected to simulate the capture process with fixed inlet gas and lean loading, and the solvent flow rate was adjusted to obtain a 95% CO2 removal rate. The effects of lean loading on reboiler duty were studied by Hassan et al., concluding that the minimum reboiler duty was achieved when the lean loading achieved around 0.3 molCO2/molMEA (Abu-Zahra et al., 2007b; Hassan et al., 2007). Therefore, in this study, a fixed lean loading of 0.3 molCO2/molMEA was used to simplify the study, and more efforts were devoted to the influence of selected parameters.
Figure 4 shows that, by decreasing the MEA concentration from 30 wt%, through 25 and 20 until 15 wt%, the bulge temperature decreased from 358.15 to 328.15 K, creating a better absorption performance because the lower temperature promotes the exothermic absorption for CO2. However, it is not exactly the same story when discussing the MEA concentration regarding the reboiler duty and investment cost. The specific heat requirement and cost estimation were calculated based on these four MEA concentrations and all the combinations of selected parameters. Only the cases with boundaries of the selected parameters were discussed.
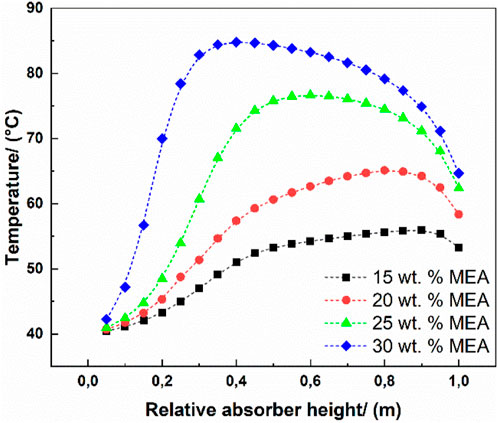
FIGURE 4. Temperature profile and bulge temperature in the absorber.
3.2.1 The effect of removal rate
The lower and upper boundaries of removal rate were selected to illustrate the effects of MEA concentration and removal rate on specific energy demand and capture cost with fixed gas flow rate (large scale) and CO2 concentration (31.8 wt% CO2 concentration). As we can conclude from Figure 5, no considerable effect of removal rate is observed even if the removal rate increases from 65% to 95%. However, the specific heat requirement as well as the costs are sharply decreasing with increasing MEA concentration from 15% to 20%, and then a slight decrease and increase are observed with increasing the MEA concentration from 20% to 25% and from 25% to 30%. It can be explained that when using too low MEA concentration (e.g., 15 wt% MEA), it will lead to a large solvent flow rate and thus expand the equipment dimension and higher CAPEX. The heat demand required for heating up the solvent is also high, resulting in a sharp increase in OPEX. When increasing the MEA concentration into 20–25 wt%, a lower solvent flow rate could reach the fixed capture target and lower the heat requirement compared to that of 15 wt% MEA case. The higher bulge temperature in the absorber is insignificant compared with enhancement due to the decrease in solvent flow rate. When a high MEA concentration (30 wt% MEA) is used, a lesser solvent flow rate is required. However, the bulge temperature is too high to maintain the desired CO2 solubility, again resulting in a larger solvent flow rate for compensating the solubility losses. Even though the solvent flow rate is still less than that for the case with a lower MEA concentration, the heat duty is a bit higher and not optimal in this case.
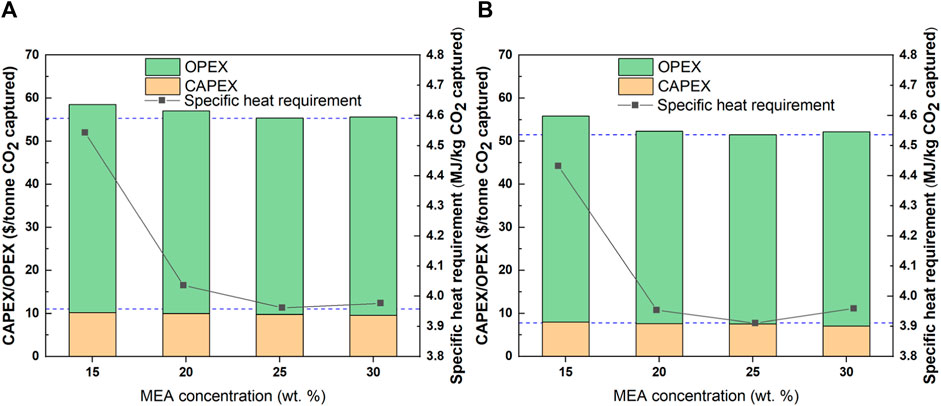
FIGURE 5. Influence of MEA concentration on investment cost and specific heat requirement. (A): 65% removal rate; (B): 95% removal rate.
3.2.2 The effect of CO2 concentration
Similar to the evaluation of removal rate, the boundary value of CO2 concentration, 10 and 50 wt% were selected to study the effect of MEA concentration under different CO2 concentrations, as depicted in Figure 6. When the CO2 concentrations were set at a 10 and 50 wt%, the lowest specific energy demands were reached for the solvent with 25 wt% and 20 wt% MEA concentrations, respectively. This is highly related to the CO2 concentration. When using 30 wt% MEA with 10 wt% CO2 concentration, the higher bulge temperature is avoided, leading to an insignificant difference between 25 and 30 wt% MEA. However, when using 30 wt% MEA with 50 wt% CO2 concentration, the high bulge temperature is promoted, resulting in an obviously increased specific energy demand compared with the case of 25 wt% of MEA.
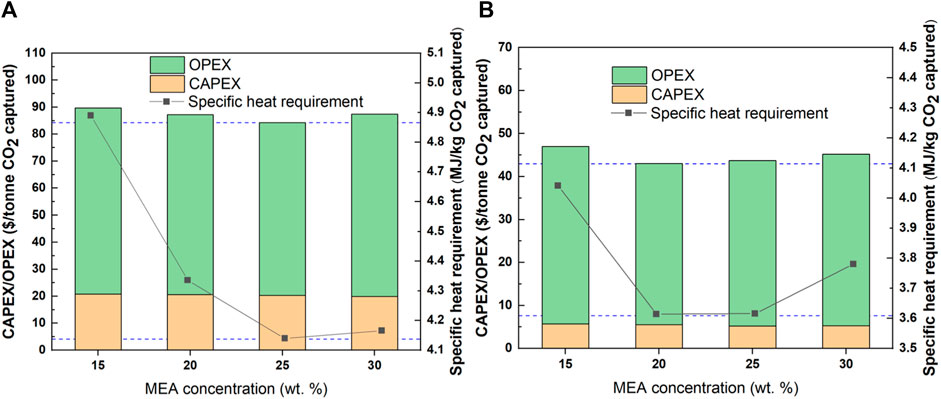
FIGURE 6. Influence of MEA concentration on investment cost and specific heat requirement. (A): 10 wt% CO2 concentration; (B): 50 wt% CO2 concentration.
Moreover, the lowest investment costs were reached for the solvent with 25 wt% and 20 wt% MEA concentration when using 10 and 50 wt% CO2 concentrations, respectively. The conclusions above indicate the significant effects of CO2 concentration on both energy demand and investment cost. Therefore, the solvent concentration should be carefully considered with CO2 concentrations.
We can conclude that the MEA concentration of 20–25 wt% is the optimum range in our study instead of 30 wt% MEA, and a concentration lower than 20 wt% will significantly increase the reboiler duty. Besides, other researchers also drew a similar conclusion when the study methods are customized; Garđarsdóttir et al. (2015) also studied the solvent concentration effect on the temperature profiles and heat duty that lower concentrations of MEA could benefit the bulge temperature in absorber and reboiler heat duty, especially under low CO2 concentration condition. In addition, the pilot testing also supports that the MEA concentration lower than 30 wt% requires lower stripping steam in the regeneration process (Notz et al., 2012). Furthermore, a lower MEA concentration solvent benefits a lower degradation and corrosion rates, and reduces the equipment, maintenance, and solvent costs. Based on all the analyses in this section, 20 wt% MEA solvent was selected for further study in this work.
3.3 Systematic analysis of energy demand and cost with 20 wt% MEA
In this section, a systematic analysis of energy demand and cost with 20 wt% MEA was discussed. It is worth mentioning that the ranges of the values for the defined parameters, i.e., gas flow rate, CO2 concentration, and CO2 removal rate, were adopted from Table 2.
3.3.1 Energy demand analysis
First, the energy demand and variance with the studied parameters were evaluated for the process with and without the compression unit. The heating duty, cooling duty, and electric power were analyzed to identify the energy-intensive units, and then the effect of the parameters on these units was quantitatively evaluated. In this section, a number of examples are illustrated to represent the effects of parameters, and other cases have shown the same trend as the cases presented in the following sections.
Figure 7 shows the results of specific energy power for different cases as well as with and without the compression unit. The specific energy power in the high CO2 concentration cases was lower than that in the low CO2 concentration cases. For example, with a 65% CO2 removal rate, the heating duty was 0.14 kW/ton-CO2 for 10 wt% CO2 concentration, while it was 0.105 kW/ton-CO2 for 50 wt% CO2 concentration. Thus, the specific energy power decreased with increasing CO2 concentration. In addition, the energy power decreased with increasing CO2 removal rate, except for the cooling duty. For the cases with the compression unit, the cooling duty showed a fluctuation with increasing CO2 removal rate owing to the design of the multistage compressors. The CO2 streams contained different volumetric flow rates and temperatures, requiring various compressor setups (outlet pressure and temperature in each stage) and different cooler sizes in each stage, and influencing the overall process cooling duty.
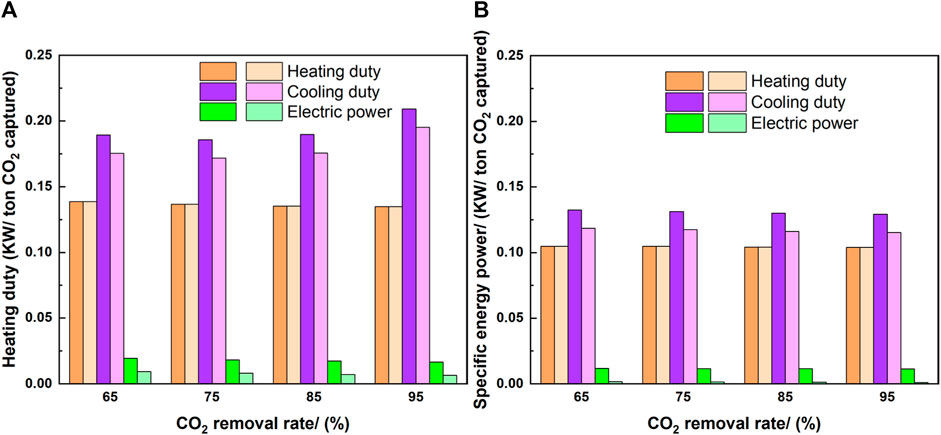
FIGURE 7. Specific energy power per ton-CO2 captured. Darker color: with compression, lighter color: without compression [(A): 10 wt% CO2 case, (B): 50 wt% CO2 case].
The specific energy powers include cooling, heating, and electric power. The cooling duty, which is used in pre-stage cooling and the condenser in the desorber, requires the largest percentage of energy power. There was no difference between the heating duty with and without the compression unit, because the heating duty was only owing to the reboiler. The value of electric power was lower than the other two energy powers, especially without the compression unit. The significant difference between the electric powers with and without the compressors indicates that the compressors are the main electricity requirement. The summation of heating and cooling duty accounts for the most part of the energy power required in the process, indicating that consideration of waste heating and cooling management might be interesting.
Figure 8 shows the variations of the total energy cost with the considered parameters as well as with and without the compression unit, where the observations are different from those in Figure 7. The different results observed from Figure 7 and Figure 8 highlight the importance of energy price in analyzing the economics rather than the energy demand. In contrast to Figure 7, the cost of cooling energy in Figure 8 is insignificant compared to the overall energy cost. Moreover, the energy cost without the compression unit showed at least a 20% cost reduction from that with the compression unit; therefore, the compression unit played a significant role in the energy demand. In addition, the total energy cost slightly decreased with increasing CO2 removal rate in each case; however, the reduction was large for increasing CO2 concentration. For instance, for 10 wt% CO2 with the increased CO2 removal rate, the reductions were 7.3% (with compression) and 7.5% (without compression), while the cost reductions owing to the increased CO2 concentration were 26.4%–30.4% and 33.7%–37.9%, respectively.
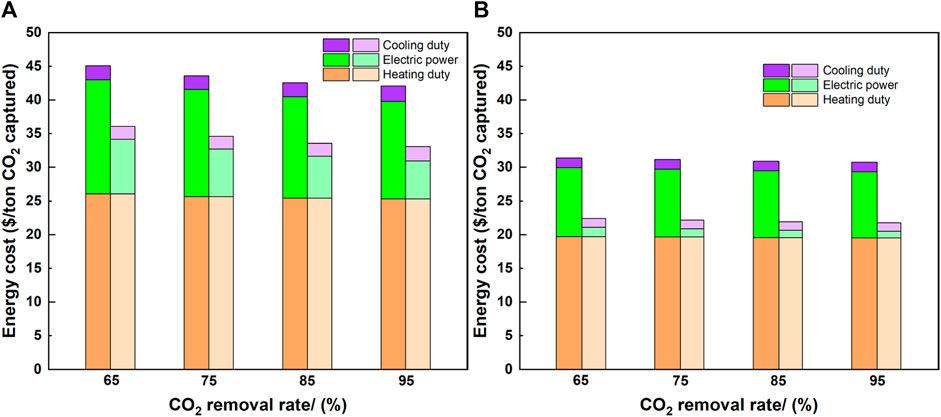
FIGURE 8. Heating, cooling, and electricity cost in the MEA based CO2 capture process. Darker color: with compression, lighter color: without compression. [(A): 10 wt% CO2 case, (B): 50 wt% CO2 case].
Figure 8 also shows the energy costs of heating duty, cooling duty, and electric power. The heating duty, which is owing to the reboiler, accounts for 50% of the total energy cost in each case. For 10 and 50 wt% CO2, the cost of the heating duty was slightly reduced: 2.7% and 1% with the increased CO2 removal rate, while increasing the CO2 concentration from 10 to 50 wt% created a 23%–24.4% reduction. Therefore, the CO2 concentration had a larger effect on the cost reduction of the heating duty than that of the CO2 removal rate. Large cost reductions in electric power were observed by removing the compression unit. For 10 wt% CO2 concentration, 52% and 62% reductions were observed for the 65% and 95% CO2 removal rates, respectively. These numbers were larger for 50 wt% CO2 concentration: 86% and 87% reductions for the 65% and 95% CO2 removal rates, respectively. When the CO2 concentration increased from 10 to 50 wt%, the additional electric power for the gas blower and solvent pumps was smaller than the reduction of the electric power for the compression unit. Therefore, the compression unit dominated the overall electric demand, especially for high CO2 concentrations.
The effect of the CO2 concentration and CO2 removal rate on the electric power was further evaluated for the cases with and without the compression unit. For the cases with a compression unit, when increasing the CO2 removal rate from 65% to 95%, 14.9% and 4% cost reductions were observed in the 10 and 50 wt% CO2 cases, respectively. However, the effect of the CO2 concentration achieved 31.9%–39.5% cost reductions when increasing the CO2 concentration from 10 to 50 wt% for the CO2 removal rates ranging from 65% to 95%. For the cases without the compression unit, when increasing the CO2 removal rate from 65% to 95%, 30.9% and 30.3% cost reductions were observed in the 10 and 50 wt% CO2 cases, while the CO2 concentration showed a larger effect than that of the CO2 removal rate: 82.3%–82.5% cost reductions when increasing the CO2 concentration from 10 to 50 wt% with the CO2 removal rates of 65%–95%. In both scenarios, the CO2 concentration had a larger impact than that of the CO2 removal rate on the cost reductions in the electric power. The cooling duty represented a small percentage of the energy cost, and the absence of a compression unit showed a minimal effect. In addition, the percentages of heating, electricity, and cooling costs to the total costs were plotted in cheese portion diagrams in the Supplementary Figure S1 to visually demonstrate the energy cost percentages when changing the defined parameters.
3.3.2 Techno-economic analysis
The energy analysis is related to the operational cost. For the entire plant, the investment cost is another important concern. In this section, the effects of individual and multiple parameters on CAPEX, OPEX, and total cost were discussed. In addition, the estimated costs for the MEA-based CO2 capture plant for all cases were summarized and plotted in a single figure, where CAPEX and OPEX are shown for the combinations of considered parameters. Beforehand, the sensitivity analysis of the impact of utility cost on total cost was conducted. The results are shown in the Supplementary Figure S2. The utility costs were varied for 50%, 75%, 125%, and 150% of its original cost adopted from Table 4. Four sets of cases, i.e., large/medium flow fate with 65%/95% CO2 removal rate, were selected to represent how the variations of these utility prices affect the calculated costs. The results showed that the heating cost affected the total cost in the most effective way rather than the electricity cost, and the cooling cost only slightly changed the total cost. For example, in the case of large flow fate with 65% CO2 removal rate, 50% increase in heating cost caused 12.9% increase in the total cost, while 50% increase in electricity and cooling costs led to 8.4% and 1% increases in the total cost, respectively.
3.3.2.1 Influence of CO2 removal rate on the CAPEX and OPEX
Figure 9 shows the influence of the CO2 removal rate on the CAPEX and OPEX per ton CO2. The case with 10 wt% CO2 concentration was used as one example. A larger removal rate provided a lower CAPEX per ton CO2. However, the total CAPEX increased with increasing CO2 removal rate, even though the CAPEX per ton CO2 decreased. This was because of the lower increment of CAPEX than that with the extra amount of CO2 captured. For OPEX, it decreased with increasing CO2 removal rate, and its value was approximately 3 times that of CAPEX. Therefore, OPEX dominated the total cost in the MEA-based CO2 capture process. In the large flow rate cases, the CAPEX per ton CO2 decreased from $26.9 to 21.08, corresponding to a 21.6% reduction, while only a 9.4% reduction was observed for the OPEX per ton of CO2. Therefore, CAPEX was more sensitive than OPEX to the increase in the CO2 removal rate.
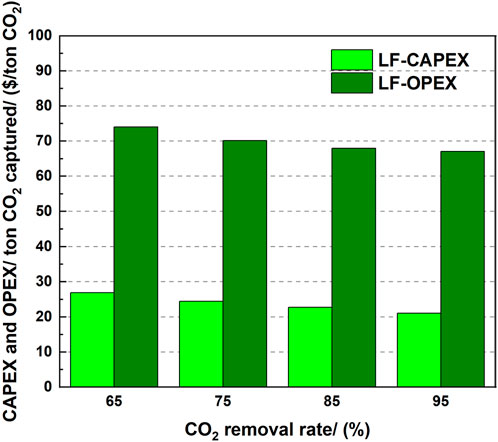
FIGURE 9. Effect of the CO2 removal rate on the CAPEX and OPEX per ton CO2 captured (10 wt% CO2 concentration).
3.3.2.2 Influence of the gas flow rate on the CAPEX and OPEX
Figure 10 shows the influence of the gas flow rate on the CAPEX and OPEX per ton CO2 for a 65% CO2 removal rate. When fixing the CO2 removal rate and comparing the CAPEX for the cases with different gas flow rates, the cases with a larger gas flow rate provided a lower CAPEX per ton CO2. The doubled gas flow rate provided twice the amount of CO2 gas flow; however, CAPEX was not linearly doubled, leading to a CAPEX reduction. For OPEX, when the gas flow rate was doubled from medium flow to large flow, OPEX decreased from $44.81 to 40.69 (9.1% reduction). Meanwhile, the CAPEX reduction reached approximately 25%, from $8.87 to 6.57.
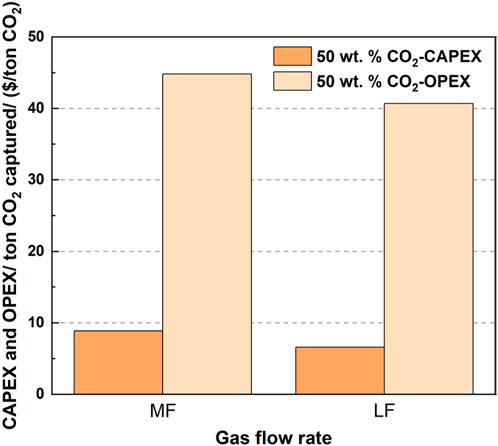
FIGURE 10. Effect of the gas flow rate on the CAPEX and OPEX per ton CO2 (65% CO2 removal rate).
3.3.2.3 Influence of the CO2 concentration on the CAPEX and OPEX
Figure 11 shows the influence of the CO2 concentration on the CAPEX and OPEX per ton CO2. The cases with a medium flow rate are listed as examples. When fixing the gas flow rate and comparing the cases with different CO2 concentrations, the higher CO2 concentration created a lower CAPEX per ton CO2. The amount of captured CO2 increased with increasing CO2 concentration, thus increasing the solvent flow as well as the equipment size and cost. However, the total volume of the gas stream was fixed, and the increase of CAPEX owing to the increased solvent flow and increased CO2 gas flow was small compared to the extra amount of captured CO2 owing to the increased CO2 concentration. In addition, the increased cost of the compressors was caused by the increased amount of captured CO2 exiting the desorber.
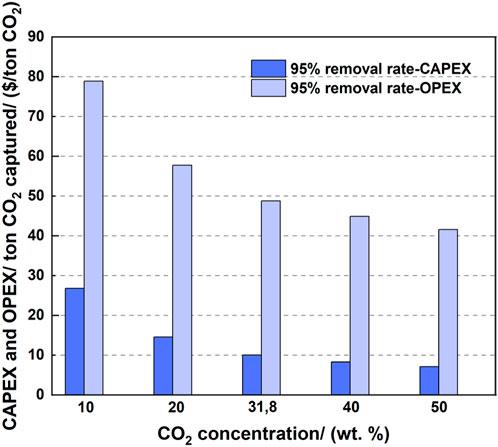
FIGURE 11. Effect of the CO2 concentration on the CAPEX and OPEX (medium flow rate).
OPEX decreased with increasing CO2 concentration. A sharp reduction of OPEX was obtained when the CO2 concentration increased from a low value. For example, the increase of the CO2 concentration from 10 to 20 wt% provided a sharp reduction in OPEX from $78.92 to 57.75 (a reduction of 26.8%). However, a further reduction in OPEX was slower, resulting in $41.59 at 50% CO2 concentration.
Combining the results from Figures 9, 10, based on the cases of large flow, 65% CO2 removal rate, and increasing CO2 concentration from 10 to 50 wt%, a 75.6% CAPEX reduction was observed, i.e., from $26.9 to 6.57, while OPEX decreased from $74.03 to 40.69, i.e., 45% reduction.
When combining the results from Figures 10, 11, based on the cases of medium flow, 50 wt% CO2 concentration, with an increasing CO2 removal rate from 65% to 95%, a 19.7% CAPEX reduction was observed, i.e., from $8.87 to 7.12, while OPEX decreased from $44.81 to 41.59, i.e., 7.2% reduction.
From Figures 9, 11, for a 95% CO2 removal rate, 10 wt% CO2 concentration showed a 66.2% CAPEX reduction by increasing the gas flow rate from medium to large scales, i.e., $21.08 to 7.12, while OPEX decreased from $67.09 to 41.59, i.e., 38% reduction.
The individual and multiple parameter studies revealed that CAPEX was more sensitive to the considered parameters than that of OPEX in percentage. However, the absolute value of OPEX was larger than that of CAPEX, and thus, OPEX accounted for a greater proportion of the total investment cost. The next section discussed the OPEX percentage change with parameter variations.
3.3.2.4 Change in the OPEX percentage with parameter variations
Figure 12 shows the OPEX percentage with respect to the total cost. When the CO2 concentration increased from 10 to 50 wt%, the OPEX percentage increased. When the CO2 removal rate and gas flow rate were fixed, the increased CO2 concentration required more CO2 to be treated to achieve the same removal rate, and more power and heat were required to achieve the capture task. Meanwhile, the equipment size would not change owing to the fixed gas flow rate, as the gas flow rate is the decisive factor for sizing the equipment. In addition, the increased rate of OPEX decreased with increasing CO2 concentration; thus, OPEX was more sensitive at a low CO2 concentration.
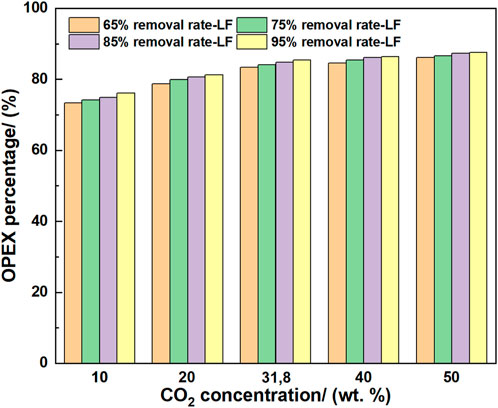
FIGURE 12. OPEX percentage variations.
When fixing the CO2 concentration, the increased CO2 removal rate from 65% to 95% increased the OPEX percentage. When the capture requirement increased, the solvent flow rate and regeneration energy increased, leading to a high OPEX percentage. However, the increase of OPEX percentage became slow at a high CO2 removal rate; therefore, the OPEX was more sensitive at the low CO2 removal rate.
3.4 Overall economic analysis results
CAPEX, OPEX, and total cost of all the studied cases (all combinations of gas flow rates, CO2 concentrations, and CO2 removal rates) are shown in Figure 13. CAPEX and OPEX decreased with 1) increasing CO2 concentration, 2) increasing CO2 removal rate, and 3) increasing gas flow rate. The individual evaluation of each parameter on cost indicated that all three parameters had a larger impact on CAPEX than that of OPEX proportionally. However, OPEX dominated the total cost owing to its larger absolute value (approximately three times that of CAPEX). Consequently, if the percentage change is smaller in OPEX than in CAPEX, the change in the total investment cost (in $) is larger in OPEX than in CAPEX. Additionally, non-linear relationships between the defined parameters and CAPEX, OPEX, and total cost were observed in Figure 13. This non-linearity can be attributed to the effect of sole parameter (i.e., CO2 removal rate affects the sizes/costs of absorber and desorber) and/or multiple parameters (i.e., gas flow rate and CO2 concentration collectively affect the size of absorber and the electric power demand), making it necessary and meaningful to conduct further detailed systematic study and analysis to quantitatively identify the reasons behind these observations.
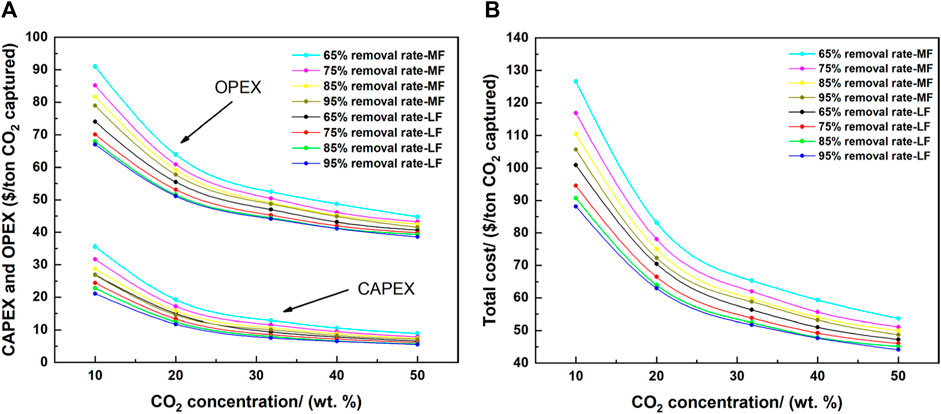
FIGURE 13. Annualized (A) CAPEX and OPEX, and (B) annualized total investment cost.
3.5 Further discussions on the practical implementation
Based on the overall economic analysis, suggestions were provided for the CO2 capture plant in an industry based on a new or existing plant.
As summarized in Section 3.4, the total cost decreased with increasing the values of parameters. In order to reach the optimal economic situation, a newly designed plant should be operated with a high gas flow rate, the CO2 concentration should be as high as possible, and the capture plant should aim for the highest CO2 removal rate.
For adding a CO2 capture process to an existing plant, the most effective method to decrease the cost of CO2 capture is to increase the CO2 concentration, especially for plants with low CO2 concentrations. When the CO2 concentration increased from 10 to 20 wt%, the total investment cost decreased from $126.56 to 83.17 (i.e., 34.3% reduction) for the case with a 65% removal rate, medium flow, and 10 wt% CO2. However, this method required a large modification of the production process, which could be expensive. In addition, increasing the gas flow rate could reduce the investment cost, and thus, a fully operational plant is preferred for the capture plant economy. Finally, the highest CO2 removal rate should be used, without significantly influencing the plant operation. Although the effectiveness of increasing the CO2 removal rate was lower than that of the other two factors, the efficiency of increasing CO2 removal rate showed greater potential in a lower CO2 removal rate range.
4 Conclusion
The MEA-based CO2 capture process was studied systematically, including experimental measurements and process simulations with different MEA-concentrations and parameters, with and without the compression unit. The comparison of the simulations with the newly measured experimental data and those from the real pilot plants ensured reliable simulations, and 20 wt% MEA solution was identified as the optimal concentration. The energy evaluation results revealed that the cooling duty required the largest energy power; however, the heating duty accounted for the largest energy demand based on the energy price. The heating duty contributed to more than 50% of the total energy cost in all cases, regardless of the presence of the compression unit. In addition, the compression unit used more than half of the required electric power, especially for the large CO2 concentration cases.
The qualitative evaluation and comparison of the effect of each parameter on cost indicated that the CO2 concentration and gas flow rate had larger influences than that of the CO2 removal rate. Since the extent of influence for each defined parameter was difficult to measure and compare, in other words, the parameters were at different dimensions, i.e., gas flow rate in ton/hr, CO2 concentration in weight percentage; the CO2 concentration ranging from 10 to 50 wt% while the CO2 removal rate being ≥65% owing to the CO2 capture requirements, it is impossible to conduct quantitative analysis. However, the cost variance trends with the studied parameters were established, and the results provided an optimal solution for process modification. In addition, the CAPEX percentage was more sensitive to all the studied parameters than that of OPEX; however, the study showed that OPEX dominated the total investment costs owing to its larger absolute value (approximately 3 times of CAPEX). Therefore, a small percentage change in OPEX affected the total investment cost more than that in CAPEX.
Suggestions were provided for the capture plant of new and existing plants based on the impact of the studied parameters (CO2 concentration, gas flow rate, and CO2 removal rate). From the overall economic analysis plot, the capture plant for a new plant should be designed to process a fully operational plant, where the flow rate, CO2 concentration, and CO2 removal rate are as high as possible. For an existing plant, although increasing the CO2 concentration and gas flow rate were effective methods for improving the economy, running the capture plant with the highest CO2 removal rate reduced the total investment cost.
This systematic techno-economic analysis with the MEA-based CO2 capture process in the industry provided valuable energy and economic data under various parameters, and thus further comparison could be performed with other commercially or newly developed solvents. MEA aqueous solvent is the benchmark solvent in the CO2 capture area, owing to its high thermal stability, excellent CO2 capacity, low cost in the solvent price, and easy process operation. However, high thermal regeneration energy demand and the critical problem with high MEA concentration also limit the application. Therefore, a great interest should be in the techno-economic comparison between the MEA-based solvent and other commercially or newly developed solvents, such as advanced amines with great potential and competitivity in terms of amine concentration and regeneration energy demand; ionic liquids with potentials in the concepts of green solvent and designability, where the data provided in this work can be widely used. Furthermore, the generated energy and cost data for carbon capture technologies can also be used in a long-term energy system optimization model to assess the transition to a carbon-neutral industry. For example, the energy system model describes the material and energy flows for analyzing synergies and obstacles in transitioning to a climate-neutral society, where collective data from various industrial sectors, including material and energy flows as well as the carbon footprints, are required.
Data availability statement
The original contributions presented in the study are included in the article/Supplementary Material, further inquiries can be directed to the corresponding authors.
Author contributions
NW: Conceptualization, Investigation, Methodology, Validation, Writing–original draft, Writing, review and editing. DW: Investigation, review, and editing. AK-R: Supervision, Writing, review and editing. XJ: Conceptualization, Supervision, Writing–original draft, Writing, review and editing. All authors contributed to the article and approved the submitted version.
Funding
This work was supported by the Swedish Energy Agency (grant number: P44678-1) and the Joint Research Fund for Overseas Chinese Scholars and Scholars in Hong Kong and Macao Young Scholars (No. 21729601).
Conflict of interest
Author DW was employed by the company Sinopec Nanjing Chemical Research Institute.
The remaining authors declare that the research was conducted in the absence of any commercial or financial relationships that could be construed as a potential conflict of interest.
Publisher’s note
All claims expressed in this article are solely those of the authors and do not necessarily represent those of their affiliated organizations, or those of the publisher, the editors and the reviewers. Any product that may be evaluated in this article, or claim that may be made by its manufacturer, is not guaranteed or endorsed by the publisher.
Supplementary material
The Supplementary Material for this article can be found online at: https://www.frontiersin.org/articles/10.3389/fenrg.2023.1230743/full#supplementary-material
References
Abu-Zahra, M. R., Niederer, J. P., Feron, P. H., and Versteeg, G. F. (2007a). CO2 capture from power plants: part II. A parametric study of the economical performance based on mono-ethanolamine. Int. J. Greenh. gas control 1, 135–142. doi:10.1016/s1750-5836(07)00032-1
Abu-Zahra, M. R. M., Schneiders, L. H. J., Niederer, J. P. M., Feron, P. H. M., and Versteeg, G. F. (2007b). CO2 capture from power plants. Part I. A parametric study of the technical-performance based on monoethanolamine. Int. J. Greenh. Gas Control 1, 37–46. doi:10.1016/s1750-5836(06)00007-7
Arachchige, U. S. P. R., and Melaaen, M. C. (2012). Aspen plus simulation of CO2 removal from coal and gas fired power plants. Enrgy Proced. 23, 391–399. doi:10.1016/j.egypro.2012.06.060
Austgen, D. M., Rochelle, G. T., Peng, X., and Chen, C. C. (1989). Model of vapor-liquid equilibria for aqueous acid gas-alkanolamine systems using the electrolyte-NRTL equation. Industrial Eng. Chem. Res. 28, 1060–1073. doi:10.1021/ie00091a028
Biegler, L. T., Grossmann, I. E., and Westerberg, A. W. (1997). Systematic methods for chemical process design. Prentice Hall PTR.
Bravo, J., Rocha, J., and Fair, J. (1992). “A comprehensive model for the performance of columns containing structured packings,” in Institution of chemical engineers symposium series (HEMSPHERE PUBLISHING CORPORATION), A489.
Chalmers, H., and Gibbins, J. (2007). Initial evaluation of the impact of post-combustion capture of carbon dioxide on supercritical pulverised coal power plant part load performance. Fuel 86, 2109–2123. doi:10.1016/j.fuel.2007.01.028
Dave, N., Do, T., Palfreyman, D., and Feron, P. (2011). Impact of post combustion capture of CO2 on existing and new Australian coal-fired power plants. Energy Procedia 4, 2005–2019. doi:10.1016/j.egypro.2011.02.082
Duan, L., Zhao, M., and Yang, Y. (2012). Integration and optimization study on the coal-fired power plant with CO2 capture using MEA. Energy 45, 107–116. doi:10.1016/j.energy.2011.12.014
Dubois, L., and Thomas, D. (2018). Comparison of various configurations of the absorption-regeneration process using different solvents for the post-combustion CO2 capture applied to cement plant flue gases. Int. J. Greenh. Gas Control 69, 20–35. doi:10.1016/j.ijggc.2017.12.004
Dugas, R. E. (2006). Pilot plant study of carbon dioxide capture by aqueous monoethanolamine. MSE Thesis. Waterloo: University of Texas at Austin.
Eurostat (2016). Electricity prices for industrial consumers, second half 2016 (EUR per kWh). Available at: https://ec.europa.eu/eurostat/statistics-explained/index.php?title=Main_Page.
Freguia, S., and Rochelle, G. T. (2003). Modeling of CO2 capture by aqueous monoethanolamine. AIChE J. 49, 1676–1686. doi:10.1002/aic.690490708
Fytianos, G., Ucar, S., Grimstvedt, A., Hyldbakk, A., Svendsen, H. F., and Knuutila, H. K. (2016). Corrosion and degradation in MEA based post-combustion CO2 capture. Int. J. Greenh. Gas Control 46, 48–56. doi:10.1016/j.ijggc.2015.12.028
Garcia, M., Knuutila, H. K., and Gu, S. (2017). ASPEN PLUS simulation model for CO2 removal with MEA: validation of desorption model with experimental data. J. Environ. Chem. Eng. 5, 4693–4701. doi:10.1016/j.jece.2017.08.024
Gardarsdottir, S. O., Normann, F., Andersson, K., and Johnsson, F. (2015). Postcombustion CO2 capture using monoethanolamine and ammonia solvents: the influence of CO2 concentration on technical performance. Industrial Eng. Chem. Res. 54, 681–690. doi:10.1021/ie503852m
Garđarsdóttir, S. O., Normann, F., Andersson, K., and Johnsson, F. (2015). Postcombustion CO2 capture using monoethanolamine and ammonia solvents: the influence of CO2 concentration on technical performance. Industrial Eng. Chem. Res. 54, 681–690. doi:10.1021/ie503852m
Gupta, N., Mondal, A., Das, B., Deogam, B., Barma, S., and Mandal, B. (2015). Modeling and simulation for post-combustion carbon dioxide capture from power plant flue gas with economic analysis. Sep. Sci. Technol. 50, 1952–1963. doi:10.1080/01496395.2015.1016531
Hassan, S. M. N., Douglas, P. L., and Croiset, E. (2007). Techno-economic study of CO2 capture from an existing cement plant using MEA scrubbing. Int. J. Green Energy 4, 197–220. doi:10.1080/01971520600873418
Hassan, S. (2005). Techno-economic study of CO2 capture process for cement plants. Waterloo: University of Waterloo.
Hills, T., Leeson, D., Florin, N., and Fennell, P. (2015). Carbon capture in the cement industry: technologies, progress, and retrofitting. Environ. Sci. Technol. 50, 368–377. doi:10.1021/acs.est.5b03508
Hikita, H., Asai, S., Ishikawa, H., and Honda, M. (1977). The kinetics of reactions of carbon dioxide with monoethanolamine, diethanolamine and triethanolamine by a rapid mixing method. Chem. Eng. J. 13, 7–12. doi:10.1016/0300-9467(77)80002-6
Jakobsen, J., Roussanaly, S., and Anantharaman, R. (2017). A techno-economic case study of CO2 capture, transport and storage chain from a cement plant in Norway. J. Clean. Prod. 144, 523–539. doi:10.1016/j.jclepro.2016.12.120
Laribi, S., Dubois, L., De Weireld, G., and Thomas, D. (2019). Study of the post-combustion CO2 capture process by absorption-regeneration using amine solvents applied to cement plant flue gases with high CO2 contents. Int. J. Greenh. Gas Control 90, 102799. doi:10.1016/j.ijggc.2019.102799
Li, J., Tharakan, P., Macdonald, D., and Liang, X. (2013). Technological, economic and financial prospects of carbon dioxide capture in the cement industry. Energy Policy 61, 1377–1387. doi:10.1016/j.enpol.2013.05.082
Li, X., Wang, S., and Chen, C. (2014). Experimental and rate-based modeling study of CO2 capture by aqueous monoethanolamine. Greenh. Gases Sci. Technol. 4, 495–508. doi:10.1002/ghg.1419
Li, K., Leigh, W., Feron, P., Yu, H., and Tade, M. (2016a). Systematic study of aqueous monoethanolamine (MEA)-based CO2 capture process: techno-economic assessment of the MEA process and its improvements. Appl. energy 165, 648–659. doi:10.1016/j.apenergy.2015.12.109
Li, K. K., Cousins, A., Yu, H., Feron, P., Tade, M., Luo, W. L., et al. (2016b). Systematic study of aqueous monoethanolamine-based CO2 capture process: model development and process improvement. Energy Sci. Eng. 4, 23–39. doi:10.1002/ese3.101
Liu, Y., Zhang, L., and Watanasiri, S. (1999). Representing vapor− liquid equilibrium for an aqueous MEA− CO2 system using the electrolyte nonrandom-two-liquid model. Industrial Eng. Chem. Res. 38, 2080–2090. doi:10.1021/ie980600v
Liu, B., Zhang, M., Wang, T., and Jia, W. (2019). Process simulation of CO2 capture from CO2-EOR associated petroleum gas with aqueous MEA and MDEA solvents. Energy Sci. Eng. 7, 663–675. doi:10.1002/ese3.308
V. Masson-Delmotte, P. Zhai, H. O. Pörtner, D. Roberts, J. Skea, P. R. Shuklaet al. (Editors) (2018). “IPCC, 2018: summary for policymakers,”. Global Warming of 1.5°C. An IPCC Special Report on the impacts of global warming of 1.5°C above pre-industrial levels and related global greenhouse gas emission pathways, in the context of strengthening the global response to the threat of climate change, sustainable development, and efforts to eradicate poverty. In Press.
Mathisen, A., Sørensen, H., Melaaen, M. C., and Müller, G-I. (2013). Investigation into optimal CO2 concentration for CO2 capture from aluminium production. Energy Procedia 37, 7168–7175. doi:10.1016/j.egypro.2013.06.654
Mathisen, A., Sørensen, H., Eldrup, N., Skagestad, R., Melaaen, M., and Müller, G. I. (2014). Cost optimised CO2 capture from aluminium production. Energy Procedia 51, 184–190. doi:10.1016/j.egypro.2014.07.021
Moioli, S., and Pellegrini, L. A. (2019). Operating the CO2 absorption plant in a post-combustion unit in flexible mode for cost reduction. Chem. Eng. Res. Des. 147, 604–614. doi:10.1016/j.cherd.2019.03.027
Nguyen, T. B., and Zondervan, E. (2018). Ionic liquid as a selective capture method of CO2 from different sources: comparison with MEA. ACS Sustain. Chem. Eng. 6, 4845–4853. doi:10.1021/acssuschemeng.7b04247
Notz, R., Mangalapally, H. P., and Hasse, H. (2012). Post combustion CO2 capture by reactive absorption: pilot plant description and results of systematic studies with MEA. Int. J. Greenh. Gas Control 6, 84–112. doi:10.1016/j.ijggc.2011.11.004
Penteado, A., Esche, E., Salerno, D., Godini, H. R., and Wozny, G. (2016). Design and assessment of a membrane and absorption based carbon dioxide removal process for oxidative coupling of methane. Industrial Eng. Chem. Res. 55, 7473–7483. doi:10.1021/acs.iecr.5b04910
Pinsent, B., Pearson, L., and Roughton, F. (1956). The kinetics of combination of carbon dioxide with hydroxide ions. Trans. Faraday Soc. 52, 1512–1520. doi:10.1039/tf9565201512
Sundqvist, M., Biermann, M., Normann, F., Larsson, M., and Nilsson, L. (2018). Evaluation of low and high level integration options for carbon capture at an integrated iron and steel mill. Int. J. Greenh. Gas Control 77, 27–36. doi:10.1016/j.ijggc.2018.07.008
Thiele, R., Faber, R., Repke, J-U., Thielert, H., and Wozny, G. (2007). Design of industrial reactive absorption processes in sour gas treatment using rigorous modelling and accurate experimentation. Chem. Eng. Res. Des. 85, 74–87. doi:10.1205/cherd06091
Wagner, R., and Judd, B. (2006). “Gas sweetening fundamentals,” in Proceedings of the 56thLaurance reid gas conditioning conference, Norman, OK, 1–54.
Zhang, Y., and Chen, C-C. (2010). Thermodynamic modeling for CO2 absorption in aqueous MDEA solution with electrolyte NRTL model. Industrial Eng. Chem. Res. 50, 163–175. doi:10.1021/ie1006855
Keywords: CO2 capture, MEA, process simulation, solvent concentration, process parameters
Citation: Wang N, Wang D, Krook-Riekkola A and Ji X (2023) MEA-based CO2 capture: a study focuses on MEA concentrations and process parameters. Front. Energy Res. 11:1230743. doi: 10.3389/fenrg.2023.1230743
Received: 29 May 2023; Accepted: 04 September 2023;
Published: 15 September 2023.
Edited by:
Munish Kumar Chandel, Indian Institute of Technology Bombay, IndiaReviewed by:
Yukun Hu, University College London, United KingdomJoan Ramón Morante, Energy Research Institute of Catalonia (IREC), Spain
Copyright © 2023 Wang, Wang, Krook-Riekkola and Ji. This is an open-access article distributed under the terms of the Creative Commons Attribution License (CC BY). The use, distribution or reproduction in other forums is permitted, provided the original author(s) and the copyright owner(s) are credited and that the original publication in this journal is cited, in accordance with accepted academic practice. No use, distribution or reproduction is permitted which does not comply with these terms.
*Correspondence: Nan Wang, bmFuLndhbmdAbHR1LnNl; Xiaoyan Ji, eGlhb3lhbi5qaUBsdHUuc2U=