- Research Institute of Exploration and Development, Petrochina Southwest Oil and Gas Field Company, Chengdu, China
After nearly 60 years of development, the carbonate gas reservoirs in Sichuan Basin have entered the middle and late stages of development. Affected by various geological factors such as complex structure, formation water distribution and water invasion intensity, low permeability, fracture development degree, fracture-cavity combination, etc., and the difference of development technical policies, the utilization effect of reserves varies greatly among different gas reservoirs. Moreover, the current indicators for evaluating the utilization effect of reserves are mainly reserve utilization degree, dynamic-static reserve ratio, recovery degree, etc., yet a unified evaluation method has not been formed. In order to effectively evaluate the utilization effect of reserves and improve the development benefit of gas reservoirs, the evaluation of utilization effect of reserves was carried out by comprehensively considering geological characteristics and development technical policies. On this basis, a new method for evaluating the utilization effect of carbonate gas reservoir reserves was formed and applied in specific gas reservoirs. The research results show that: 1) The quality of reserve utilization can accurately evaluate the utilization effect of gas reservoir reserves; 2) By introducing big data analysis technology, comprehensively using ward clustering analysis method and Pearson coefficient to correlate the main influencing factors of reserve utilization effect, a prediction model of reserve utilization effect was established; 3) The WBT Carboniferous gas reservoir was chosen to verify the aforementioned model, and the result shows that the model has high prediction accuracy and strong adaptability, which can accurately evaluate the utilization effect of developed gas reservoir reserves. The model is also applicable to evaluating the utilization effect of undeveloped gas reservoirs. In conclusion, by adopting big data analysis, the established prediction model of reserve utilization effect is suitable for quantitative evaluation and analysis of reserve utilization effect of carbonate gas reservoirs, which can provide a basis for guiding the formulation of reasonable development technical policies and improving the reserve utilization effect for similar types of gas reservoirs.
1 Introduction
Many carbonate gas reservoirs in Sichuan Basin have entered the middle and late stages of development, with various types and complex geological conditions. The gas reservoirs have the following characteristics: complex structure, diverse trap types and reservoir types; small gas reservoirs account for more than 70% of the total; most reservoirs are strongly heterogeneous with low porosity, low permeability and low abundance; local fracture development and uneven reserve utilization; the gas-water relationship of gas reservoirs is complex, and the water invasion degree varies greatly among different gas reservoirs. Most gas reservoirs are accompanied with edge water and bottom water. More than 90% of gas fields produce formation water, which seriously affects the reserve utilization effect. At present, there are mainly four types of methods for evaluating the reserve utilization effect of gas reservoirs, namely, reserve evaluation methods based on mathematical statistics, numerical simulation, unstable well testing or material balance. However, there is no systematic evaluation method for reserve utilization effect. The current indicators for evaluating reserve utilization effect are mainly reserve utilization degree, dynamic-static reserve ratio, recovery degree, etc., which are mostly aimed at the calculation methods of geological reserves and dynamic reserves and the research on reserve classification (Li et al., 2009; Wan et al., 2009; Zhu and Xiong, 2011; Chen and Tang, 2016; Zhang et al., 2018; Zhang et al., 2019; Li, 2020). In order to realize the effective utilization of reserves and improve the development benefit of gas reservoirs, the evaluation of reserve utilization effect was carried out by comprehensively considering geological characteristics and development technical policies.
By comprehensively considering geological characteristics and development technical policies, this paper proposes reserve utilization quality as an indicator for evaluating reserve utilization effect. In light of ward clustering analysis method and Pearson coefficient, the main factors affecting reserve utilization effect are automatically clustered by computer and analyzed, and a prediction model of reserve utilization effect is established. This has important practical significance for guiding the formulation of reasonable development policies and improving reserve utilization effect for similar types of gas reservoirs (Yang et al., 2011; Antão et al., 2023; Adam, 2021; Liu et al., 2015; Feng et al., 2018; Liu, 2012; Jia et al., 2012).
2 Reserve utilization evaluation principle and method
For gas field development, the reserve utilization effect is an important indicator of gas field development, and one of the main contents of dynamic analysis in gas field development management (Chen, 2011; Geng et al., 2014; Li et al., 2018; Hou et al., 2020). The reserve utilization effect is usually qualitatively described by the reserve utilization status, and numerically characterized by indicators such as recovery factor, gas production rate, depletion degree, reserve utilization degree, well pattern control degree, and reserve controlled by single well. However, it is difficult to give a comprehensive quantitative evaluation indicator.
The indicators used in the traditional reserve utilization evaluation methods have large differences in the calculation results due to different geological factors such as reservoir physical properties, porosity, permeability, formation water distribution and fracture development. Therefore, it is somewhat inappropriate to use these indicators to quantitatively characterize the reserve utilization effect of gas reservoirs.
Following the principle of material balance of gas reservoirs and drawing on the concept of quality management, the concept of “reserve utilization quality” was proposed (Hu et al., 2011; Hu and Liu, 2011; Hu, 2012; Yu and Masamichi, 2021), which referred to the dynamic reserve depletion degree under unit pressure drop at a certain stage, characterizing the current reserve utilization effect of gas reservoirs. This indicator has characteristics of universality and comparability that no other related term has, and is applicable to any gas reservoir. Meanwhile, this indicator reflects the exploitation level and also the current reserve utilization situation; the reserve utilization quality at different stages is also related to the exploitation mode and management level.
Where, G is the gas reservoir reserves, 108 m3; Gp (∆t) is the cumulative gas production in ∆t time, 108 m3; Pti is the gas reservoir formation pressure at ti time.
3 Analysis of factors affecting reserve utilization quality
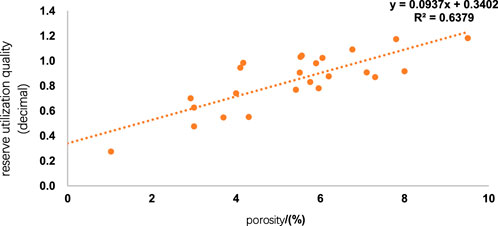
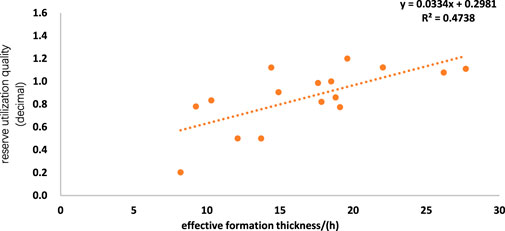
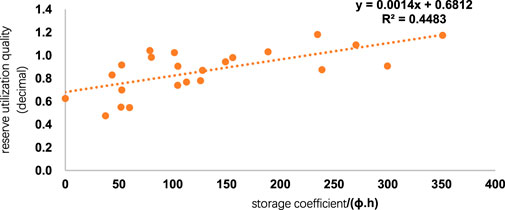
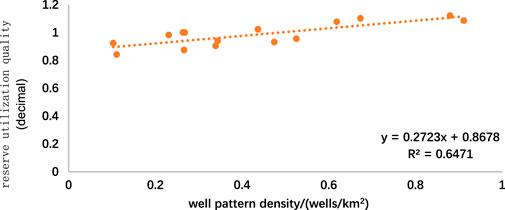
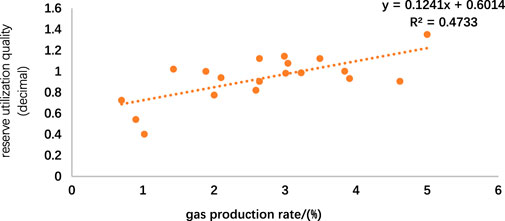
The reserve distribution law, development characteristics and reserve utilization effect of different types of gas reservoirs are various, and there are many factors affecting the reserve utilization, mainly including geological factors and development technology policies. In order to clarify the main controlling factors affecting the reserve utilization effect, the correlation between reservoir physical properties, permeability variation coefficient, formation coefficient, water invasion intensity, well pattern density, production pressure difference, pressure drop funnel and reserve utilization effect was analyzed.
Effective formation thickness (
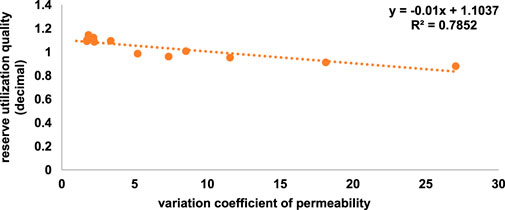
FIGURE 4. Relationship between reservoir reserve utilization factor and variation coefficient of permeability.
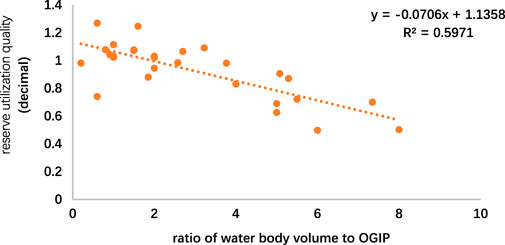
FIGURE 7. Relationship between reservoir reserve utilization factor and the ratio of water body volume to OGIP.
4 Reserve utilization effect prediction model
4.1 Study on quantitative characterization method of influencing factors
At present, artificial neural network is widely used, and its basic principle is to form a complex information processing system with characteristics of self-adaption, self-organizing, self-learning and distributed parallel computing by connecting a large number of processing units similar to human brain neurons. Because of its powerful pattern recognition classification and functional approximation ability, it has been widely used in oil field exploration and development production. The mature big data analysis technology formed at home and abroad has qualitative and quantitative analysis methods for the quantitative characterization of influencing factors. Using quantitative mathematical characterization methods can more accurately get the strength of influencing factors, such as risk regression method, weight calculation method, etc. The system clustering method further calculates the connection between various factors.
Ward cluster analysis method, namely, the deviation square sum method, mainly applies the basic idea of variance analysis. When the classification result is reasonable, the deviation square sum of the same kind of samples is small, while the deviation square sum between different kinds is large. The clustering process is as follows:
First, assume that GK and GL are merged into a new class GM, and then the deviations of GK, GL and GM respectively are as:
Taking the kth class as an example, Wk, WL and WM respectively represent the centroid of the Kth class, Lth class and Mm-th class,
If the distance between two classes is relatively close, then the increase of the deviation square sum after merging is relatively small. For example, if the distance between Gk and GL is very close, then the increase of the deviation square sum (i.e., WK-WL-WM) is relatively small.
Therefore, the clustering algorithm expression using deviation square sum is:
Where, DKL-Gk and GL are the square distances of these two classes.
Where, r represents Pearson correlation coefficient; X represents standardized variable; subscript u represents independent variable serial number, u = 1,2,3,...,m; k represents sample serial number, k = 1,2,3,...,n; x represents independent variable;
The relevant calculation formula for Pearson correlation analysis is:
When r > 0.7, it is strong correlation; when 0.4 < r < 0.7, it is moderate correlation; when 0.2 < r < 0.4, it is weak correlation; when r < 0.2, it is considered no correlation.
By further calculating the connection between each element, we can classify objective elements more efficiently and accurately. Through combining ward cluster analysis method and Pearson coefficient, computer automatic clustering and multi-factor analysis are carried out to further clarify the main controlling factors of reserve utilization effect. The strength of the correlation between various factors and the quality of reserve utilization can be obtained by using the correlation coefficient method and thus the influence of individual factors on the quality of reserve utilization can be determined.
4.2 Establishment of prediction model
Eight influencing factors with higher correlation coefficients are obtained with single-factor analysis, among which the geological influencing factors mainly include porosity, effective thickness, storage coefficient, the ratio of water body volume to OGIP, permeability variation coefficient, and the development influencing factors mainly include well pattern density and gas production rate during stable production period. Considering the geological and development influencing factors, the indicators representing the same category are optimized, and finally five indicators are obtained.
Through combining ward cluster analysis method and Pearson coefficient, SPSS software is used to perform neural network calculation, and the weight values of influencing factors and the error values of calculation results are obtained. The main influencing factors characterizing the effect of reserve utilization are quantified. The detailed steps are as follows: 1) Collect and sort out the relevant data such as gas reservoir dynamic and static parameters, gas reservoir reserve utilization quality, etc.; 2) In the variable view, set the initial values of each parameter; 3) Set the dynamic and static indicators as the input end, and the reserve utilization quality as the output end, and select the multilayer perceptron neural network to perform weight calculation; 4) Adjust formula behind the hidden layer, calculate repeatedly, and export the result graph and data when the error is below 3%.
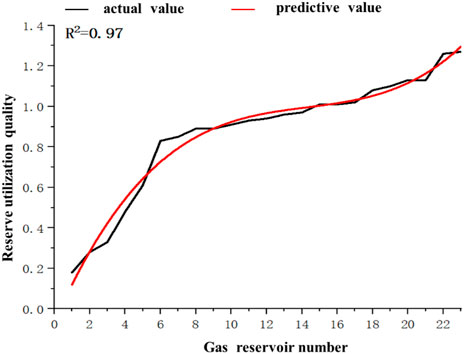
The results show that the error value is small and the fitting degree is high, which indicates the accuracy of the result (Figure 8). Therefore, the weight ratio of different indicators can be obtained, and the main controlling factors of the geological and development technology policies for the reserve utilization quality can be clarified (Table 1).
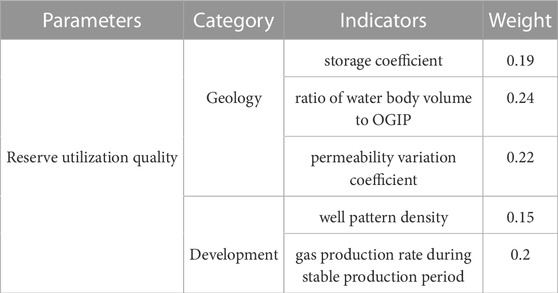
TABLE 1. The main controlling factors of the geological and development technology policies for the reserve utilization quality.
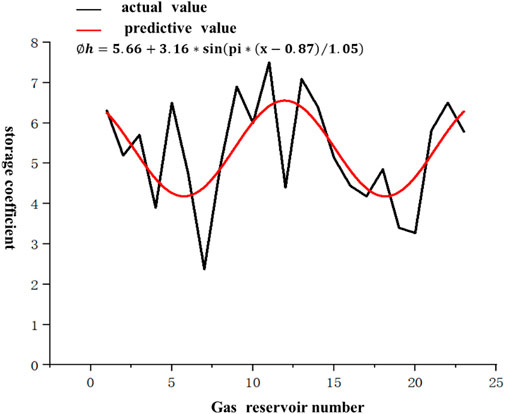
Considering the influence of geology and development technology policies on the reserve utilization quality, the fitting relationship between each influencing factor (five obtained indicators) and gas reservoir is obtained by Fourier transform.
For example,: the fitting result of storage coefficient is obtained by fourier transform, as shown in Figure 9. The fitting Formula 7 from Figure 9 can be used to get the solution of X, that is, Formula 8.
By analogy, the fitting solution formulas corresponding to ratio of water body volume to OGIP, permeability variation coefficient, well pattern density and gas production rate in stable production period are obtained. That is, Formula 9, Formula 10, Formula 11, Formula 12:
Where, k, permeability variation coefficient;
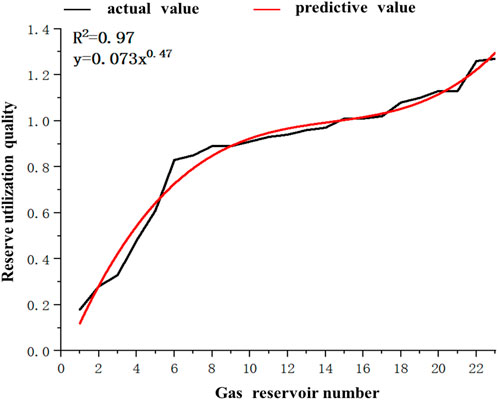
The fitting result is obtained from SPSS software and shown in Figure 10. The fitting formula obtained from the figure is shown in Formula 13. The weight values of five influencing indicators obtained from neural network algorithms are applied to get weighted average of reserve utilization quality, which is the prediction model as can be seen from Formula 14.
4.3 Validation of the prediction model
Strongly heterogeneous carbonate gas reservoir is selected for validation of the established prediction model. The WBT Carboniferous gas reservoir in Sichuan basin is mainly characterized by medium to low porosity and strong heterogeneity. The reservoir factors are listed in Table 2. There is a large area of high permeability in the middle part, with relatively developed fractures in the high-permeability area and undeveloped fractures in the low permeability area. There is a significant difference in gas well productivity. Gas wells with high and low productivity are distributed across the entire gas reservoir. The proportion of low-yield wells is high, and the production contribution mainly comes from medium to high-yield wells; Controlled by factors such as fractures and reservoir physical properties, gas reservoirs are surrounded by edge water and local sealed water. The dynamic reserves of the main wells in the main area are relatively large, while the reservoir quality in the low permeability areas in the north and south part is poor, resulting in significant differences in terms of reserve utilization effects.
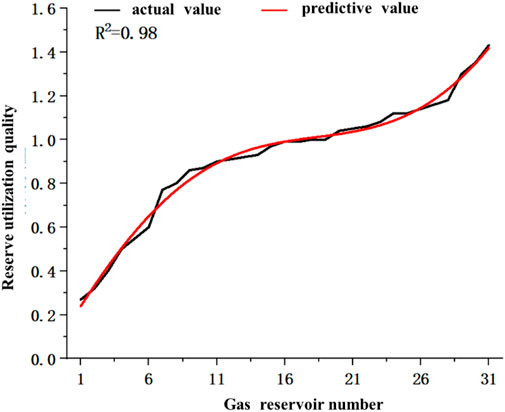
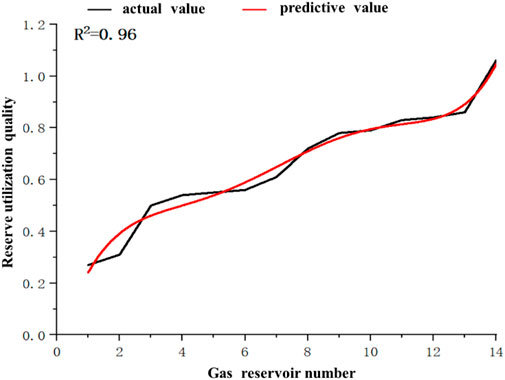
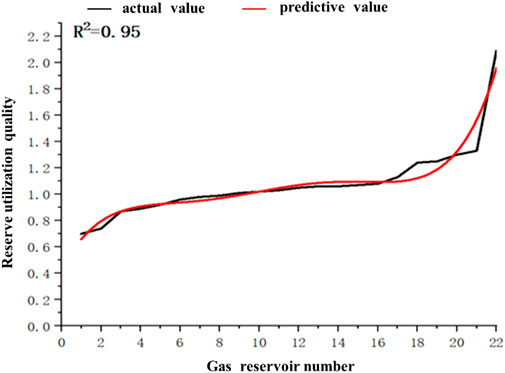
The reserve utilization evaluation model obtained the quality of reserve utilization in different blocks, with a fitting degree of over 95% between the predicted value and the actual value, which demonstrates strong adaptability and high prediction accuracy of the model (Figures 11–13).
Through a comprehensive analysis of the geological and development technology policies during the gas reservoir development process, the following conclusions are drawn:
Medium and high permeability areas: effective formation thickness and permeability are relatively high, and reservoir properties are better than those of the north or south low permeability areas. Therefore, priority should be given to developing the medium and high permeability areas. By infilling the well pattern (0.45 wells/km2), all reserves in medium and high permeability areas will be utilized, and the reserves in adjacent low permeability areas will also be utilized. Currently, the degree of reserve utilization is 100%. Meanwhile, measures such as water drainage, decreasing the development intensity of production in medium and high permeability areas, and controlling production pressure differences were taken to ensure balanced gas reservoir development and improve the quality of reserve utilization. The current calculated reserve utilization quality is 0.96, which also indicates that the reserve utilization effect is good.
South low permeability area: poor physical properties, low permeability; and poor production efficiency of gas wells to the west of TD22 block. At present, the well pattern density is low (0.18 wells/km2). The dynamic reserves are small, and the degree of reserve utilization is less than 20%. Thus the calculated reserve utilization quality is 0.45, indicating poor overall utilization effect.
North low permeability area: the reservoir has poor physical properties and small dynamic reserves. By infilling the well pattern (with 0.32 wells/km2), the later water drainage measure is effective, and the reserve utilization effect is better than that of the south low permeability area.
5 Conclusion
(1) Based on a thorough study of many professional terms that characterize the effectiveness of reserve utilization, the term “reserve utilization quality” is proposed for the first time as an indicator of reserve utilization effectiveness. This characterization parameter not only reflects the utilization level of the gas reservoir but also reflects the reserve utilization situation during a certain period.
(2) The big data analysis technology is introduced, combined with ward clustering analysis method and Pearson coefficient. The main influencing factors of reserve production effect are comprehensively considered, and the reserve utilization effect prediction model is established on this basis.
(3) WBT Carboniferous gas reservoir is used to validate and analyze the prediction model. The analysis results indicate that the fitting degree between the predicted value and the actual value is over 95%, with high prediction accuracy and strong adaptability. It is also suitable for evaluating the reserve utilization effect of undeveloped gas reservoirs.
Data availability statement
The original contributions presented in the study are included in the article/Supplementary material, further inquiries can be directed to the corresponding author.
Author contributions
XY: Conceptualization, Methodology, Analysis, Writing-Original Draft. YY:Investigation, Data Curation, Model analysis, Writing. YL: Writing, Investigation. QM: Resources, Supervision. FG: Validation. XW: Writing—Review and Editing. XL: Writing—Review and Editing. All authors contributed to the article and approved the submitted version.
Conflict of interest
Authors XY, YY, YL, QM, FG, XW, and XL were employed by the company Petrochina Southwest Oil and Gas Field Company.
Publisher’s note
All claims expressed in this article are solely those of the authors and do not necessarily represent those of their affiliated organizations, or those of the publisher, the editors and the reviewers. Any product that may be evaluated in this article, or claim that may be made by its manufacturer, is not guaranteed or endorsed by the publisher.
References
Adam, Lurka. (2021). Spatio-temporal hierarchical cluster analysis of mining-induced seismicity in coal mines using Ward's minimum variance method. J. Appl. Geophys. 184, 104249. doi:10.1016/j.jappgeo.2020.104249
Antão, P., Sun., S., Teixeira, A. P., and Guedes Soares, C. (2023). Quantitative assessment of ship collision risk influencing factors from worldwide accident and fleet data. Reliab. Eng. Syst. Saf. 234, 109166. doi:10.1016/j.ress.2023.109166
Chen, Yuanqian, and Tang, Wei (2016). Annual evaluation methods for remaining recoverable reserves, remaining recoverable reserves-production ratio and remaining recoverable degree of oil and gas fields. Acta Pet. Sin. 37 (6), 796–801. doi:10.7623/syxb201606010
Chen, Yuanqian (2011). The practice of petroleum reservoir engineering. Beijing, China: Petroleum Industry Press.
Feng, Guoqing, Pan, Liyan, and Kong, Bing, (2018). Layer system optimization research based on fuzzy clustering analytical method. oil-gas Reserv. Eval. Dev. 8 (3), 30–34. doi:10.3969/j.issn.2095-1426.2018.03.006
Geng, Na, Miao, Feifei, and Liu, Xiaohong, (2014). Calculation method of reserves producing degree of water flooding. Fault-Block Oil Gas Field 21 (4),472–475. doi:10.6056/dkyqt201404015
Hou, Kefeng, and Li, Jinbu, (2020). Evaluation and development countermeasures of undeveloped reserves in Sulige tight sandstone gas reservoir. Lithol. Reserv. 32 (4), 115–125. doi:10.12108/yxyqc.20200412
Hu, Gang, and Liu, Weixia (2011). A new method of evaluating reserves producing status by using reserves producing quality. J. Oil Gas Technol. 33 (9), 60–63. doi:10.3969/j.issn.1000-9752.2011.09.013
Hu, Gang (2012). Research on quantitative characterization of evaluating reserves employing status. Jouranal Cheng Du Univ. Technol. Technol. Ed. 39 (1), 100–103. doi:10.3969/j.issn.1671-9727.2012.01.014
Hu, Gang, Wang, Jian, and Liu, Wei xia (2011). Evaluation of reserves producing quality for Block Xin68 in the Dongxin oilfield. Special Oil Gas Reservoirs 18 (6), 66–69. doi:10.3969/j.issn.1006-6535.2011.06.016
Jia, Ailin, Fu, Ninghai, Cheng, Lihua, Guo, Jianlin, and Yan, Haijun (2012). The evaluation and recoverability analysis of low-quality reserves in Jingbian gas field. Acta Pet. Sin. S2 (12), 160–165.
Li, Bin, and Liu, Wei, (2018). Evaluation methods for producing degrees of geological reserves from different reservoirs. Pet. Technol. Forum 29 (2), 36–41. doi:10.3969/j.issn.1002-302x.2018.02.008
Li, Jiangtao, Chen, Deshou, and Gao, Qinfeng, (2009). The calculation and appraisal of dynamic reserves of the Sebei gas filed. Nat. Gas. Ind. 29 (7), 95–98. doi:10.3787/j.issn.1000-0976.2009.07.029
Li, Pengfei (2020). Study on evaluation method of gas reservoir dynamic reserves. Yunnan Chem. Technol. 47 (2), 82–84. doi:10.3969/j.issn.1004-275X.2020.002.031
Liu, Ping, Shen, Xinxin, and Li, Shaoming, (2015). The application of system cluster analysis method in dual horizontal wells SAGD optimum design. Petroleum Chem. Eng. China (7), 47–48. doi:10.3969/j.issn.1008-1852.2015.07.023
Liu, Rong he (2012). Discussion on the dynamic reserve calculation in early development stage of gas reservoir. Special Oil Gas Reservoirs 19 (5),69–72. doi:10.3969/j.issn.1006-6535.2012.05.017
Wan, Yujin, and Sun, Hedong, (2009). Reserves producing level analysis of multilayer gas reservoir in the Sebei gas filed. Nat. Gas. Ind. 29 (7), 58–60. doi:10.3787/j.issn.1000-0976.2009.07.018
Yang, Jian, (2011). Permeability prediction method based on improved BP neural network. Lithol. Reserv. (1), 98–101. doi:10.1007/s12182-011-0123-3
Yu, Ogasawara., and Masamichi, Kon. (2021). Two clustering methods based on the Ward's method and dendrograms with interval-valued dissimilarities for interval-valued data. Int. J. Approx. Reason. 129, 103–121. doi:10.1016/j.ijar.2020.11.001
Zhang, Ji, Shi, Hongran, and Liu, Yanxia, (2018). A new method to evaluate the available reserve of tight sandstone gas reservoir with strong heterogeneity. Special Oil Gas Reservoirs (3), 1–5. doi:10.3969/j.issn.1006-6535.2018.03.001
Zhang, Lixia, and Guo, Chunqiu, (2019). Gas in place determination by material -balancequasipressure approximation condition method. Acta Pet. Sin. 40 (3), 337–349. doi:10.7623/syxb201903008
Keywords: carbonate gas reservoir, reserve utilization effect, reserve utilization quality, ward clustering analysis method, correlation analysis
Citation: Yin X, Yuan Y, Liu Y, Mei Q, Guo F, Wei X and Li X (2023) A new method for evaluating the utilization effect of carbonate gas reservoir reserves. Front. Energy Res. 11:1228773. doi: 10.3389/fenrg.2023.1228773
Received: 25 May 2023; Accepted: 12 July 2023;
Published: 31 July 2023.
Edited by:
Yibo Li, Southwest Petroleum University, ChinaReviewed by:
Jinze Xu, University of Calgary, CanadaYang Yang, Chengdu University of Technology, China
Copyright © 2023 Yin, Yuan, Liu, Mei, Guo, Wei and Li. This is an open-access article distributed under the terms of the Creative Commons Attribution License (CC BY). The use, distribution or reproduction in other forums is permitted, provided the original author(s) and the copyright owner(s) are credited and that the original publication in this journal is cited, in accordance with accepted academic practice. No use, distribution or reproduction is permitted which does not comply with these terms.
*Correspondence: Xiaohong Yin, eWlueGlhb2hvbmdAcGV0cm9jaGluYS5jb20uY24=
 Xiaohong Yin*
 Yongjie Yuan