 Xiangchu Xu
 Zengqiang Mi1
94% of researchers rate our articles as excellent or good
Learn more about the work of our research integrity team to safeguard the quality of each article we publish.
Find out more
ORIGINAL RESEARCH article
Front. Energy Res. , 28 July 2023
Sec. Smart Grids
Volume 11 - 2023 | https://doi.org/10.3389/fenrg.2023.1225327
Accurately quantitative evaluation of the response capability of electric vehicle aggregator (EVA), i.e., the adjustable range of power, is the premise and basis of its participation in the demand response (DR). In response to the current EVA’s response capability evaluation, ignoring the autonomy of EV decision-making behavior may lead to overly idealized evaluation results, as well as the problem of evaluating only from a single time scale. To this end, this paper proposes a response capability evaluation model of EVA based on evolutionary game and response anticipation. Based on the physical constraints of EVs and their willingness to discharge, response capability evaluation models are constructed for individual EVs of different response types. Considering the autonomy of decision-making behavior of EVs, an evolutionary game model with multi-strategy sets of EVs is constructed. Based on the idea of response anticipation, a regulation strategy is proposed for EVA to achieve the dynamic update of EVA’s response capability. The proposed model is verified to be able to accurately evaluate the EVA’s response capability through simulation examples, and the EVA response capability evaluation is extended from a single time scale to multiple time scales. The evaluation results can be used as the basis for EVA to participate in the electricity market bidding.
Due to the advantages of energy saving and zero emission, the market share of EVs is growing rapidly with the support of relevant policies. According to the Global EV Outlook 2021 report published by the International Energy Agency, the number of EVs worldwide has reached about 10 million in 2020 and is expected to soar to 145 million by 2030 (IEA, 2021). In addition, demand response (DR) has received increasing attention from researchers as a means of using customer-side resources to relieve pressure on the system supply-demand balance (Shariatzadeh et al., 2015). Therefore, EVs are a highly promising resource for flexible regulation to be exploited.
However, the capacity of an individual EV is small and decentralized in the system, which cannot be directly deployed by the system (Xu et al., 2023). EVA, as an emerging market entity between the electricity market and EVs, can integrate EVs in a region into an aggregator with large adjustable capacity and simplicity control. With the development of artificial intelligence (Cheng and Yu, 2019a) and energy internet (Cheng and Yu, 2019b), EVA can respond to system dispatch or participate in the electricity market, while providing a variety of ancillary services to the system, such as peak shaving and valley filling, frequency regulation, spinning reserve (Han et al., 2019). There have been many studies related to DR management applications and aggregator participation in electricity markets. A profit-maximization-based pricing optimization model for DR management with customer behavior learning in the context of smart grids was presented (Meng and Zeng, 2016). A game theory-based approach to obtain the optimal bidding strategy for DR aggregators in the electricity market was proposed (Abapour et al., 2019a). A game-theoretic approach to the optimal bidding strategy for DR aggregators in deregulated energy markets was provided (Abapour et al., 2019b). A bilevel game-theoretic model for multiple strategic retailers participating in both wholesale and local electricity markets while considering customers’ switching behaviors was proposed (Hong et al., 2023).
Aggregators need to evaluate their response capability in advance before participating in the electricity market. Response capability of the EVA is the adjustable range of power that can be regulated up (charge or stop discharging) or down (stop charging or discharging) from the baseline power. Accurately quantitative evaluation of EVA’s response capability is the prerequisite basis for its participation in DR. Overestimation of response capability carries the risk of under-response, which may endanger system safety, underestimation of response capability will waste EV’s DR potential and cause economic loss.
A number of studies have been conducted around the response capability evaluation of EVAs. The aggregated response capability of EVs in parking lot charging stations using queuing theory was evaluated (Chukwu and Mahajan, 2014). (Zhang and Kezunovic, 2016) evaluated the response capability of EV clusters based on Markov process. A robust virtual battery model-based method for evaluating the response capability of large-scale plug-in EVs was proposed (Hu et al., 2021). The response capability of a cluster of parked EVs was considered to be proportional to the number of connected EVs (Han et al., 2011). A recursive idea-based model for evaluating the temporal response capability of EV switching station was developed (Liu et al., 2017). (Lam et al., 2016) evaluated the aggregated response capability of EV clusters using a queuing network model. An EV response capability calculation method was proposed to evaluate the response capability of an individual EV and EV clusters under different charging strategies, respectively (Wu et al., 2018). An aggregation model was developed to evaluate the response capability of large-scale plug-in EV clusters (Zhang et al., 2017). (Zhang et al., 2019; Deng et al., 2020) extended the EVA’s response capability evaluation model from a single time scale to multiple time scales. The response capability of EVA in the next time period is dynamically updated according to the response of EVs in the previous time period. The charging-discharging strategies of EVs in the response capability evaluation model constructed in the above literature were entirely determined by the EVA. However, in realistic scenarios, EVA and EV users are different interest entities with different optimization goals in their respective decision-making processes. When evaluating the actual response capability of EVA, ignoring the autonomy of EV decision-making behavior may lead to overly idealized evaluation results.
Under the DR mechanism, the charging-discharging incentive price issued by the EVA to EVs is influenced by the total response volume of the EVs, and the incentive price decreases as the response volume increases. In response to EVA incentives, there is a game relationship between EVs. Each EV is a stakeholder and the economic benefit is influenced by the charging-discharging strategies of other EVs. The traditional game approach makes the dual assumptions of “complete rationality” and “complete information” for the participants, which is obviously not in line with the actual decision-making scenario of EV users, who cannot respond to the information changes quickly and optimally. Therefore, the evolutionary game based on “bounded rationality” and “limited information” can more reasonably characterize the game behavior of EV users in actual decision-making scenarios.
Evolutionary game theory has yielded many achievements in solving power system problems. Based on the framework of evolutionary game theory, an in-depth study of the long-term bidding equilibrium characteristics of homogeneous and heterogeneous power generation-side markets was provided (Cheng et al., 2022). (Cheng et al., 2021) provided an in-depth study of the behavioral decision problem in demand-side response management from the perspective of multiple population evolutionary game dynamics. An evolutionary game model of renewable energy generation and transmission from the perspective of bounded rationality and multi-agents game to analyze the necessity and effectiveness of strengthening relevant government regulation was established (Fang et al., 2018). (Cheng et al., 2020a) focused on the general N-population multi-strategy evolutionary games, and used them to investigate the generation-side long-term bidding issues in electricity market. A hierarchical extension coordinated controller was proposed, which considered the bounded rationality of the control system to address traditional stability control interference on driving speed and driver operation (Zheng et al., 2023). Considering the formation mechanism of greenwashing behaviors and collusion in EV certification processes, a tripartite evolutionary game model based on strategic interactions among manufacturers, certification authorities, and governments was constructed (Liu et al., 2023).
However, there are few studies in the existing literature that use evolutionary game theory to analyze the decision behavior of EV users in real-world scenarios and evaluate response capability of EVA on this basis (Cai et al., 2023). Evaluated the response capability of EVA based on a multi-strategy set evolutionary game model for EVs. The response behavior of EV users to incentives was analyzed using evolutionary game theory, and a method to evaluate response capability of EVs in grid emergencies was proposed (Wu et al., 2021). However, the differential response capability of different types of EVs was not considered and the response capability of EVs was only evaluated from a single time scale, ignoring the impact of EVs responding to system dispatch commands on response capability.
To address the shortcomings of existing studies, this paper proposes a response capability evaluation model of EVA based on evolutionary game and response anticipation, with the following main contributions. 1) EVs are subdivided into inelastic EVs, unidirectional EVs and bidirectional EVs according to the physical constraints of EVs and whether they have the willingness to discharge. Considering the differential response capability of different types of EVs, the response capability evaluation methods of different types of EVs are given. 2) EV users, as highly autonomous individuals, can adjust their charging-discharging strategies according to their own economic benefits. An evolutionary game model with multi-strategy sets of EVs is constructed based on which the response capability of EVs is evaluated. 3) Based on the idea of response anticipation, the influence of EVA response system scheduling instructions on response capability is considered. The response capability evaluation model of EVA is extended from a single time scale to multiple time scales to realize the response capability dynamic update of EVA.
The rest of this paper is structured as follows. Section 2 describes the framework for EVA to participate in the electricity market. The methodology for evaluating the response capability of different response types of EVs is given in Section 3. The evolutionary game model is developed in Section 4. Section 5 proposes a multi-time scale response capability evaluation method for EVA. Case studies are conducted in Section 6. Section 7 highlights the conclusions and future work.
The framework for EVA to participate in the electricity market as an emerging market entity between the ISO and EVs is shown in Figure 1. EVA collects EV information and issues control instructions through smart charging piles, issues charging-discharging incentive prices for the DR period according to the scheduling instruction, and evaluates the aggregated response capability of EVs during the DR period. EVA bids in the electricity market with other interest entities based on the response capability evaluation results. ISO is responsible for the operation and clearing settlement of the electricity market, issues DR time periods and scheduling instructions, and declares electricity price intervals. Based on the bidding capacity and offering price of each interest entity, the winning capacity and winning price of each entity are determined with the goal of economic optimality.
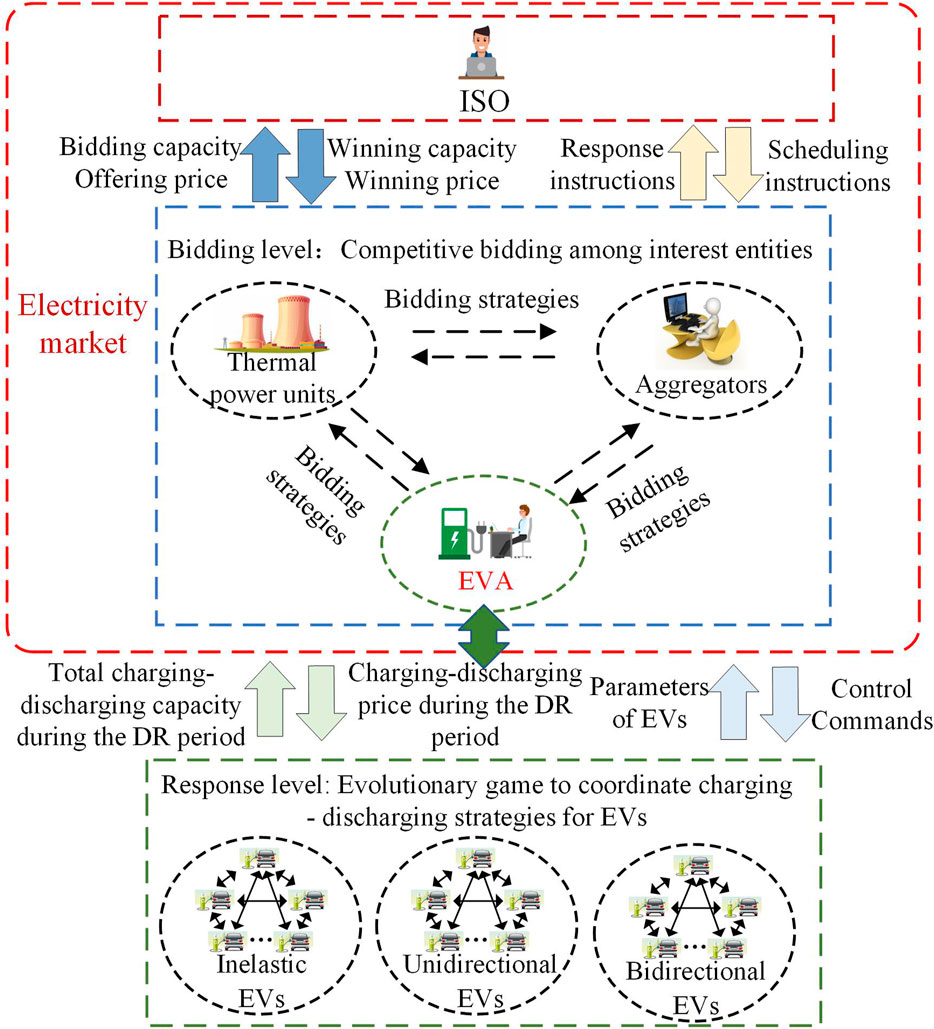
FIGURE 1. The framework for EVA to participate in the electricity market.
The focus of this paper is how to quantitatively evaluate the response capability of EVA, which is related to the charging-discharging strategies of EVs. EV users have great autonomy, and can be informed of the economic benefits of their participation in DR through smart charging piles or mobile apps, and change the charging-discharging strategies autonomously. However, EV users are a group of limited rationality, their grasp of other EV users’ information and knowledge of the game environment are limited. They tend to estimate the economic benefits under different strategies based on empirical memory, and their decision-making behavior has a certain degree of randomness.
EV users can determine their own charging and discharging modes. The EVs are subdivided into three categories as follows:
1) Inflexible EV: Continuous charging at rated power during parked period still does not achieve the desired energy.
2) Unidirectional EV: The charging power can be adjusted during grid connection period, but it cannot be fed backwards to the EVA, i.e., it cannot be in the state of discharge.
3) Bidirectional EV: The power can be fed back to EVA in the process of grid connection, i.e., the power can flow in both directions, and the charging and discharging power can be flexibly adjusted in the adjustable interval.
The set composed of three types of EVs is denoted as
If the EV satisfies the constraints of Eq. 1, the EV belongs to the set
If the EV satisfies the constraints of Eq. 4 and the user selects the unidirectional charging mode, the EV belongs to the set
where
If the EV satisfies the constraints of Eq. 4 and
where
The power and energy constraints to be satisfied by the bidirectional EV are as follows:
In an open electricity sales market environment, each EV arranges the charging-discharging power for each time period with its own optimization target. The total charging and discharging power of all EVs under EVA’s jurisdiction during the DR time period will directly determine EVA’s bidding power and energy offer in the electricity market, which in turn affects the winning power and winning price, and thus affects the charging-discharging incentive price issued by EVA to EVs. Therefore, how EVs choose their respective charging-discharging strategies can be viewed as a game problem. Classical game theory is based on the following three assumptions: 1) the participants are perfectly rational, 2) the participants have perfect information, 3) the structure and environment of the game are given in advance (Cheng et al., 2020b). The strong assumptions of classical game theory make it difficult to be applied to the actual EV decision-making scenarios, and evolutionary games based on the assumptions of “bounded rationality” and “limited information” can provide better solutions. The “bounded rationality” and “limited information” refer to the fact that EV users have incomplete knowledge and information, and have limited knowledge of other EV users’ decision-making information and game environment, so the decision-making behavior is somewhat random.
The travel characteristics of EVs are highly stochastic, and the travel characteristics of EVs include EV on-grid/off-grid moment, SOC at on-grid/off-grid, and expected SOC at off-grid moment. EVs with the same travel characteristics have the same charging demand, and the charging-discharging strategies will converge under the same incentives. EVs with the same travel characteristics are considered as an EV population, and their internal charging-discharging strategies are selected based on evolutionary games.
In this paper, each EV is abstracted as an EV population with the same appearance characteristics, and its internal evolutionary game process is modeled. N number of strategies are randomly generated by the EV under the constraints, and the strategy set is the set of charging-discharging power vectors for each time period within the scheduling time period. The strategy set generated by the i-th EV population is denoted as
where
The optimization objective of each EV is to minimize the total charging cost by participating in DR while satisfying its own travel needs. The optimization objective of an EV can be represented by a payment function that includes the charging cost, the discharge compensation and the additional cost of battery degradation due to participation in DR. The mathematical expression of the payment function is as follows:
where
The dispatch of EVs must first meet their charging demand and ensure that the energy of EVs off-grid should reach the expected energy set by users, with the following corresponding constraints:
Each EV population has the same constraint to generate the strategy set because of the consistent travel behavior, and N number of strategies are randomly generated under the constraint. Since the EV control strategy in the set
In the evolutionary game process, each EV chooses a charging-discharging strategy independently, and the population state indicates the proportion of EVs in the population choosing each strategy.
The evolutionary game model transforms the payoff function
It is unlikely that the dynamic evolutionary process of EV selection of charging-discharging strategies will be completed in a single pass. When there is an opportunity to modify the strategy, EV will compare the expected return of selecting the current strategy with the expected return of selecting other strategies and will modify the selected strategy with conditional transformation probability
where
The corresponding dynamic evolutionary differential equations will differ depending on the form of the chosen revision protocol. Logit protocol is commonly used in evolutionary game model that simulate EV decision because they take into account the individual preferences and bounded rationality of decision makers (Cai et al., 2023). The expression for the conditional probability when using the Logit revision protocol is as follows:
Bringing Eq. 20 into Eq. 19 gives the dynamic evolution equation of the EV population as
The dynamic evolution equation depicts the game process in the actual decision-making scenario of EV users. When
The dynamic evolution equation of Eq. 21 is discretized and the expression is as follows:
The flow chart of the evolutionarily stable strategy solution is shown in Figure 2.
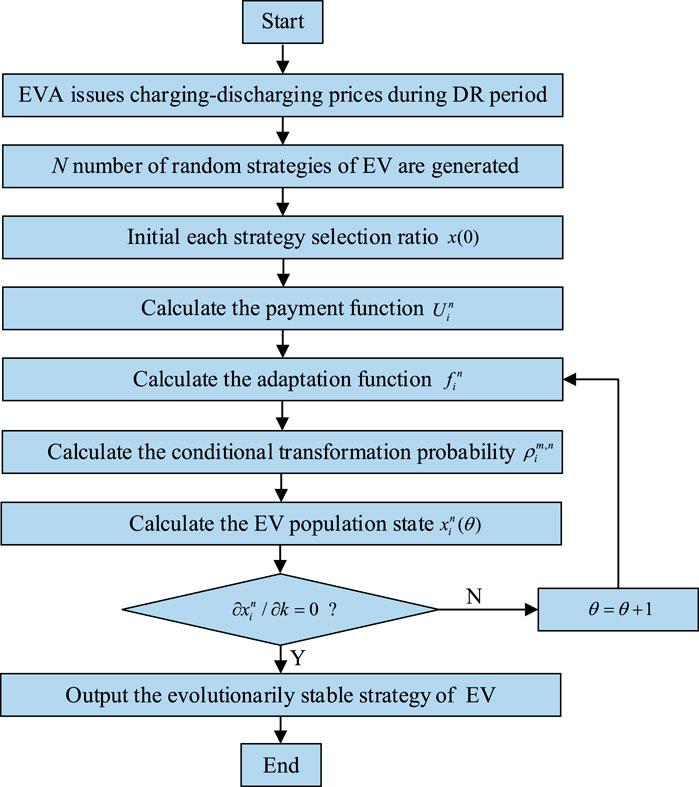
FIGURE 2. The flow chart of the evolutionarily stable strategy solution.
The evolutionarily stable strategy solving steps are as follows:
1) EVA issues the charging-discharging prices for the DR time period.
2) EV population randomly generates N strategies under the constraints
3) EV population randomly generates the initial each strategy selection ratio
4) Calculate the payment function
5) Calculate the adaptation function
6) Calculate the conditional transformation probability
7) Calculate the EV population state
8) Determine whether
9) Until
By discretizing the time axis during the DR time period and assuming that the EV power is constant in period
where
Then the equation for the response capability of an individual EV is as follows:
where
The response capacity of unidirectional/bidirectional EV during grid-connected hours is shown schematically in Figure 3.
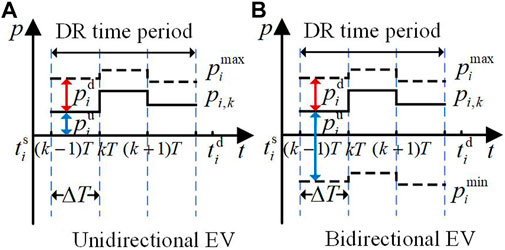
FIGURE 3. Schematic diagram of EV’s response capability. (A) Unidirectional EV. (B) Bidirectional EV.
The formula for the response capability before participation in DR obtained by EVA aggregation is as follows:
where
EVA issues the DR time window information in advance, and based on the evolutionary game model, when all EVs adopt the evolutionarily stable strategy, the upper and lower spare capacities that EVA can provide under a given DR time window can be evaluated by Eqs 27, 28.
EVA participation in DR will cause changes in its own response capability. When EVA responds to the scheduling control command
To address this issue, this paper further proposes an evaluation model based on the idea of response anticipation to dynamically evaluate the response capability of EVA. The variation of EVA’s response capability is closely related to its scheduling strategy. In this paper, we propose a regulation strategy considering RTM and SOC indexes. The priority queue is generated by combining the RTM and SOC of each EV, and the response is obtained by taking into account the scheduling instruction and user travel demand on the basis of merit participation, and finally the dynamic evaluation results of EVA’s response capability of participating in DR are obtained.
1) RTM indicator: indicates the difference between the remaining parked time and the necessary charging time during the EV grid connection period. The mathematical definition is as follows:
where
2) SOC indicator: in addition to RTM indicator, SOC indicator also affects the generation of EV response priority queue. An EV with a larger SOC has limited rechargeable capacity but has a larger discharge capacity, so its regulation down response capability is smaller and its regulation up response capability is larger. Conversely, the EV with smaller SOC have larger regulation down response capability and smaller regulation up response capability. When EVA responds to ISO regulation instruction, it first generates EV response priority queue with RTM as the primary reference indicator in descending order, and if RTM is equal, EV response queue is then sorted with SOC as the secondary reference indicator. Specifically, if
The response capability evaluation flow chart of EVA is shown in Figure 4, with the following steps:
1) ISO issues DR time period
2) EVA issues charging-discharging prices during DR time period, and EVA adopts differentiated billing or incentives for EV users of different response types.
3) Input EVs’ travel characteristics, battery information parameters, unidirectional/bidirectional EVs generating N number of random strategies under response constraints.
4) Output the evolutionarily stable strategy for each EV according to the solution method introduced in Section 4.3.
5) Based on the response capability evaluation of individual EVs, response capability of EVA is obtained by aggregation. EVA participates in the electricity market bidding based on the result of response capability evaluation, and finally determines the winning capacity and winning price by gaming with other interested entities in the market. EVA issues the charging-discharging price during DR time period to EVs based on the winning price to motivate EV users to participate in DR.
6) EVA responds to the scheduling instruction
7) Filter i number of EVs dispatched in the response by condition, calculate the aggregated response capability of EVA, determine whether the relative error between the response instruction and the scheduling target instruction satisfies less than a constant
8) Update the status information of the EVs according to the regulation of the EVA, including the charging-discharging states and SOC values, and update the response capability of the EVA at time
9) Determine by

FIGURE 4. Response capability evaluation flow chart of EVA.
The number of EVs
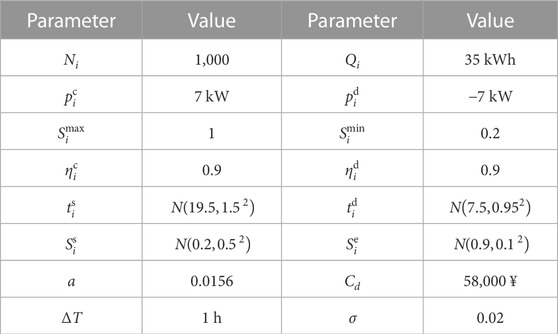
TABLE 1. Main parameters.
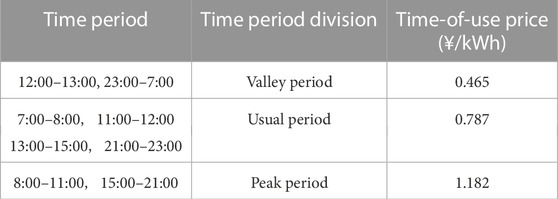
TABLE 2. The peak-valley time-of-use electricity price.
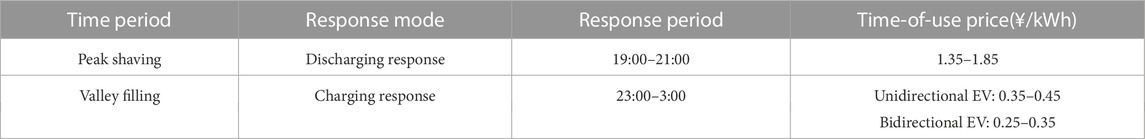
TABLE 3. Demand response period and electricity price range.
The focus of this paper is to evaluate the response capability of the EVA. It is assumed that after the EVA participates in the electricity market bid bidding, the incentive price issued for EVs during the DR time period based on the winning price is as follows: ¥0.4/kWh for unidirectional EV charging; ¥0.3/kWh for bidirectional EV charging and ¥1.5/kWh for discharging. In this paper, private cars have a long parked time, so the percentage of inelastic EVs is small. It is reasonable to assume that all EVs governed by EVA are unidirectional EVs or bidirectional EVs.
The 1,000 EVs are abstracted into 1,000 EV populations with the same travel characteristics, and the evolutionarily stable strategies of the 1,000 EVs are solved separately based on the evolutionary game model constructed in Section 4. For EVs with different response types, the set of 2,000 groups of charging-discharging power strategies and the initial selection ratio
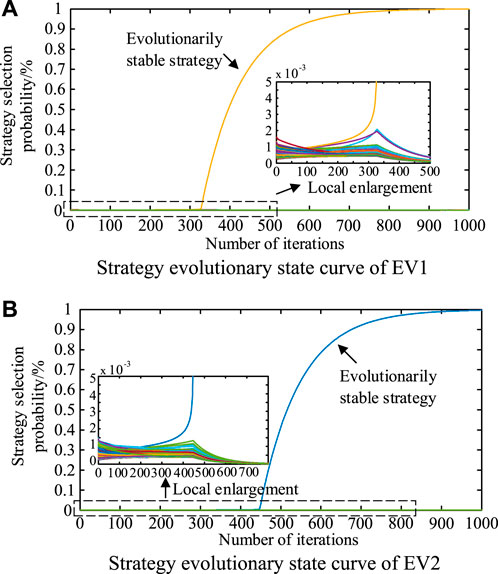
FIGURE 5. Strategy evolutionary state curve of EVs. (A) Strategy evolutionary state curve of EV1. (B) Strategy evolutionary state curve of EV2.

TABLE 4. EV1 and EV2 travel behaviors and evolutionarily stable strategies.
As can be seen from Figure 5, in the process of evolutionary game, the selection probability of only one set of strategy for each EV increases and gradually converges to 1, while the selection probability of other strategy sets gradually converges to 0. The strategy with the selection probability gradually converges to 1 is the evolutionarily stable strategy that EV finally chooses under the changing game environment. As shown in Figure 6 and Table 4, the average payment cost of EV population decreases with the increase of the number of iterations as the evolutionary game proceeds, and reaches stability at the game equilibrium, when the average payment cost of EV1 and EV2 populations are ¥15.8 and ¥7.2 respectively, indicating that EV will modify its own charging and discharging strategy with the goal of optimal utility function.
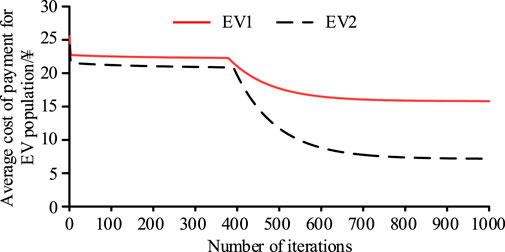
FIGURE 6. The average payment cost evolutionary curve of EVs.
The payment cost for 1,000 EVs with their respective evolutionarily stable strategies is shown in Figure 7. As can be seen from Figure 7, the payment cost of bidirectional EVs is lower compared to unidirectional EVs due to the lower incentive price of charging for bidirectional EVs and the discharge compensation when discharging. In addition, compared to the disordered charging strategy (EVs are charged to the expected power at rated power when they are connected to the grid), the charging cost of EVs with the evolutionarily stable strategy are all significantly lower, and there will even be some bidirectional EVs with positive benefits due to their participation in DR.
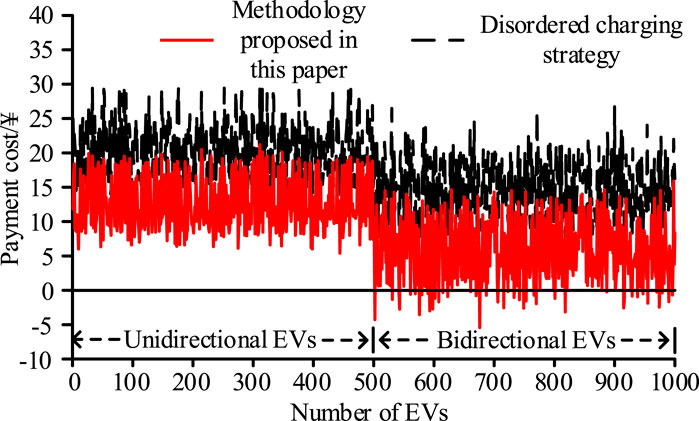
FIGURE 7. Charging cost comparison of EVs.
The response capability of EVA is its adjustable range of power based on the baseline power. For display convenience, the regulation down response capability of the following result analysis is shown as positive and the regulation up response capability is shown as negative.
Most of the current EVA response capability evaluation methods treat EVs as directly controlled loads, ignoring the autonomy of EV users’ decision-making behavior. However, in realistic scenarios, EVA and EV users are different interest entities with different optimization goals in their respective decision-making processes. When evaluating the actual response capability of EVA, ignoring the autonomy of EV decision-making behavior may lead to overly idealized evaluation results.
The response capabilities of EVA based on different evaluation methods are compared below.
Proposed method: use evolutionary game theory to analyze the decision behavior of EV users in real-world scenarios and evaluate response capability of EVA on this basis.
Comparison method: EVs is considered as directly controlled loads, i.e., the method adopted by (Wu et al., 2018; Xu et al., 2023).
The response capability of EVA under different evaluation methods is shown in Figure 8.
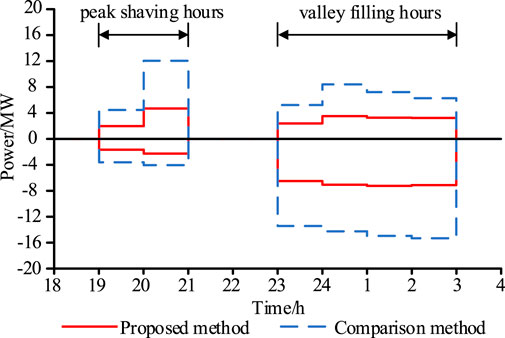
FIGURE 8. Comparison of response capability under different evaluation methods.
As can be seen from Figure 8, the EVA response capability obtained by the comparison method is significantly larger, which is due to the over-idealization of the evaluation results caused by treating EV as a fully controllable load when evaluating the response capability of EVA. In the actual scenario, EVA does not necessarily have full control of EVs, therefore, the response capability of EVA obtained by the comparison method is not in line with the actual situation, and EVA may suffer large losses when bidding in the electricity market based on this evaluation results.
In the actual scenario, ISO issues DR periods beforehand, EVA needs to evaluate the response capability under a given time period. To compare EVA’s response capability under different time periods, the following three scenarios are set:
Scenario 1 (scenario in this paper): peak shaving period: 19:00–21:00, valley filling period: 23:00–3:00.
Scenario 2: peak shaving period: 19:00–22:00, valley filling period: 23:00–3:00.
Scenario 3: peak shaving period: 19:00–23:00, valley filling period: 23:00–3:00.
The comparative analysis of EVA’s response capability under different DR time periods is shown in Figure 9. From Figure 9, it can be seen that EVA has greater regulation down response capacity during peak shaving hours and greater regulation up response capacity during valley filling hours, which is due to the autonomy of EV decision-making considered when evaluating response capability of EVA. EV users will choose to discharge at high prices and charge at low prices for their own economic benefits, more EVs are in discharge state during peak shaving hours and the baseline power is negative, so EVs will have a greater regulation up response capability, while the opposite is observed during valley filling hours. In addition, it can be seen from Figure 9 that the response capability of EVA under different time periods differs if the actual scenario needs to extend the peak shaving DR period, because the number of EVs connected under different time periods is different from their charging-discharging states and SOCs. EVA only needs to issue DR time periods and incentive prices to evaluate the response capability of EVA under different given DR time periods based on the model built in this paper.
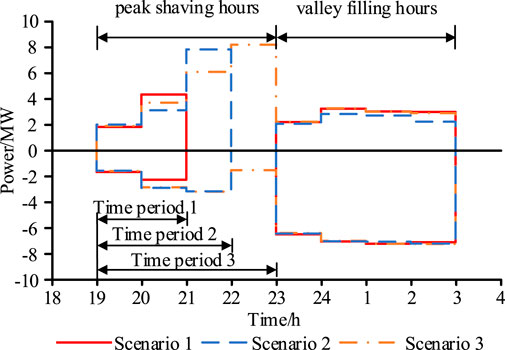
FIGURE 9. Comparison of response capability under different time periods.
The charging-discharging incentive price affects the EVA’s response capability during the DR period. In order to compare the EVA’s response capability under different incentive prices, the following 2 scenarios are set:
Scenario 1 (scenario in this paper): the charging price is ¥0.4/kWh for unidirectional EV, the charging price is ¥0.3/kWh and the discharging price is ¥1.5/kWh for bidirectional EV.
Scenario 2: the charging price is ¥0.35/kWh for unidirectional EV, the charging price is ¥0.25/kWh and the discharging price is ¥1.8/kWh for bidirectional EV.
The comparative analysis of the response capability of EVA under different incentive prices is shown in Figure 10. From Figure 10, it can be seen that EVA has larger regulation down response capability in peak shaving hours and larger regulation up response capability in valley filling hours under scenario 2 compared to scenario 1. This is due to the lower incentive charging price and higher incentive discharging price given in Scenario 2. The baseline power of EVA shows a more obvious buying low and selling high characteristics during peak shaving and valley filling hours, and the different baseline power of EVA in DR hours leads to different response capability of EVA. However, the difference of EVA’s response capability in the two scenarios is not large. EVA should reasonably set the charging-discharging incentive price according to the scheduling requirements in order to avoid blindly increasing the incentive price to affect its own revenue.
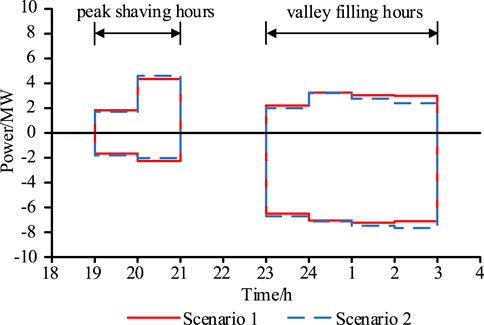
FIGURE 10. Comparison of response capability under different incentive prices.
To compare the response capability of EVA under different types of EV percentages, the following three scenarios are set:
Scenario 1: bidirectional EV percentage of 100%.
Scenario 2 (scenario in this paper): unidirectional EV and bidirectional EV percentage of 50% each.
Scenario 3: unidirectional EV percentage of 100%.
The comparative analysis of EVA’s response capability under different types of EV percentage is shown in Figure 11. From Figure 11, it can be seen that with the increase of bidirectional EV percentage, the regulation up response capability of EVA increases significantly. Therefore, in the system with shortage of regulation up response capability, corresponding incentives can be developed to mobilize the EV users’ discharge enthusiasm and increase the bidirectional EV percentage.
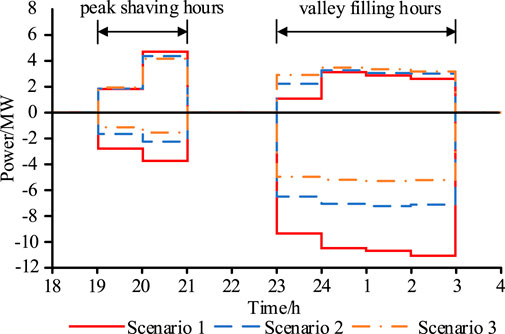
FIGURE 11. Comparison of response capability under different types of EV percentage.
The dynamic update of EVA’s response capability in response to ISO scheduling instructions is shown in Figure 12. As can be seen from Figure 12, EVA can accurately track the scheduling target instructions issued by ISO and realize the dynamic update of EVA’s response capability. It is worth noting that due to the short DR response period, EVA participation in DR will not reach its own capacity boundary, so the change of response capability boundary is not obvious and EVA can play the role of providing short time power support for the system.

FIGURE 12. Dynamic update of EVA’s response capability.
In this paper, a response capability evaluation model of EVA based on the idea of evolutionary game and response anticipation is proposed, and the validity of the model is verified by simulation, and the main conclusions obtained are as follows:
(1) Considering EV users as highly autonomous individuals with “bounded rationality” and “limited information”, an evolutionary game model with multi-strategy sets of EVs is constructed. On this basis, the response capability of EVs before participating in DR is evaluated, avoiding the over-idealized results of EVA’s response capability evaluation caused by ignoring the autonomy of EV decision-making behavior.
(2) EVA’s response capability is affected by the DR time period window, charging-discharging incentive price and the percentage of different types of EVs to different degrees. Based on the model built in this paper, EVA’s response capability can be accurately evaluated under different scenarios, and the evaluation results can be used as the basis for EVA to participate in electricity market bidding.
(3) A regulation strategy is proposed for EVA to generate EV response priority queue according to RTM and SOC indexes. Based on the idea of response anticipation, the response capability of EVA is dynamically updated after participating in DR, and the simulation results show that EVA can accurately track the scheduling target instructions issued by ISO and can play the role of providing short-time power support for the power system.
The focus of the follow-up research is to study the optimization strategy of EVA to participate in the electricity market based on the proposed response capability evaluation model, in order to achieve win-win and coordinated development among ISO, EVA and EV users.
The raw data supporting the conclusion of this article will be made available by the authors, without undue reservation.
XX: methodology, conception, writing—review and editing, ZM: project administration and supervision, ZZ: software, writing, and formal analysis, LJ: software and data analysis. All authors contributed to the article and approved the submitted version.
This work was supported by the Research and Application of Key Technologies of Virtual Power Plant under Electricity Market Environment (CHDKJ21-01-107), and by the National Key R&D Program of China (2018YFE0122200).
LJ was employed by Nanjing SAC Power Grid Automation Co., Ltd.
The remaining authors declare that the research was conducted in the absence of any commercial or financial relationships that could be construed as a potential conflict of interest.
All claims expressed in this article are solely those of the authors and do not necessarily represent those of their affiliated organizations, or those of the publisher, the editors and the reviewers. Any product that may be evaluated in this article, or claim that may be made by its manufacturer, is not guaranteed or endorsed by the publisher.
Abapour, S., Mohammadi-Ivatloo, B., and Hagh, M. (2019b). A bayesian game theoretic based bidding strategy for demand response aggregators in electricity markets. Sustain. Cities Soc. 54, 101787. doi:10.1016/j.scs.2019.101787
Abapour, S., Mohammadi-Ivatloo, B., and Hagh, M. (2019a). Robust bidding strategy for demand response aggregators in electricity market based on game theory. J. Clean. Prod. 243 (1), 118393. doi:10.1016/j.jclepro.2019.118393
Cai, G., Jiang, Y., Huang, N., Yang, D., Pan, X., and Shang, W. (2023). Large-scale electric vehicles charging and discharging optimization scheduling based on multi-agent two-level game under electricity demand response mechanism. Proc. CSEE 43 (04), 85–99. doi:10.13334/j.0258-8013.pcsee.212528
Cheng, L., Chen, Y., and Liu, G. (2022). 2PnS-EG: A general two-population n-strategy evolutionary game for strategic long-term bidding in a deregulated market under different market clearing mechanisms. Int. J. Electr. Eng. 142, 108182. doi:10.1016/j.ijepes.2022.108182
Cheng, L., Liu, G., Huang, H., Wang, X., Chen, Y., Zhang, J., et al. (2020a). Equilibrium analysis of general N-population multi-strategy games for generation-side long-term bidding: An evolutionary game perspective. J. Clean. Prod. 276, 124123. doi:10.1016/j.jclepro.2020.124123
Cheng, L., Yang, R., Liu, G., Wang, J., Chen, Y., Wang, X., et al. (2020b). Muti-population asymmetric evolutionary game dynamics and its applications in power demand-side response in smart grid. Proc. CSEE 40 (S1), 20–36. doi:10.13334/j.0258-8013.pcsee.200930
Cheng, L., Yin, L., Wang, J., Shen, T., Chen, Y., Liu, G., et al. (2021). Behavioral decision-making in power demand-side response management: A multi-population evolutionary game dynamics perspective. Int. J. Electr. Eng. 129, 106743. doi:10.1016/j.ijepes.2020.106743
Cheng, L., and Yu, T. (2019a). A new generation of ai: A review and perspective on machine learning technologies applied to smart energy and electric power systems. Int. J. Energy Res. 43, 1928–1973. doi:10.1002/er.4333
Cheng, L., and Yu, T. (2019b). Smart dispatching for energy internet with complex cyber- physical- social systems: A parallel dispatch perspective. Int. J. Energy Res. 43, 3080–3133. doi:10.1002/er.4384
Chukwu, U., and Mahajan, S. (2014). V2G parking lot with PV rooftop for capacity enhancement of a distribution system. IEEE Trans. Sustain. Energy 5 (1), 119–127. doi:10.1109/TSTE.2013.2274601
Deng, R., Yue, X., Huo, D., Liu, Y., Huang, Y., Huang, C., et al. (2020). Exploring flexibility of electric vehicle aggregators as energy reserve. Electr. Power Syst. Res. 184 (3), 106305. doi:10.1016/j.epsr.2020.106305
Fang, D., Zhao, C., and Yu, Q. (2018). Government regulation of renewable energy generation and transmission in China’s electricity market. Renew. Sustain. energy Rev. 45, 775–793. doi:10.1016/j.rser.2018.05.039
Han, B., Lu, S., Xue, F., and Jiang, L. (2019). Day-ahead electric vehicle aggregator bidding strategy using stochastic programming in an uncertain reserve market. IET Gener. Transm. Distrib. 13 (12), 2517–2525. doi:10.1049/iet-gtd.2018.6951
Han, S., Han, S., and Sezaki, K. (2011). Estimation of achievable power capacity from plug-in electric vehicles for V2G frequency regulation: Case studies for market participation. IEEE Trans. Smart Grid 2 (4), 632–641. doi:10.1109/TSG.2011.2160299
Hong, Q., Meng, F., Liu, J., and Bo, R. (2023). A bilevel game-theoretic decision-making framework for strategic retailers in both local and wholesale electricity markets. Appl. Energy 330 (6), 120311. doi:10.1016/j.apenergy.2022.120311
Hu, J., Wu, J., Ai, X., and Liu, N. (2021). Coordinated energy management of prosumers in a distribution system considering network congestion. IEEE Trans. Smart Grid 12 (1), 468–478. doi:10.1109/TSG.2020.3010260
International Energy Agency (2021). Global EV Outlook 2021. [Internet]. Website; Apr [cited 2023 May 12]. Available at: https://www.iea.org/reports/global-ev-outlook-2021.
Lam, A., Leung, K., and Li, V. (2016). Capacity estimation for vehicle-to-grid frequency regulation services with smart charging mechanism. IEEE Trans. Smart Grid 7 (1), 156–166. doi:10.1109/TSG.2015.2436901
Liu, C., Song, Y., Wang, W., and Shi, X. (2023). The governance of manufacturers’ greenwashing behaviors: A tripartite evolutionary game analysis of electric vehicles. Appl. Energy 333, 120498. doi:10.1016/j.apenergy.2022.120498
Liu, H., Lian, H., Ge, S., Zhang, K., Tang, C., Zhao, H., et al. (2017). Removal of integrated hepatitis B virus DNA using CRISPR-cas9. Auto. Elect. Power Syst. 41 (8), 91–97. doi:10.3389/fcimb.2017.00091
Meng, F., and Zeng, X. (2016). A profit maximization approach to demand response management with customers behavior learning in smart grid. IEEE Trans. Smart Grid 7 (3), 1516–1529. doi:10.1109/TSG.2015.2462083
Shariatzadeh, F., Mandal, P., and Srivastava, A. (2015). Demand response for sustainable energy systems: A review, application and implementation strategy. Renew. Sustain. energy Rev. 45, 343–350. doi:10.1016/j.rser.2015.01.062
Weibull, J. (2015). Evolutionary game theory. Translated by Wang, Y. Shanghai: Shanghai People’s Publishing House, 30–59.
Wu, F., Yang, J., Zhan, X., Liao, S., and Xu, J. (2021). The online charging and discharging scheduling potential of electric vehicles considering the uncertain responses of users. IEEE Trans. Power Syst. 36 (3), 1794–1806. doi:10.1109/TPWRS.2020.3029836
Wu, J., Xue, Y., Xie, D., Yue, D., Wen, F., Zhao, J., et al. (2018). Magnetic resonance imaging and molecular features associated with tumor-infiltrating lymphocytes in breast cancer. Auto. Elect. Power Syst. 42 (13), 101–107+168. doi:10.1186/s13058-018-1039-2
Xu, X., Mi, Z., Yu, S., Zhan, Z., and Ji, L. (2023). Spatial-temporal response capability probabilistic evaluation method of electric vehicle aggregator based on trip characteristics modelling. IET Gener. Transm. Distrib. 17 (9), 2192–2206. doi:10.1049/gtd2.12788
Zhang, B., and Kezunovic, M. (2016). Impact on power system flexibility by electric vehicle participation in ramp market. IEEE Trans. Smart Grid 7 (3), 1285–1294. doi:10.1109/TSG.2015.2437911
Zhang, H., Hu, Z., Xu, Z., and Song, Y. (2017). Evaluation of achievable vehicle-to-grid capacity using aggregate PEV model. IEEE Trans. Power Syst. 32 (1), 784–794. doi:10.1109/TPWRS.2016.2561296
Zhang, Y., Mu, Y., Jia, H., Wang, M., Zhou, Y., and Xu, Z. (2019). Response capability evaluation model with multiple time scales for electric vehicle virtual power plant. Auto. Elect. Power Syst. 43 (12), 94–103. doi:10.7500/AEPS20180731009
Zheng, Y., Yu, H., Shao, Z., and Jian, L. (2020). Day-ahead bidding strategy for electric vehicle aggregator enabling multiple agent modes in uncertain electricity markets. Appl. Energy 280 (2), 115977. doi:10.1016/j.apenergy.2020.115977
Zheng, Z., Zhao, X., Wang, S., Yu, Q., Zhang, H., Li, Z., et al. (2023). Extension coordinated control of distributed-driven electric vehicles based on evolutionary game theory. Control. Eng. Pract. 137, 105583. doi:10.1016/j.conengprac.2023.105583
Keywords: electric vehicle, electric vehicle aggregator, evolutionary game, response anticipation, response capability evaluation
Citation: Xu X, Mi Z, Zhan Z and Ji L (2023) Response capability evaluation model of electric vehicle aggregator based on evolutionary game and response anticipation. Front. Energy Res. 11:1225327. doi: 10.3389/fenrg.2023.1225327
Received: 19 May 2023; Accepted: 12 July 2023;
Published: 28 July 2023.
Edited by:
Ji Wu, Hefei University of Technology, ChinaReviewed by:
Lefeng Cheng, Guangzhou University, ChinaCopyright © 2023 Xu, Mi, Zhan and Ji. This is an open-access article distributed under the terms of the Creative Commons Attribution License (CC BY). The use, distribution or reproduction in other forums is permitted, provided the original author(s) and the copyright owner(s) are credited and that the original publication in this journal is cited, in accordance with accepted academic practice. No use, distribution or reproduction is permitted which does not comply with these terms.
*Correspondence: Xiangchu Xu, eHhjbmNlcHVAZ21haWwuY29t
Disclaimer: All claims expressed in this article are solely those of the authors and do not necessarily represent those of their affiliated organizations, or those of the publisher, the editors and the reviewers. Any product that may be evaluated in this article or claim that may be made by its manufacturer is not guaranteed or endorsed by the publisher.
Research integrity at Frontiers
Learn more about the work of our research integrity team to safeguard the quality of each article we publish.