 Kezhong Lv1
 Linglan Zhou
 Hong Gao
94% of researchers rate our articles as excellent or good
Learn more about the work of our research integrity team to safeguard the quality of each article we publish.
Find out more
ORIGINAL RESEARCH article
Front. Energy Res., 25 September 2023
Sec. Nuclear Energy
Volume 11 - 2023 | https://doi.org/10.3389/fenrg.2023.1224306
This article is part of the Research TopicComplex Flow and Heat Transfer in Advanced Nuclear Energy systemsView all 6 articles
The nucleate subcooled boiling is an efficient heat transfer form and plays an important role in many cooling applications. The size and distribution of bubbles in subcooled boiling have considerable influence on boiling heat transfer. In this paper, subcooled flow boiling experiment is carried out to investigate the nucleation point density and detachment frequency of bubbles under different system pressure, and the test section is full transparent. Since the whole body of the test section is composed of transparent materials, it can be observed from different directions to obtain high quality images. A bubble tracking algorithm has been developed, which can effectively determine the diameter and position of detached bubbles, thereby inferring the nucleation point density and detachment frequency of bubbles. Besides, the distinctive properties of bubble nucleation within narrow rectangular channel are verified by comparing bubble detachment diameters with existed models. Finally, models for bubble nucleation point and detachment frequency under different operating conditions were proposed and verified through experimental results.
Nucleate subcooled boiling, as a highly efficient heat transfer method, has a wide range of applications in nuclear reactors, power electronics, aerospace, cryogenic refrigeration, chemical industry and many other broad fields. For example, in conventional nuclear reactors, subcooled boiling is required in part of the coolant channel of the pressurized water reactor to increase the coolant outlet temperature and thus improve the heat transfer capacity of the reactor. The mechanism of subcooled boiling is extremely complex. Many scholars have tried to develop different models to explain the relationship between the kinetic behavior of vapor bubbles and boiling heat transfer.
Compared with conventional flow paths, narrow rectangular channel have advantages such as compact structure, high heat transfer per unit volume, high density of heat flow in the flow path, and good safety, so the narrow rectangular channel is widely applied in high performance plate heat transfer elements related to the boiling heat transfer field in nuclear reactors. The narrow rectangular channel has a limiting effect on the vapor bubbles. Not only the flow characteristics, bubble growth process and detachment behavior of subcooled boiling in narrow rectangular channel are significantly different from those of conventional channels, but also the disturbance phenomenon and instability caused by bubble behavior can affect the boiling heat transfer efficiency and the safe operation of the circulating system. Secondly, the effects of the mass flow rate and pressure in the narrow rectangular channel on the vapor bubbles are not clear. Therefore, it is crucial to study the vapor bubble evolution behavior in subcooled flow boiling in narrow rectangular channel for better design of nuclear reactor structures.
The research on pool boiling by Rohsenow (Rohsenow, 2022) and Chen (Chen, 1966) in the past half century has laid the foundation for the study of subcooled flow boiling. Nowadays, a large number of experimental and theoretical studies on flow boiling have been carried out. The nucleation point density and the bubble detachment frequency are important characteristic parameters that determine the heat carried away, when the bubble rises and detaches from the heated surface (Basu et al., 2002). Currently, the measurement of nucleation sites in subcooled boiling is mainly done by determining the number of vapor bubble formation locations on the boiling wall from images captured by high-speed cameras. The nucleation site density of the vapor bubbles is obtained by dividing the number of locations by the area on which the high-speed camera is focused. In the high-speed camera measurement technique, it is difficult to determine the nucleation point location from just one photograph. A corresponding video recording is required to determine the nucleation point location. In most of the literature, the nucleation point density is obtained using manual counting calculations (Del Valle and Kenning, 1985; Basu et al., 2002). Recently, Ooi et al. (Ooi et al., 2018) studied the wall nucleation properties based on a high-speed video camera and gained new insight into the nucleation point density and vapor bubble detachment frequency. Kim et al. (Kim et al., 2018) investigated the effect of nucleation point location on the vapor bubble behavior using a high-speed video camera.
In previous studies, relationships between vapor bubble nucleation point density and wall heat flux density qw, and wall superheat ΔTw were proposed (Basu et al., 2002). Gaertner and Westwater (Gaertner, 1959) reported a relationship between nucleation point density and wall heat flux with a correlation of Na-qn w. In studies by Sultan and Judd (Sultan and Judd, 1978), Rallis and Jawurek (Rallis and Jawurek, 1964) and Gaertner (Gaertner, 1965) reported similar relationships. Lemmert and Chawla (Lemmert and Chawla, 1974) found a functional dependence between the density of active nucleation sites and wall superheat with a correlation of Na-ΔTn w. Previous studies on vapor bubble detachment frequency have focused on pool boiling (Cole, 1960; Zuber, 1963; Ivey, 1967; Kim et al., 2006). It is usually correlated with the vapor bubble detachment diameter, and there have been some studies on vapor bubble detachment frequency for subcooled boiling. Situ et al. (Situ et al., 2008) developed a dimensionless vapor bubble detachment frequency for subcooled flow boiling by performing a dimensionless analysis of the available data. Brooks and Hibiki (Brooks and Hibiki, 2015) developed a mathematical formulation of the vapor bubble detachment frequency based on the available experimental values.
In general, most studies on nucleation point density and vapor bubble detachment frequency have focused on pool boiling. To better understand the effects of wall superheat, flow rate, subcooling and system pressure on nucleation point density and vapor bubble detachment frequency in plate fuel elements of nuclear power systems, an experiment was conducted to closely observe the vapor bubble behavior of subcooled flow boiling in a narrow rectangular channel.
Since the initial experimental data for vapor bubble behavior analysis are video recordings, the use of manual processing of experimental videos has the disadvantages of inefficient analysis, insufficient accuracy, and low error tolerance. In order to solve the problems of manual processing, the development of a corresponding vapor bubble tracking algorithm has significant advantages in terms of efficient and accurate analysis of vapor bubble evolution behavior, improved error tolerance, and good visualization, as well as promoting the improvement of automation in this field. Besides, by adjusting some parameters in the algorithm, it is more convenient to effectively fit the video images under different working conditions. Therefore, the use of vapor bubble tracking algorithm has an important role in the study of the evolutionary behavior of vapor bubbles in narrow rectangular channel with subcooled flow boiling.
With the rapid development of optical and computer technologies, the application of digital image analysis to detect vapor bubbles in various scenes has gradually become a research hotspot in this field. The vapor bubble tracking algorithm in this paper will also be designed and developed based on the image analysis method. The image analysis method has the advantage of being non-intrusive and transient, as long as a suitable vapor bubble image acquisition device is used to capture and process the captured vapor bubble images, the presence or absence of vapor bubbles in the scene can be determined based on the grayscale, shape, and texture distribution of the image, and the related characteristic parameters of the vapor bubbles can be obtained (Shi, 2020), and many methods have been proposed by domestic and foreign scholars. In 2005, Zhang et al. (Zhang, 2005) used local smoothing and thresholding to remove noise from the vapor bubble images, and then used grayscale center discrimination to detect the vapor bubbles in the images. 2011, Shao et al. (Shao, 2011) used inverse color, low-pass filtering, and reduced the grayscale level to pre-process the vapor bubble images, and then used the watershed algorithm based on morphological theory to segment the vapor bubble images, and better extracted the vapor bubbles from the air-doped water flow images. In 2015, Yang (Yang, 2015) proposed to use image subtraction and median filtering to obtain vapor bubbles in gas-liquid two-phase flow experiments, and use the improved watershed algorithm to segment the sticky bubbles. 2018, Du (Du, 2018) proposed a two-dimensional wavelet transform-based edge detection algorithm and applied it to three-phase fluidized bed vapor bubble detection, and the algorithm obtained good detection results in both clear and turbid water conditions. In 2019, Qin et al. (Qin, 2019) proposed an improved watershed algorithm for segmentation of vapor bubble cluster images, which can segment adherent bubbles to a certain extent, but the problem of difficult segmentation still exists for bubbles with high overlap and severe adherence; in the same year, Zhang et al. (Zhang, 2019) proposed a method for underwater vapor bubble image recognition based on Zemike moments and gray scale calculation, which extracts the vapor bubbles from The method extracts and discriminates the feature information of the target from both shape and grayscale, and can distinguish the vapor bubbles from the solid suspended particles in water, which improves the vapor bubble recognition accuracy with high accuracy and applicability.
In summary, there are relatively few studies on the vapor bubble behavior of subcooled flow boiling in a narrow rectangular channel, and more sophisticated image analysis and processing methods are available, so it is necessary to carry out a vapor bubble tracking algorithm to realize the study of the vapor bubble evolution behavior in a narrow rectangular channel. In this paper, we study the vapor bubble dynamics by conducting subcooling boiling experiments on a vertical narrow rectangular section. We use a high-speed camera to photograph the vapor bubble evolution behavior from the bottom of the bubble (i.e., facing the transparent narrow rectangular channel), and then use a vapor bubble tracking algorithm to automatically identify the vapor bubbles and extract the feature parameters to quantitatively discuss the evolution of the maximum diameter of boiling vapor bubbles in the narrow rectangular flow channel.
This experiment uses a closed-loop experimental setup for subcooled boiling flow experiments. The schematic layout of the facility is shown in Figure 1. A centrifugal pump was used to drive the circulation of deionized water in the facility, and the flow rate was measured with an orifice flow meter.
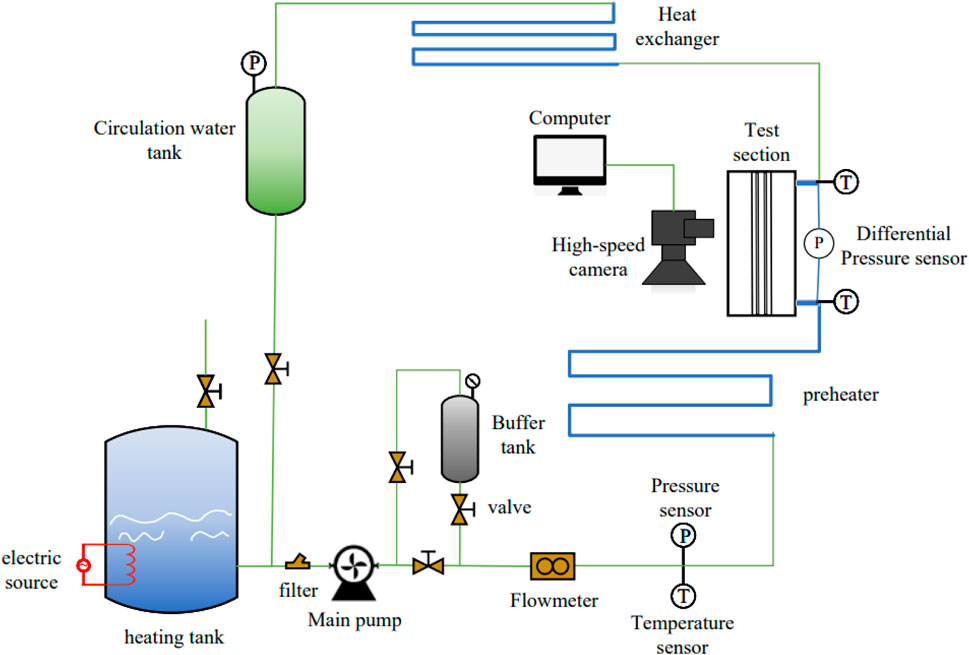
FIGURE 1. Experimental setup diagram.
Error after calibration of flow meter is ±1.53% of the reading with a maximum range of 2000 kg-(m2 -s)−1. The liquid subcooling is controlled by a preheater located upstream of the test section. The water temperature at the inlet and outlet of the test section was measured using t-type thermocouples with an accuracy of ±1°C. The system pressure was measured using a pressure transducer with an accuracy span of 25 kPa ± 0.067%.
Since the polycarbonate resin material has excellent processability and heat resistance, PC (polycarbonate resin) was chosen as the substrate material for the test section. A rectangular flow channel of size 300 mm × 20 mm × 2 mm was formed between the optical liquid glass and the substrate, and Figure 2 shows the flow channel test cross-section. The sapphire glass coated with ITO (Indium Tin Oxide) conductive film was used as a heating panel and a visual observation window to observe the interaction between the vapor bubbles from the bottom of the vapor bubble.
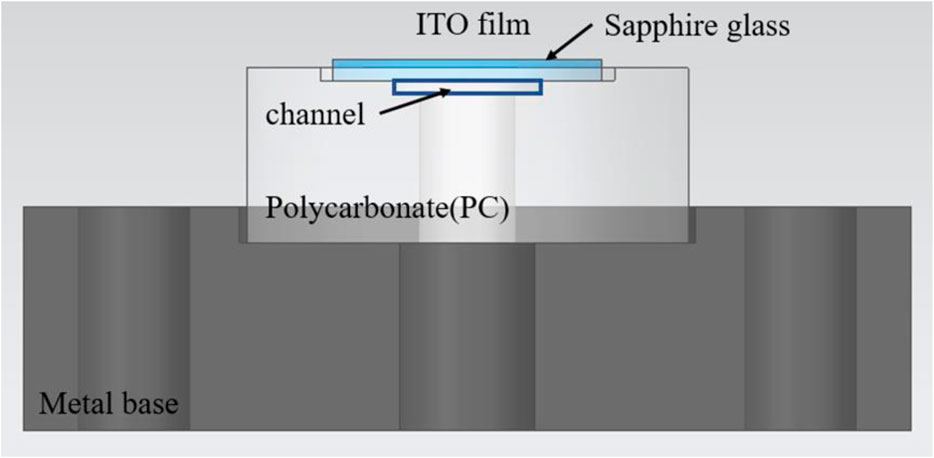
FIGURE 2. Flow channel test cross section.
The experimental body is equipped with three thermal sensors for detecting the temperature at the inlet, midsection and outlet in the narrow rectangular channel. The heat dissipation test was carried out by heat balance experiment.
The high-speed camera records the process of sliding vapor bubble agglomeration with an efficiency of 10,000 fps/sec. The lens was positioned perpendicular to the viewing window to minimize the effect of light refraction. An adjustable 150 W light source was used to illuminate the back side of the test section. The resolution of the camera is 384 × 680 pixels, as shown in Figure 3 (Figure 3 is a screenshot of one of the frames of the video taken by the high-speed camera under a particular operating condition). In Figure 3, the long black rectangles on the left and right sides are the boundaries of the narrow rectangular channel, and the vapor bubbles generated in this part are not generated by the boiling of the supercooled flow, but by the lower temperature of the wall, so that the effective observation area is about 80% of the shooting area, i.e., 308 × 680 pixels in size (the invalid area is marked by the red border). The typical shooting time is 3.6 s for the same file storage capacity. The camera and lens settings were calibrated to display a resolution of 0.0209 mm/pixel. Ensure that the overall width of the runner is within the visible range of the image when shooting.

FIGURE 3. High-speed camera footage.
The errors associated with the calculated parameters were estimated using error propagation methods. These errors are listed in Table 1.
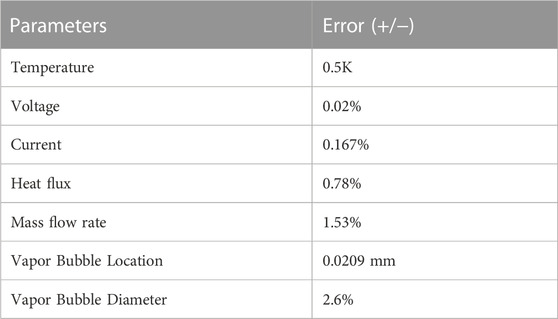
TABLE 1. Measurement estimation error.
The image information was captured by a high-speed camera. A summary of the experimental conditions is shown in Table 2. The behavioral characteristics of boiling vapor bubble agglomeration under different mass flow rate, heat flow density and inlet subcooling conditions were investigated.
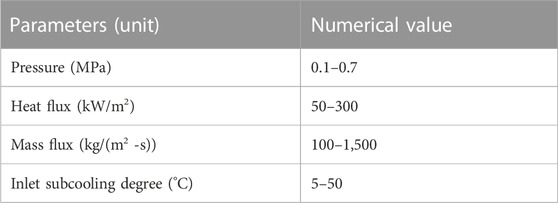
TABLE 2. Test working conditions.
The flow of the tracking algorithm for the analytical processing of the vapor bubbles is shown in Figure 4 below:
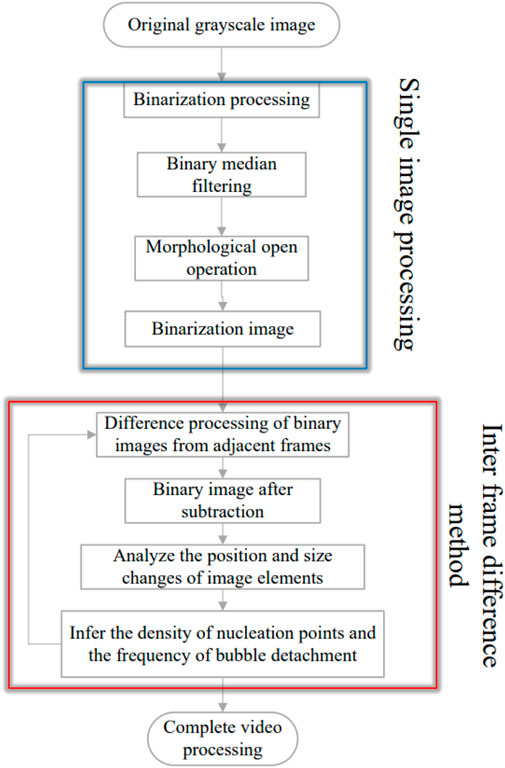
FIGURE 4. Flowchart.
The original experimental data for this study are video files captured by a high-speed camera, and the developed vapor bubble tracking algorithm will also be applied to the video files. The video is essentially a continuous picture, and thus the algorithm will be based on the analysis and processing of a single picture for the video file.
The high-speed camera recording image is shown in Figure 5 (Figure 5 is an intercept of a frame of the video image), and it can be seen that Figure 5 consists of only black, white, and gray, which has a very distinct degree of shades of gray. Figure 5 is a typical grayscale image, which is then binarized.
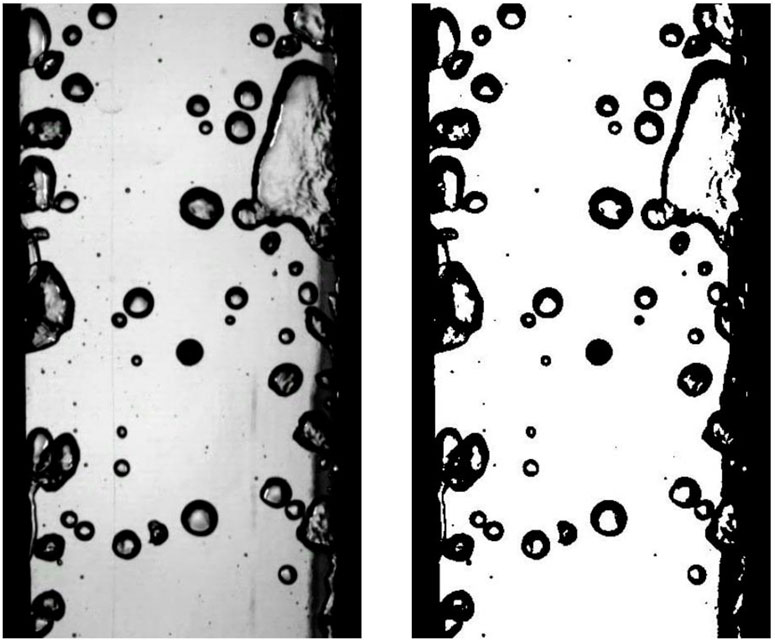
FIGURE 5. Original image and binarized image.
Figure 5 (left) is shown as a grayscale diagram, with the dark part being the vapor bubble or the edge of the bubble and the light part being the fluid or the central part of the bubble, which is binarized without affecting the analysis of the study of the evolutionary behavior of the vapor bubble. Figure 5 (left) is shown in Figure 5 (right) after binarization.
The principle of the binarization process using MATLAB is that each pixel point in the image is converted into a corresponding value according to its gray value. In this case, Figure 5 (left), which is a grayscale image, is saved on a nonlinear scale of 8 bits, with 256 shades of gray, and each pixel is assigned a value in equal percentages according to its grayscale value. Each pixel is assigned a value in equal percentages according to its grayscale value, with a value of 1 for complete black, 0 for complete white, and 0.01 to 0.99 for the rest of the grayscale values. After getting the gray value of each pixel, a threshold L (0 ≤ L ≤ 1) is set to replace the gray value of all pixels with a value greater than L with 1, i.e., black, and the gray value of all pixels with a value less than L with 0, i.e., white. By appropriately adjusting the size of the threshold L, Figure 5 (left) can be transformed into a binarized image with only black and white colors (Figure 5 (right)).
Filtering of images removes the interference of non-essential “noise”. As an image processing algorithm, “median filtering” is based on the principle that each pixel point in the image is first numerized, and then each pixel point in the image is processed and output. The process is to change the pixel value of each original pixel point to the median of the pixel values in the m×n neighborhood of the pixel point corresponding to the original image location contained in the original pixel point. In other words, the pixel values are changed to the median values in the range of m × n around each pixel point. In this experiment, the image is binarized, containing only “0″ and “1″ values, so the median filtered image is still binarized. In order to remove the “noise” accurately, the median filtering iteration can be performed.
By setting the corresponding m and n values through the median filtering process, the impurities containing a small number of pixels in the image can be removed. Figure 6 shows the binarized image after multiple median filtering processes.

FIGURE 6. Median filtered image.
As shown in Figure 6, shows the comparison of the binarized part of the image before and after the median filtering process. Figure 7 (left) shows the binarized image with the median filtering process, and Figure 7 (right) shows the binarized image after the median filtering process, and the most obvious difference between the left and right images is marked in red circles. It can be seen that the number of impurities with small pixel content in the binarized image is significantly reduced after the median filtering process.
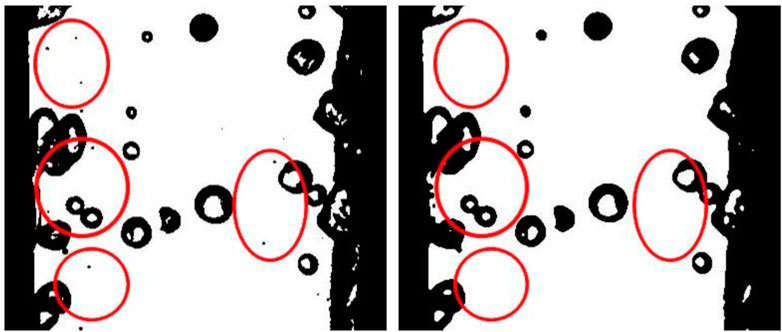
FIGURE 7. Comparison before and after median filtering.
In Figure 6, it can be seen that after the median filtering process, there are still some impurities with a small number of pixels, but if the median filtering process is continued, it is necessary to increase the values of m and n, which could potentially remove the vapor bubbles with a small area all together. In order to avoid removing small vapor bubbles, as well as to remove impurities efficiently, a morphological open operation is performed on the image.
After the morphological open operation, the unclosed vapor bubbles can be connected to further remove the noise in the image to obtain Figure 8. Figure 8 shows the image comparison. Figure 9 (left) shows the binarized image without morphological open operation, and Figure 9 (right) shows the binarized image after morphological open operation processing, and the most obvious part of the difference between the left and right images is marked by red circles. It can be seen that the number of impurities with small pixel content in the binarized image is further reduced after the morphological on operation processing.
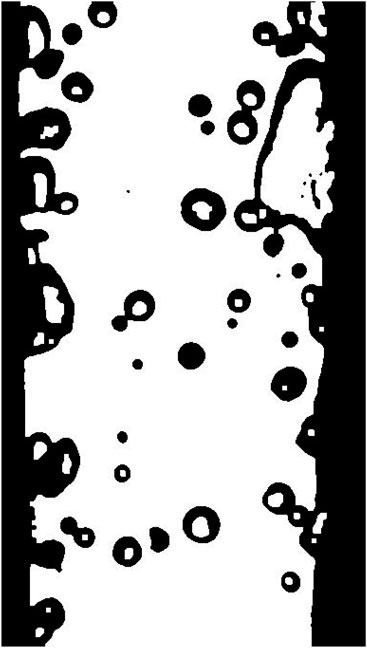
FIGURE 8. Image after morphological opening operation.
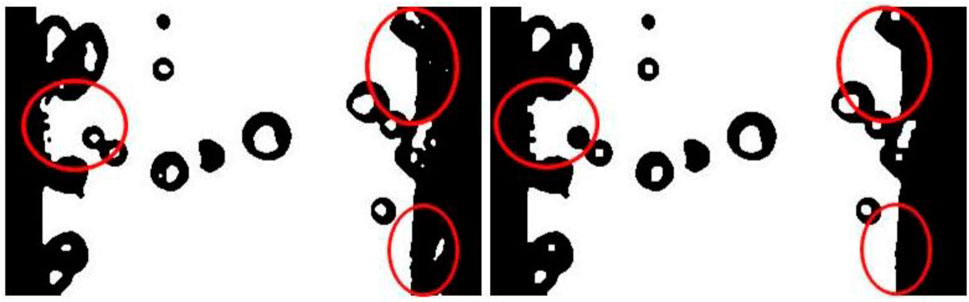
FIGURE 9. Comparison of morphology before and after opening operations.
After the binarization process, median filtering and morphological opening operation, the binarized image of the vapor bubble can be clearly and accurately identified.
In this study, the processing of video files is firstly split into frame by frame image files, and then the preliminary processing of video files is achieved by using the motion relationship between each frame of the moving target (i.e., vapor bubble) and using the single picture processing method, after grayscale processing, binarization processing, binary median filtering and morphological open operation for two adjacent frames.
This study investigates the vapor bubble evolution behavior of subcooled flow boiling in a narrow rectangular channel. The main object of analysis is the vapor bubble nucleation point density and the vapor bubble detachment frequency, both of which are dynamic parameters and thus require processing of the video file. Firstly, the video file is split into frame by frame image files, and then the motion relationship between each frame of the moving target (i.e., the vapor bubble) is used for the initial processing of the video file byusing a single image processing method, after grayscale and binarization processing, binary median filtering, and morphological open operation processing of the two adjacent frames.
In this study, the interframe difference method is chosen to analyze the vapor bubble nucleation point density and vapor bubble detachment frequency, and the SURF algorithm is combined to further improve the accuracy. The interframe difference method and the SURF algorithm will be introduced in the next section with the specific results of the code.
Since the experimental raw video does not have a complex optical ratio environment, the inter-frame differencing method can be used for the analysis and processing of video files. The advantage of the inter-frame differencing method is that it is good for encoding moving objects and can achieve motion detection of multiple moving targets, which is especially suitable for this subject where there may be 40 to 60 vapor bubble nucleation points in one working condition. The principle of the interframe difference method is shown in Figure 10. The specific application steps of the interframe difference method are:
(1) Video frame acquisition: decompose the video into individual frames for frame-by-frame processing.
(2) Frame difference calculation: two adjacent frames (current frame and previous frame) are selected and their pixels are compared point by point. The difference between each pixel in the two frames is calculated, which can be done here by calculating the absolute difference between the pixel values or the square of the difference. The result is a difference image, which represents the difference in pixels between the two frames.
(3) Thresholding: In order to filter out important difference regions between two frames, the difference image needs to be thresholded. By setting a suitable threshold value, the pixels below the threshold in the difference image are set to 0 or other values that do not interfere with the subsequent study (set to 0 in this subject), and the pixels above the threshold are retained.
(4) Moving target extraction: After thresholding, the remaining non-zero pixel regions usually indicate moving objects or regions.
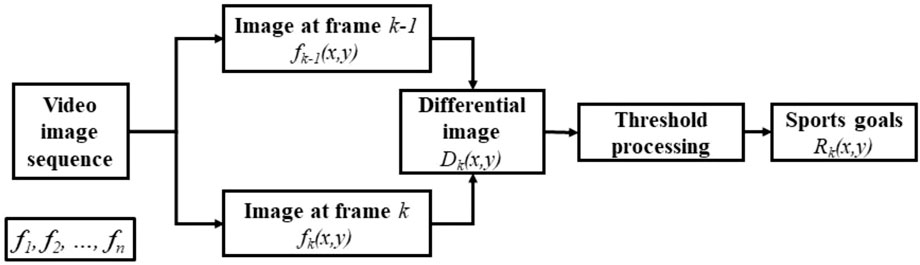
FIGURE 10. Inter-frame differential method schematic.
Specifically to combine this topic, the difference calculation in the principle of inter-frame difference method (Figure 10) will first go through a single image processing method, i.e., grayscale processing, binarization processing, binary median filtering and morphological open operation. Then the thresholding process is performed, and the selected threshold is the value that falls within this interval after certain screening to remove unnecessary vapor bubbles after the difference processing of the two adjacent frames. This value, specifically in the original image, is the difference between the size and position of the vapor bubbles in the two adjacent frames. Based on the size of the difference, the nucleation point of the vapor bubble can be determined, and then the density and detachment frequency of the nucleation point of the vapor bubble can be determined in the whole video file. In the process of using the inter-frame difference method, the annotation of the original video file can be realized, which makes the visualization better. For example, Figure 11A, is the binarized image of a video file after differencing the first two frames, and Figure 11B is the annotation of the difference value in the binarized image after differencing in the latter frame.
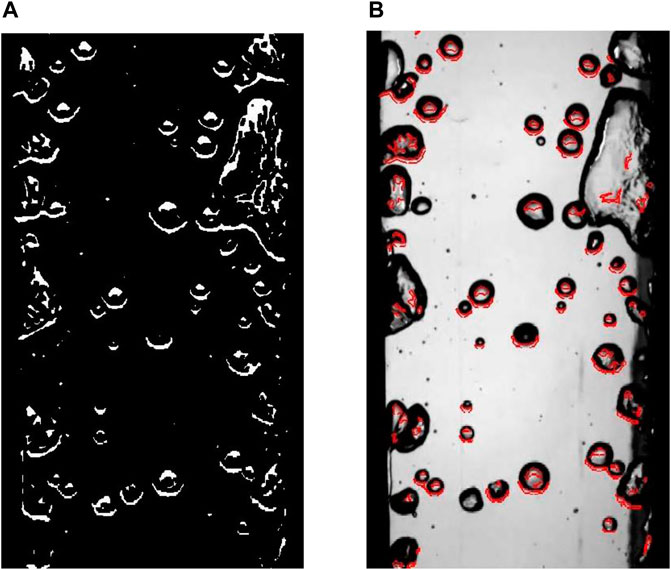
FIGURE 11. (A) Image map after differencing; (B) markers in the original image.
However, the vapor bubbles generated at the nucleation point of the vapor bubble boiling in the supercooled flow within the narrow rectangular channel may not have a significant change in morphology and position for the first few frames of their generation. As shown in Figure 11B, some very obvious vapor bubbles are not labeled, and some narrow rectangular boundary vapor bubbles that do not need to be studied are labeled again. This requires adjusting the matrix size of the differential study to minimize the effect of narrow rectangular channel boundaries. As for the vapor bubbles that are not marked out, this indicates that the vapor bubble nucleation points will not be identified accurately in time by using the inter-frame difference method only. Therefore, in this study, it is necessary to combine other techniques and algorithms in addition to the inter-frame difference method to improve the accuracy and performance.
SURF (Speeded-Up Robust Features) algorithm is an algorithm used in the field of computer vision for image feature extraction and matching. It can be used in MATLAB to process image data and extract stable feature points. The combination of SURF algorithm and inter-frame difference method is beneficial to the accuracy of vapor bubble nucleation point recognition. The specific main application steps and specific principles of SURF algorithm are as follows:
(1) Scale space construction: The SURF algorithm detects feature points by constructing the scale space of an image, using a series of filters at a series of scales.
(2) Key point detection: The SURF algorithm extracts key points by detecting feature points in the image. Local maxima or minima are found in different scale spaces, and these extreme points are usually considered as key points, and the SURF algorithm uses the second-order partial derivative matrix to locate these key points.
(3) Direction assignment: To enhance the determinism of feature points, the SURF algorithm calculates the principal direction for each key point. This is usually done using a histogram of gradient directions calculated for the region surrounding the image.
(4) Feature description: A method based on image integration image is used toaccelerate the computation of feature descriptors in the neighborhood of key points according to their scales and principal directions.
(5) Feature matching: For a given two images, the distance between theircorresponding feature descriptors is first calculated. Then the best feature match needs to be determined by choosing an appropriate threshold to determine whether the distance between the feature descriptors indicates a reliable match.
As shown in Figure 12, it is the image after processing two consecutive frames using the SURF algorithm. As can be seen from the figure, for two consecutive frames, the SURF algorithm can effectively and accurately identify the feature points in the image.
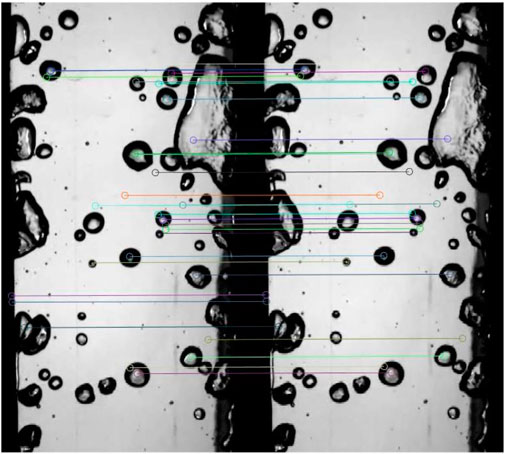
FIGURE 12. SURF algorithm to process and label two consecutive frames.
In this project, the vapor bubble tracking algorithm analyzes the evolutionary behavior of vapor bubbles, i.e., the nucleation point density and detachment frequency of vapor bubbles, by first determining the diameters and relative positions of all the vapor bubbles. After determining the density of vapor nucleation points, all nucleation points are monitored and the number of vapor bubbles generated in the video length interval is counted to obtain the detachment frequency of vapor bubbles in the experimental video. Therefore, determining the number of nucleation points is the key to determine the density of vapor bubble nucleation points and the detachment frequency.
Before the development of the corresponding bubble tracking algorithm, the identification of the bubble nucleation points was done manually. Two software programs, PCC 3.4 and Image-Pro Plus 6.0, were used for the manual identification, and firstly, the working condition data captured by the high-speed camera was re-presented using PCC 3.4 software, as shown in Figure 13. Because in the original visualization data, each condition was recorded for 3.6 s. In the actual processing, only the first 9,000 fps of visualization data, i.e. 0.9 s, was needed. PCC 3.4 was used to process the original visualization data display, and each condition was changed to a 0.9 s AVI file. Next, a “scale” was created using Image-Pro Plus 6.0 software for calibration. The high-speed camera recorded an image with a pixel width of 384 pixel, while the image has black walls on both sides, and the actual flow path width is 2 mm, which corresponds to a calibrated pixel width of 340 pixel as shown in Figure 14.
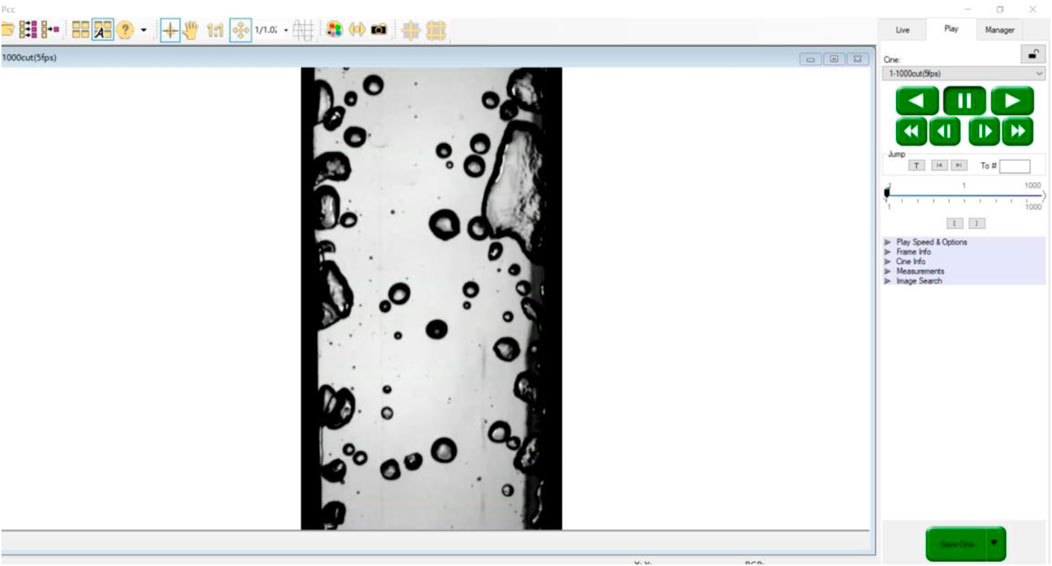
FIGURE 13. PCC 3.4 for visual data processing.
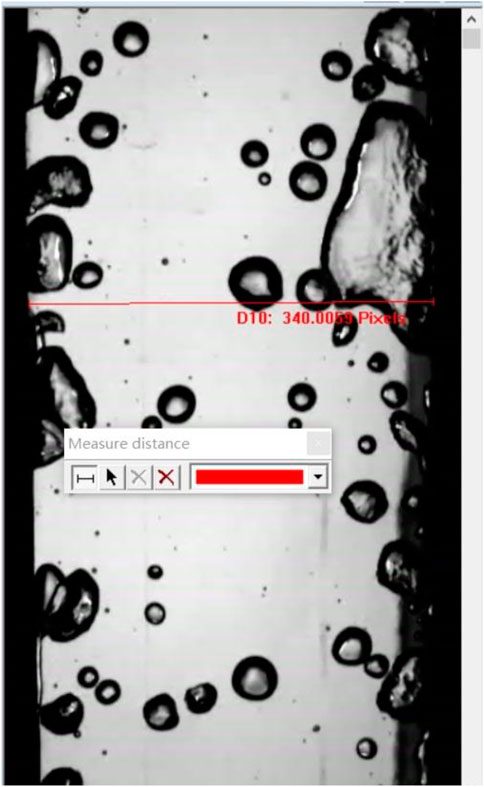
FIGURE 14. Distance calibration in Image-Pro Plus 6.0.
After all the conditions were stored in AVI format at 0.9 s and the “scale” was obtained, the video files corresponding to the studied conditions were then played in Image-Pro Plus 6.0 and marked accordingly. The obtained results are shown in Figure 15 (left). The visualization data was processed using the vapor bubble tracking algorithm and the results obtained are shown in Figure 15 (right). In Figure 15 (right), it can be seen that the algorithm marks the identified nucleation points, and all the red circles in the figure are the nucleation points present in the 0.9 s visualization data for that segment. Once the nucleation points are located, labeling can be achieved for each nucleation point. By counting the number of nucleation points and dividing by the observed area, the density of vapor bubble nucleation points is obtained. By monitoring each nucleation point, the number of vapor bubbles generated at each nucleation point is counted and divided by the count time to obtain the frequency of vapor bubble detachment at that nucleation point.
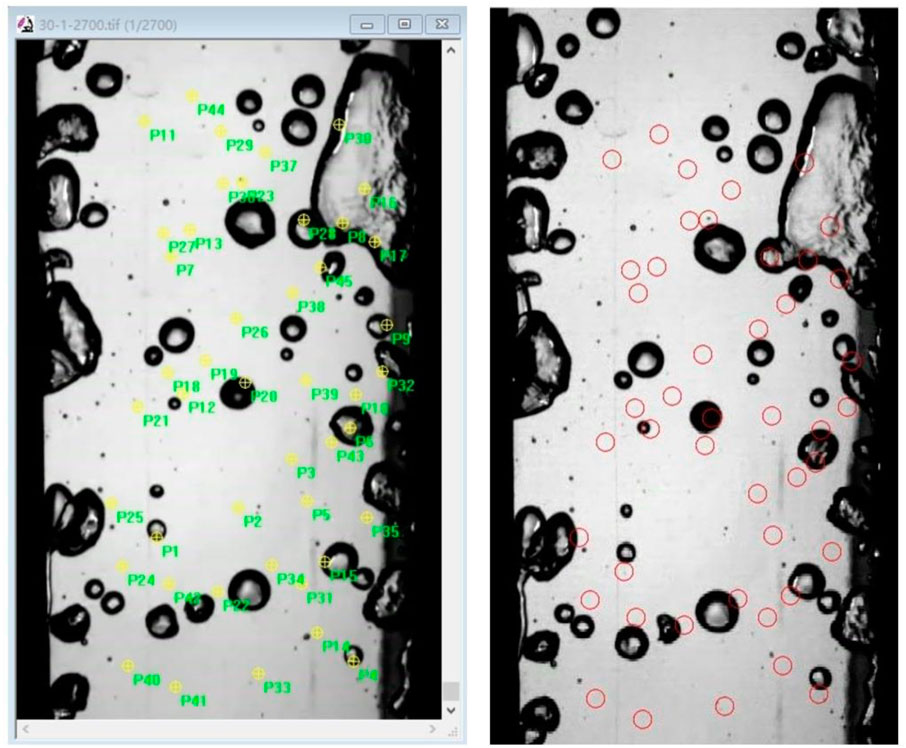
FIGURE 15. Marking of nucleated points by artificial recognition.
In order to verify the accuracy of the vapor bubble tracking algorithm identification, we selected 10 experiments under different working conditions, and the number of nucleation points under these 10 different working conditions, the algorithm identification and manual identification were performed, and the two were compared, and the relative errors of the two were based on the manual identification results. The results are shown in Table 3.
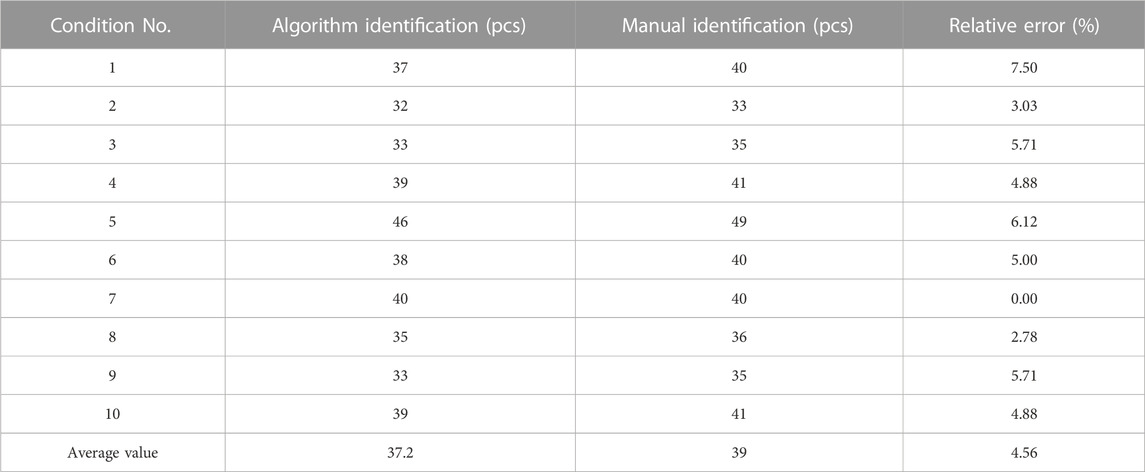
TABLE 3. Number of manual recognition and algorithm recognition and relative error.
The number of vapor bubble nucleation points identified by the two approaches is shown in Figure 16 (left), and the errors are shown in Figure 16 (right). The relative errors of the 2 approaches can be controlled within 10%, with an average value of 4.56%. This indicates that the identification accuracy of the vapor bubble tracking algorithm is good and can be used for the study of the evolutionary behavior of vapor bubbles in a narrow rectangular channel with subcooled flow boiling. It can also be seen from Figure 16 (left) that the overall number of nucleation points identified manually is higher than that identified by the algorithm, mainly because algorithmic identification always has a certain degree of omission, while manual identification does not produce such errors. This also illustrates the effectiveness and high error tolerance of algorithmic recognition.
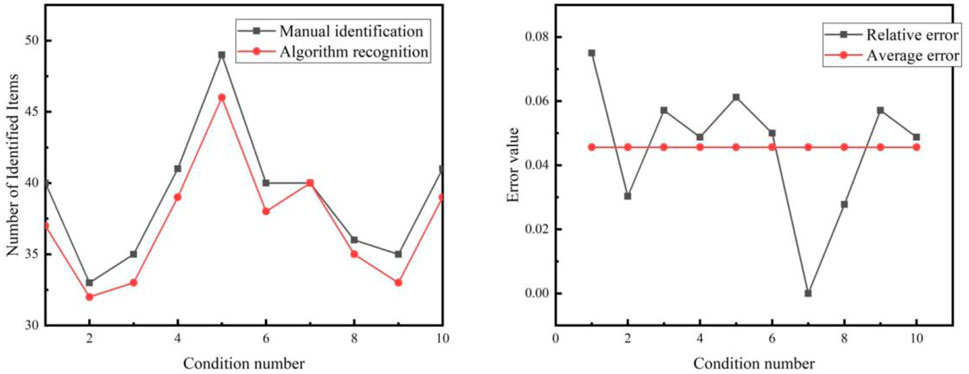
FIGURE 16. Comparison of manual recognition and algorithm recognition.
The data analysis of this experiment at is divided into two parts, the effect of different experimental conditions on the density of the nucleation point of the vapor bubble and the effect on the detachment frequency of the vapor bubble. The variables of the experimental conditions in this study include subcooling, mass flow rate and heating density, and the variation of the evolutionary behavior of the vapor bubble will be investigated by combining these three variables. The experimental data are obtained by the vapor bubble tracking algorithm and then put into Origin 2018, and the data are organized by Origin 2018.
In this experiment, we studied a flow channel area of 7.144 mm2. If the unit of nucleation point density is set to “pcs/mm2 ″, only a few values are obtained after the analysis of the vapor bubble tracking algorithm, which is too small and not intuitive enough. In order to ensure the intuitiveness of the plot, the unit of the nucleation point density of the vapor bubble is set to “pcs/cm2 ".
The effect of the heating density on the nucleation point density of the vapor bubble is analyzed by varying the heating density while keeping the mass flow rate and the inlet subcooling constant. As shown in Figure 17 (left), the variation of bubble nucleation point density with heating density is shown for a constant mass flow rate and subcooling at a pressure of p = 0.1 MPa. It can be seen from Figure 17 (left) that the vapor bubble nucleation point density increases with the increase of heating density. This is mainly because as the heating density increases, the temperature of the wall in direct contact with the liquid will also increase, and the superheated wall in turn provides a heat source for vapor bubble growth. This allows more nucleation points on the superheated wall to reach the conditions for vaporization, resulting in vapor bubbles. The sensitivity of the vapor bubble nucleation point density to the heating density is high, and when the heating density changes rapidly, the vapor bubble nucleation point density also changes with a large trend. When the heating density changes from about 160 kW/m2 to 240 kW/m2, the vapor bubble nucleation point density will change from about 200 nucleation points/cm2 to about 800 nucleation points/cm2, which is a 4-fold change.
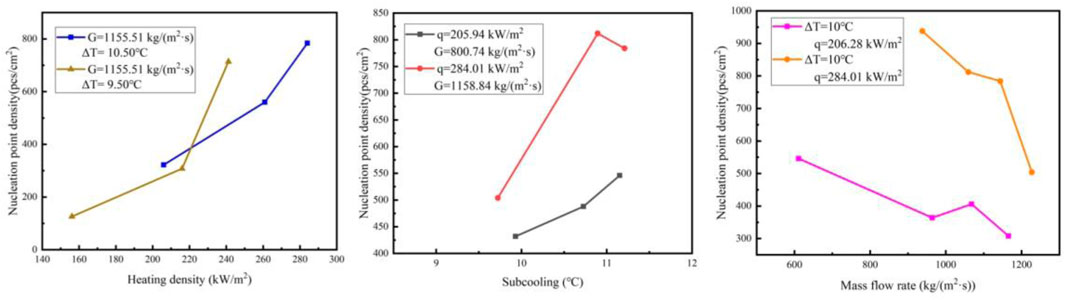
FIGURE 17. Variation of bubble nucleation point density with various parameters.
The influence of the vapor bubble nucleation point density was investigated by varying the subcooling degree while keeping the mass flow rate and heating density constant. As shown in Figure 17 (middle), the variation of bubble nucleation point density with subcooling degree is plotted for a constant mass flow rate and heating density at a pressure p = 0.1 MPa. It can be seen from Figure 17 (middle) that the bubble nucleation point density increases with the increase of the mainstream subcooling degree. This is due to the fact that the larger the mainstream subcooling degree, the larger the average temperature of the fluid in the experimental body, and the smaller the heat transfer coefficient of the fluid to the wall, resulting in a rise in the wall temperature. This causes the number of vapor bubble nucleation points to rise, so the change in mainstream water temperature also changes the density of vapor bubble nucleation points by affecting the wall superheat. The sensitivity of vapor bubble nucleation point density to subcooling degree is low, when the subcooling degree changes, the vapor bubble nucleation point density has a certain change.
As shown in Figure 17 (right), the variation of the vapor bubble nucleation point density with mass flow rate is plotted for the operating conditions of pressure p = 0.1 MPa, constant heating density and subcooling degree. From Figure 17 (right), we can see that the vapor bubble nucleation point density decreases with the increase of mass flow rate. This is due to the fact that when the mass flow rate is higher, the heat transfer coefficient increases, the wall superheat decreases, and the wall cavities do not reach the vaporization conditions, so the number of bubble nucleation points decreases. Moreover, the mass flow rate has a small effect on the density of vapor bubble nucleation points, which is mainly changed by affecting the wall superheat.
In summary, the heating density has the most significant effect on the bubble nucleation point density, mainly because it directly changes the temperature of the wall in contact with the fluid, which leads to the change of the bubble nucleation point density, while the mass flow rate and the mainstream subcooling have a smaller effect on the bubble nucleation point density, mainly because of its effect on the wall superheat, which indirectly changes the bubble nucleation point density. Among them, heating density and mainstream subcooling are positively correlated to the bubble nucleation point density, and the larger the value of these two parameters, the larger the bubble nucleation point density; mass flow rate is negatively correlated to the bubble nucleation point density, and the larger the mass flow rate, the smaller the bubble nucleation point density.
In this experiment, the high-speed camera was recorded at 10,000 fps, and we studied the vapor bubble detachment frequency in 9,000 fps, i.e., the vapor bubble detachment frequency in 0.9 s. In this 0.9 s, most of the nucleation sites have only 1 to 5 bubbles, and the detachment frequencies range from 1.11/s to 5.56/s. The lower detachment frequencies make it difficult to summarize the heat transfer characteristics in supercooled boiling. Therefore, in the study of the bubble detachment frequency, it is necessary to focus on the relationship between the nucleation point with higher bubble detachment frequency and the experimental conditions. Among the experimental conditions, the maximum number of bubble nucleation points was 67 and the minimum number was 9. The eight high vapor bubble detachment frequency points, common to all the experimental conditions, were selected and averaged to study their variation under different experimental conditions.
As shown in Figure 18 (left), the variation of vapor bubble detachment frequency with heating density for a constant mass flow rate and subcooling degree at a pressure p = 0.1 MPa. It can be seen from Figure 18 (left) that the bubble detachment frequency increases with the increase of heating density. This is mainly because the heating density increases, the temperature of the wall in direct contact with the liquid increases, and the superheated wall provides a heat source for bubble growth, which promotes bubble generation and thus increases the number of detached bubbles. The frequency of vapor bubble detachment varies more significantly with the heating density.
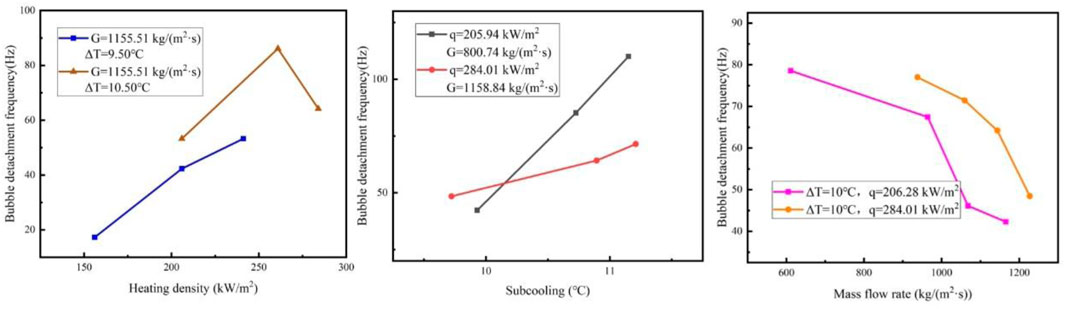
FIGURE 18. Variation of bubble detachment frequency with various parameters.
As shown in Figure 18 (middle), the variation of bubble detachment frequency with subcooling degree for a constant heating density and mass flow rate at a pressure p = 0.1 MPa is plotted. From Figure 18 (middle), it can be seen that the bubble detachment frequency increases with the increase of inlet subcooling. The reason for this is that the increase in mainstream subcooling eventually leads to an increase in wall temperature, which results in faster bubble growth.
As shown in Figure 18 (right), the variation of bubble detachment frequency with mass flow rate is plotted for a constant heating density and subcooling at a pressure p = 0.1 MPa. From Figure 18 (right), we can see that the bubble detachment frequency decreases with the increase of the mass flow rate. On the one hand, this is due to the fact that when the mass flow rate is larger, the heat transfer coefficient increases and the wall superheat decreases, which makes the bubble growth slow; on the other hand, it is because the bubble is subjected to stronger traction as the mass flow rate increases, so the bubble may detach before it has fully grown to its maximum diameter, resulting in a decrease in the number of bubble detachments.
In summary, has a significant effect on the bubble breakaway frequency because it directly changes the temperature of the wall in contact with the fluid, which leads to a change in the bubble breakaway frequency, while the mass flow rate and the mainstream subcooling have a certain effect on the bubble breakaway frequency because of their effect on the wall superheat, which indirectly changes the bubble breakaway frequency. The higher the value of these two parameters, the higher the bubble breakout frequency; the higher the mass flow rate, the lower the bubble breakout frequency.
Based on the analysis and processing of the experimental results, we derived the basic influencing factors of vapor bubble nucleation point density and vapor bubble detachment frequency. By combining the previous studies with the relevant parameters of this experiment, the corresponding empirical relationship equation is proposed and established in this study.
It is clear that the vapor bubble nucleation point density Na is positively related to the subcooling degree ΔT and the heating density q, and negatively related to the mass flow rate G. Numerous other covariates are involved in setting up the experimental study of this subject. Based on the results of the reference to the previous studies, the derived quantitative legalized relations, combined with the covariates involved in this experiment, are as in Equation 1:
Where: Dl - Narrow rectangular channel feature size.
Tw - Wall surface temperature.
σ - Surface tension of saturated liquid.
ρg - Density of the gas.
Referring to the existing research model, it is presumed that the empirical relationship equation should be in exponential form. Therefore, Equation 1 is dimensionless, so that its constant coefficient is m and exponential coefficient is n, and Equation 2 is obtained:
According to the experimental conditions, it is known that the characteristic size Dl of the narrow rectangular channel is 0.00364 m, the wall temperature Tw is taken as 140°C, the surface tension σ of the saturated liquid is 0.072 N/m, and the gas density ρg is 1.12 kg/m2. Substituting the data into Eq. (2) and taking the logarithm, the resulting data are fitted by substitution to obtain Figure 19. From Figure 19, it can be seen that the data of the vapor bubble nucleation point density The data are roughly linearly distributed and thus a linear fit is used, where the correlation of the linear fit R2 = 0.65. Based on the slope and intercept values of the linear fit curve, m = 74.245 and n = 1.673 in Eq. (2) can be obtained. By substituting the values of m and n into Eq. (2), the empirical relationship for the vapor bubble nucleation point density (3) is obtained as follows.
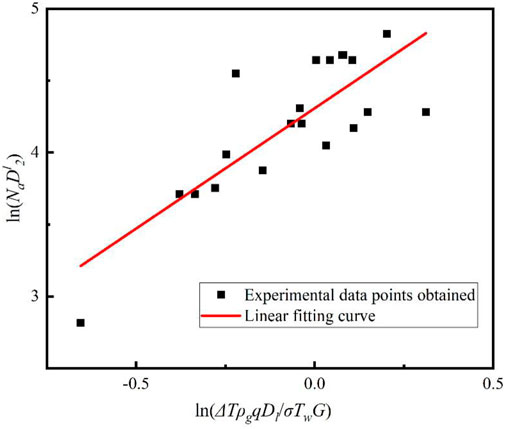
FIGURE 19. Fitting image of vapor bubble nucleation point density data.
Equation 3 was next validated. Using the experimental values as horizontal coordinates and the model predictions for the corresponding conditions as vertical coordinates, the image is plotted as shown in Figure 20. The two pink lines in Figure 20 are the ±30% error values. From the figure, it can be seen that all values basically lie between the two pink ±30% error lines, and the empirical relationship formula predicts well.
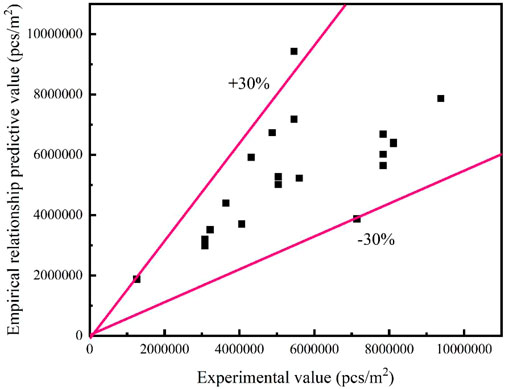
FIGURE 20. Validation of experimental values against empirical relational predictions.
The bubble detachment frequency 1/f is positively related to the subcooling degree ΔT and the heating density q, and negatively related to the mass flow rate G. Numerous other covariates were involved in setting up the experimental study of this topic. Based on the results of the reference to the previous studies, the derived quantitative legalized relations, combinedwith the covariates involved in this experiment, are as in Equation 4:
Where: hfg - latent heat of vaporization.
Tw - Wall surface temperature.
σ - Surface tension of saturated liquid.
ρg - Density of the gas.
Referring to the existing research model, it is presumed that the empirical relationship equation should be in exponential form. Therefore, Equation 5 is dimensionless, so that its constant coefficient is m and exponential coefficient is n, and Equation 5 is obtained:
According to the experimental conditions, the characteristic size Dl of the narrow rectangular channel is 0.00364 m, the wall temperature Tw is taken as 140°C, the surface tension σ of the saturated liquid is 0.072 N/m, the gas density ρg is 1.12 kg/m2, and the latent heat of vaporization hfg is 2,257 kJ/kg. The data are substituted into Equation 5 and taken as logarithm, and the resulting data are fitted by substitution to obtain Figure 21 shows that the data of vapor bubble detachment frequency are roughly linearly distributed, and thus a linear fit is used, where the correlation of the linear fit R2 = 058. Based on the slope and intercept values of the linear fit curve, m = 0.398 and n = 0.815 in Eq. 5 can be obtained. By substituting the values of m and n into Eq. 5, the empirical relationship for the density of vapor bubble nucleation points (6) is obtained as follows:
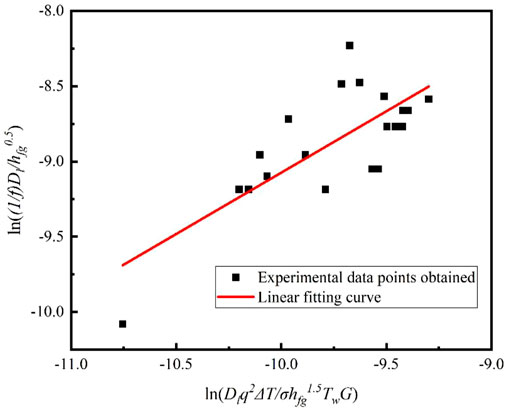
FIGURE 21. Fitting image of vapor bubble detachment frequency data.
Equation 6 was next validated. Using the experimental values as horizontal coordinates and the model predicted values under the corresponding conditions as vertical coordinates, the image is plotted as shown in Figure 22. The two pink lines in Figure 22 are the ±30% error values. From the figure, it can be seen that all values basically lie between the two pink ±30% error lines, and the empirical relationship formula predicts well.
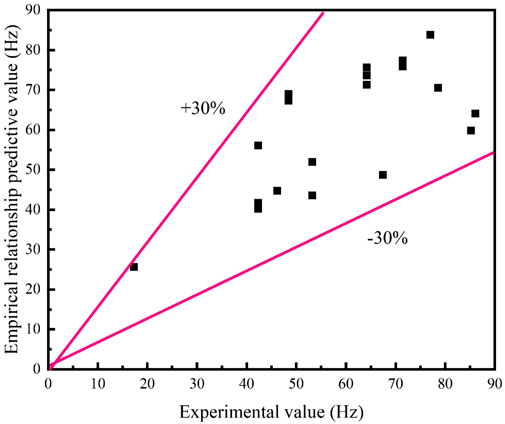
FIGURE 22. Validation of experimental values against empirical relational predictions.
(1) The heating density and mainstream subcooling have a positive correlation with the density and detachment frequency of bubble nucleation points. The larger the values of these two parameters, the higher the density and detachment frequency of bubble nucleation points; There is a negative correlation between mass flow rate and bubble nucleation point density. The higher the mass flow rate, the smaller the bubble nucleation point density and detachment frequency. The heating density has the most significant impact on the two parameters because it directly changes the temperature of the wall in contact with the fluid; The influence of mass flow rate and mainstream subcooling on the two parameters is relatively small, mainly due to their indirect effect on wall superheat.
(2) In addition to the relationship between the experimental parameters and the bubble evolution behavior, based on the existing research model and the experimental data obtained, the Empirical relationship between the bubble nucleation point density and the bubble separation frequency was fitted. The two Empirical relationship are in good agreement with the experimental values, and the error can be controlled within ± 30%
The raw data supporting the conclusion of this article will be made available by the authors, without undue reservation.
All authors listed have made a substantial, direct, and intellectual contribution to the work and approved it for publication.
The authors declare that the research was conducted in the absence of any commercial or financial relationships that could be construed as a potential conflict of interest.
All claims expressed in this article are solely those of the authors and do not necessarily represent those of their affiliated organizations, or those of the publisher, the editors and the reviewers. Any product that may be evaluated in this article, or claim that may be made by its manufacturer, is not guaranteed or endorsed by the publisher.
Basu, N., Warrier, G. R., and Dhir, V. K. (2002). Onset of nucleate boiling and active nucleation site density during subcooled flow boiling. J. Heat. Transf. 124, 717–728. doi:10.1115/1.1471522
Brooks, C. S., and Hibiki, T. (2015). Wall nucleation modeling in subcooled boiling flow. Int. J. Heat. Mass Transf. 86, 183–196. doi:10.1016/j.ijheatmasstransfer.2015.03.005
Chen, J. C. (1966). Correlation for boiling heat transfer to saturated fluids in convective flow. Ind. Eng. Chem. Process Des. Dev. 5, 322–329. doi:10.1021/i260019a023
Cole, R. (1960). A photographic study of pool boiling in the region of the critical heat flux. AIChE J. 6, 533–538. doi:10.1002/aic.690060405
Del Valle, V. H., and Kenning, D. B. R. (1985). Subcooled flow boiling at high heat flux. Int. J. Heat. Mass Transf. 28, 1907–1920. doi:10.1016/0017-9310(85)90213-3
Du, J. (2018). Bubble edge detection in three-phase fluidized bed via 2D wavelet transformation. J. Beijing Inst. Petrochem. Technol. 26, 71–76.
Gaertner, R. F. (1965). Photographic study of nucleate pool boiling on a horizontal surface. J. Heat. Transf. 87, 17–27. doi:10.1115/1.3689038
Gaertner, R. F. (1959). Population of active sites in nucleate boiling heat transfer. United States: Proquest.
Ivey, H. J. (1967). Relationships between bubble frequency, departure diameter and rise velocity in nucleate boiling. Int. J. Heat. Mass Transf. 10, 1023–1040. doi:10.1016/0017-9310(67)90118-4
Kim, J. H., You, S. M., and Pak, J. Y. (2006). Effects of heater size and working fluids on nucleate boiling heat transfer. Int. J. Heat. Mass Transf. 49, 122–131. doi:10.1016/j.ijheatmasstransfer.2005.08.001
Kim, J. M., Kim, J. H., and Ahn, H. S. (2018). Hydrodynamics of nucleate boiling on downward surface with various orientation. Part I: departure diameter, frequency, and escape speed of the slug. Int. J. Heat. Mass Transf. 116, 1341–1351. doi:10.1016/j.ijheatmasstransfer.2017.07.041
Lemmert, M., and Chawla, J. M. (1974). Influence of flow velocity on surface boiling heat transfer coefficient. United States: United States Environmental Protection Agency.
Ooi, Z. J., Kumar, V., Bottini, J. L., and Brooks, C. S. (2018). Experimental investigation of variability in bubble departure characteristics between nucleation sites in subcooled boiling flow. Int. J. Heat. Mass Transf. 118, 327–339. doi:10.1016/j.ijheatmasstransfer.2017.10.116
Qin, R. (2019). Sudy of characteristics extraction of underwater bubbles group based on hough transform. Acta Armamentarh 40, 2504–2512.
Rallis, C. J., and Jawurek, H. H. (1964). Latent heat transport in saturated nucleate boiling. Int. J. Heat. Mass Transf. 7, 1051–1068. doi:10.1016/0017-9310(64)90029-8
Rohsenow, W. M. (2022). A method of correlating heat-transfer data for surface boiling of liquids. Trans. Am. Soc. Mech. Eng. 74, 969–975. doi:10.1115/1.4015984
Shao, J. (2011). Image segmentation of bubble based on watershed algorithm. J. Xian Univ. Technol. 27, 185–189. doi:10.19322/j.cnki.issn.1006-4710.2011.02.011
Situ, R., Ishii, M., Hibiki, T., Tu, J. Y., Yeoh, G. H., and Mori, M. (2008). Bubble departure frequency in forced convective subcooled boiling flow. Int. J. Heat. Mass Transf. 51, 6268–6282. doi:10.1016/j.ijheatmasstransfer.2008.04.028
Sultan, M., and Judd, R. L. (1978). Spatial distribution of active sites and bubble flux density. J. Heat. Transf. 100, 56–62. doi:10.1115/1.3450504
Yang, C. (2015). The digital image analyisis technique for the determination of bubble size distribution in liquid phase. Master’s Degree. China: Nanjing University.
Keywords: nucleate subcooled boiling, nucleation site density, bubble departure frequency, bubble tracking algorithm, narrow rectangular channel
Citation: Lv K, Zhou L, Chen Y and Gao H (2023) Experimental investigation on the evolution of bubble behavior in subcooled flow boiling in narrow rectangular channel based on bubble tracking algorithm. Front. Energy Res. 11:1224306. doi: 10.3389/fenrg.2023.1224306
Received: 17 May 2023; Accepted: 23 August 2023;
Published: 25 September 2023.
Edited by:
Lin Chen, Chinese Academy of Sciences (CAS), ChinaReviewed by:
Hongna Zhang, Tianjin University, ChinaCopyright © 2023 Lv, Zhou, Chen and Gao. This is an open-access article distributed under the terms of the Creative Commons Attribution License (CC BY). The use, distribution or reproduction in other forums is permitted, provided the original author(s) and the copyright owner(s) are credited and that the original publication in this journal is cited, in accordance with accepted academic practice. No use, distribution or reproduction is permitted which does not comply with these terms.
*Correspondence: Linglan Zhou, emhvdWxsMTk4NkAxNjMuY29t; Hong Gao, Z2FvaG9uZ0BjcXUuZWR1LmNu
Disclaimer: All claims expressed in this article are solely those of the authors and do not necessarily represent those of their affiliated organizations, or those of the publisher, the editors and the reviewers. Any product that may be evaluated in this article or claim that may be made by its manufacturer is not guaranteed or endorsed by the publisher.
Research integrity at Frontiers
Learn more about the work of our research integrity team to safeguard the quality of each article we publish.