 Xiaobang Bai1,2
 Jicheng Li
- 1School of Energy and Power Engineering, Lanzhou University of Technology, Lanzhou, China
- 2Chongqing Pump Industry Co., Ltd., Chongqing, China
- 3Naipu Min Machinery Co., Ltd., Shangrao, China
Pump as turbine plays an important role in modern industrial process. One of the major goals of turbine design and optimization is to maximize its efficiency. Therefore, it is of great importance to connect force with work in the analysis process. In the present study, the three-dimensional flow field of the pump as a hydraulic turbine has been investigated in the steady-state mode. The load distribution along three captured streamlines (i.e., the shroud, hub and middle streamline) on both the pressure and the suction surface is observed, and the relationship between the load distribution and the working capability is systematically analyzed. The results show that the load distribution on the pressure surface of the hydraulic turbine blade gradually transitions from the reverse “S” shape to the “S” shape in the process of increasing flow rate, while the load distribution on the suction surface keeps increasing with a concave trend. The main work area of the fluid medium on the hydraulic turbine impeller is in the middle section of the blade. As the flow rate increases, the loads on the blade depict a linear decreasing trend from the inlet to the outlet. The net load acting on the blade is distributed in a concave parabola profile along the radial position of the blade. Focusing on the inlet and middle section of the blade profile in the design or optimization process of the hydraulic turbines will be more useful. This study provides a new analysis method for the design or optimization of hydraulic turbine impellers.
1 Introduction
The original purpose of the centrifugal pump is to transport liquid and convert the shaft power of the impeller into the energy of the fluid. The use of the centrifugal pump as turbine (PAT) reversely realizes the energy conversion of the centrifugal pump in the opposite direction, and transfers the energy (mechanical energy and internal energy) of the high-pressure liquid to the turbine impeller and outputs it as shaft work. When a pump is reversed, the outlet of the pump is the inlet of the turbine, and the inlet of the pump is the outlet of the turbine. The direction of rotation is opposite to that of the centrifugal pump. There are two main uses of pump reversal (Williams, 1996a; Van Antwerpen and Greyvenstein, 2005): one is as a low-cost turbine for power generation; the other is for energy recovery in pipelines. At present, the energy recovery efficiency of a hydraulic turbine is more than 80%. Comparing with the ordinary turbines and other turbine equipment, PAT is more flexible and simple to operate, and the efficiency of the turbine is similar to the pump’s working condition. Besides, the use of PAT has a lower cost.
Because of the convenient use of PAT, the change trend of the non-dimensional parameters were investigated (Sharma and Ahmad, 2008; Shahram et al., 2009; Zhou et al., 2010), such as flow rate and water head in two modes (pump mode and turbine mode) of centrifugal pumps with different specific speeds and off-design working conditions. Their study established the performance prediction relationship, the objective function of the impeller structure parameters, and optimized the impeller hydraulic model by gradient algorithm. Li (1993) made detailed discussion on various methods for the performance improvement of turbine, such as adding guide vanes, increasing the area of the impeller outlet, and trimming the head of blade. Williams (1996b) carried out experiments with 35 pumps of different shapes and sizes, compared the existing PAT performance prediction methods, and found that none of them can accurately predict the performance of PAT. Nautiyal et al. (2011) reviewed the previous performance prediction work of PAT, classified various methods and explained them in chronological order, and proposed a new method for predicting the performance of PAT by specific speed.
As is known, the performance of PAT (or pump) is closely related to its geometric parameters, including the diameter of impeller, inlet and outlet D, the blade placement angle β, the blade outlet width b, the number of blade z, the blade wrapping angle θ, etc. It is very useful to optimize PAT from above parameters. Yang et al. (2011) took a centrifugal pump with the specific speed of 72 as a turbine and studied the influence of blade wrapping angle. They found that with the increase of the blade wrapping angle, the flow head curve under pump conditions becomes steeper, and the shaft power gradually decreases; the head and shaft power under turbine conditions gradually increase, and the flow-head and flow-shaft power characteristic curves gradually increased. Yang and Wang (2011) investigated the influence of blade shape on the performance of hydraulic turbine using three PATs with different blade shapes. They found that there is an optimal combination of the blade inlet angle and wrapping angle, the turbine wheel is close to the blade inlet, there is an axial vortex near the pressure surface close to the inlet of the impeller blade. When the flow rate is greater than the design value, the larger the wrapping angle, the more obvious the decrease in turbine efficiency. Yang et al. (2013) conducted experimental research on a single-stage volute-type hydraulic turbine, and numerically studied the effect of the inlet placement angles. Their results show that the head and shaft power of the hydraulic turbine gradually increase with the increasing blade inlet angle. The efficiency of the hydraulic turbine decreases under small flow conditions, while increases under high flow conditions. The power loss inside the impeller is the main part of the turbine power loss. Researchers also investigated on the influence of blade outlet angles (Veselov, 1982; Yan, 1994; Li, 1999; Qu et al., 2005) and found that it is useful to improve the performance of PAT when the blade outlet angle increases to 90°–130°. However, further theoretical research is required to obtain the influence law of the blade outlet angle on the performance curve of PAT.
In addition, scholars have tried to using multi-objective optimization method for the design of the impeller to improve operating efficiency (Carlos et al., 2008; Kalyanmoy, 2009). Zhang et al. (2014) proposed an optimal design method of centrifugal pump impeller based on the adjoint method. This method directly uses the grid nodes on the impeller blade surface as the control variable, and establishes the objective function with the highest hydraulic efficiency of the pump at the designed operating point. Xiao and Wang (2006) used genetic algorithm (GA) global exploration, response surface approximate modeling, and sequential quadratic programming (SQP) local optimization strategy to obtain a full three-dimensional optimization strategy for hydraulic machinery. The design system realizes the fully automatic integration of the parametric design, meshing, calculation and post-processing of the blade. The genetic algorithm, neural network and gradient-based blade profile optimization algorithm were also adopted to optimize the blade profile of the pump turbine (Derakhshan et al., 2008; Derakhshan et al., 2009; Derakhshan et al., 2010). Some scholars further studied the optimal design of blades from the perspectives of numerical calculation, multiple operating conditions and three-dimensional design. Through theoretical analysis and experimental verification, the feasibility of the optimal design method is obtained (Zangeneh et al., 1996; Zangeneh et al., 1999; Kim and Park, 2000; Seo and Kim, 2004; Lehnhiuser and Scher, 2005).
The load distribution on the blade is closely related to the blade shape and the flow field in the impeller, and then affects the performance of the impeller (Shen, 1980; Otte, 1983). The basic idea of the “load method” is to use the momentum equation in the impeller to obtain the relationship between the load and the blade profile, and the twist of the blade can be obtained from this relationship (Wu and Bi, 1988). Therefore, the overall comprehensive analysis of the centrifugal pump can be carried out according to the load distribution on the blade profile and the performance of the impeller. Quan et al. (Quan et al., 2013) numerically studied the performance of screw centrifugal pump based on profile. The changes of speed, pressure, volume fraction and other parameters along the entire blade wrapping angle were explored, and the functional force of each segment of the screw centrifugal pump impeller was analyzed by introducing the concepts of centrifugal load, lift load and volume load coefficient. Lu and Wu (1987), Wu and Chen, 1988; Chen and Wu, 1989) studied the relationship between load distribution, relative speed distribution, blade outlet angle of centrifugal pump impeller and performance, and deduced the relationship between load and blade profile. Their study shown that as the maximum load moves to the exit direction, the blade wrapping angle becomes larger, the performance curve becomes steeper, and the high efficiency range becomes narrower. Zhu et al. (2004) studied the influence of the blade shape of the centrifugal solid-liquid two-phase flow pump on the hydrodynamic characteristics, and proposed a analyze method for the near wall centrifugal force to obtain a reasonable blade profile.
Although quite a few efforts have been made to investigate the performance and to improve the efficiency of the PAT, most of the studies on hydraulic turbine in terms of loads concentrate on the pressure pulsation (Ciocan et al., 2000; Zobeiri et al., 2006), axial force and radial force (Fernandez et al., 2004; Asuaje et al., 2005; Jain and Patel, 2014). However, there are few studies on the mechanism of energy conversion characteristics inside a pump as turbine, especially on the relationship between the load on blades and the blade profile and other geometric parameters of the impeller. With the gradual increase of energy requirement, researchers have tried different efforts to recover and use energy to its largest extent (Kariman et al., 2019; Kariman et al., 2020; Yargholi et al., 2020; Sohani et al., 2021; Nazarieh et al., 2023).
The present study investigates load distribution on the blade of a pump as turbine with the specific speed of 46. Connecting with the working capability, the law of load distribution on the shroud, the hub and the middle streamline has been systematically analyzed. Firstly, the three-dimensional flow field of the hydraulic turbine in the steady-state mode was studied with verified numerical model by experiment. Then the typical parameter reflecting the capability of working at the monitoring points were extracted by in the fluid domain, and the load distribution on both the pressure and the suction surface is observed. Finally, the relationship between the load distribution and the working capability is systematically analyzed. This study provides a new analysis method for the design or optimization of hydraulic turbine impeller. It is even useful to all of the fluid machineries by decomposing the load distribution on the blades and connecting them tightly with its working capability and efficiency.
2 Modeling
2.1 Physical model
Generally, reversal centrifugal pump with low specific speed (about 30–80) is used as hydraulic turbine. The specific speed ns is defined by
where n is the rotation speed of turbine, Q is the volume flux and H is the head. Considering low specific speed pumps are designed using the unary theory, in which the blades and impellers show similarities in terms of different geometric size. Without loss of generality, a widely used single stage PAT is adopted in the present study, as shown in Figure 1. The domain of the numerical simulation consists of the impeller, volute, and the inlet and outlet extension parts which are designed to obtain steady flow conditions. The design parameters of the hydraulic turbine are as follows: the flow rate is 24.75 m3/h, the head 51.06 m, the speed 2,900 r/min, and the specific speed 46.
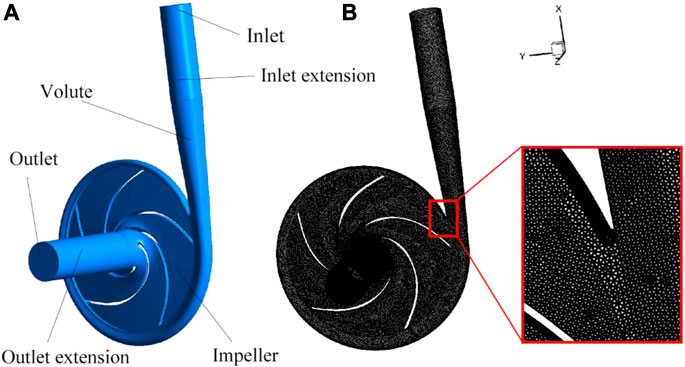
FIGURE 1. Geometry (A) and mesh (B) of the hydraulic turbine.
The geometric parameters of this hydraulic turbine are shown in Table 1.
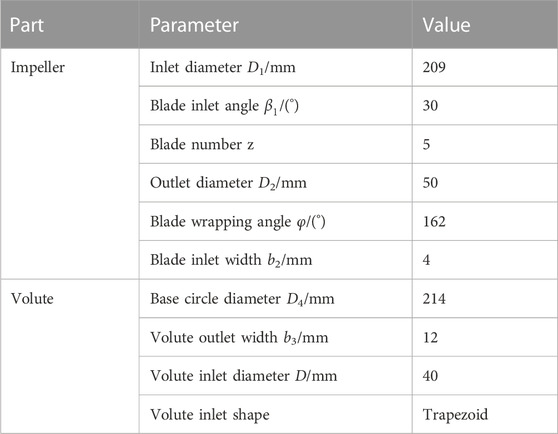
TABLE 1. Geometrical parameters of the hydraulic turbine.
2.2 Mathematical model
According to the Bernoulli’s equation, the head of hydraulic machine H is described by
where p is the static pressure, c the absolute velocity, z the position head, ρ the density of fluid and g the gravitational acceleration. The subscript 1 and 2 stands for the inlet and outlet of the turbine. When the hydraulic efficiency
where u is the peripheral velocity.
In the present study, an incompressible steady flow field is considered due to the high incompressibility of the fluid media and the stable performance in the long run. Thus, the governing equations are as follows:
The continuity equation is
and the momentum equation is
where ν is the kinematic viscosity, m2/s, and
where μ is the dynamic viscosity,
and the turbulent dissipation rate is originally defined by
The coefficient
2.3 Initial and boundary conditions
(1) Inlet boundary condition. The inlet section of the turbine is calculated from the inlet of the volute. Due to the instability of flow, calculating the flow directly from the inlet of the volute in the calculation domain will cause a higher hydraulic loss as the fluid passing through the tapered section, and then will affect the accuracy of the numerical calculation. Therefore, an extension pipe with the length of 3–5 times the diameter of inlet was added, which is also in line with the actual situation. Considering the incompressibility of the fluid medium (water) in the present study, the velocity inlet condition is adopted based on the volume flow rate across the hydraulic turbine.
(2) Outlet boundary condition. Similar to the inlet boundary condition, the outlet is also extended. The outlet can be set as pressure, free outflow or pressure far field. Thinking of the fluid at the outlet of the turbine must have a certain residual pressure energy, it is suitable to set a pressure boundary condition for the outlet. The value of the outlet pressure is 500 kPa in the present study.
(3) Wall and interface boundary conditions. The wall among the hydraulic turbine includes the suction surface and pressure surface of the blade, the shroud and hub of the impeller, the surface of the volute and the extension section, etc. Among the above wall boundaries, the walls related to the impeller keep rotating relatively to the absolute coordinate system of the impeller, and the rest of the wall boundaries remain static. Based on the boundary layer flow theory, it is necessary to use the standard wall-function method to deal with the near-wall area. The wall surface roughness is set to 50 μm. Generally, The non-slip boundary condition is adopted in the simulation, which can be expressed by
2.4 Solving method
In the present study, the unstructured mesh which refined near the wall region was adopted for the entire fluid domain. The widely used SIMPLE algorithm was used to couple the velocity and pressure. Moreover, the standard k-ε model was carried out in the context of turbulent flow inside the hydraulic turbine. The fluid medium is clean water at room temperature (300 K). The dynamic (impeller) and static (volute) joints of the flow components were set as interface connection. During the steady numerical simulation, The spatial discretization is based on the least square cell. The second order upwind scheme was applied to the momentum and pressure calculation, with the converge standard of 10−4 relative error.
The numerical model was validated with the same scheme in (Shi et al., 2016), in which the external characteristics (head, power and efficiency vs. flow rate) of the pump as turbine with the specific speed of 46 was carried out experimentally. The compared results of numerical simulation and experiments indicated that the adopted numerical method was valid. The grid independence test was carried out for the PAT according to the external characteristic curve for different grid numbers 309812, 743564, 1492007 and 2798136. It was found that the difference of the selected variables between the grid number 1492007 and 2798136 less than 5%. Thus, the grid number 1492007 was adopted in the present study considering adequacy and efficiency of numerical calculation.
3 Result and discussion
3.1 External characteristics of the hydraulic turbine
The external characteristic parameters reflect the pros and cons of the operating performance the turbine. It is necessary to investigate the functions between external characteristics, (i.e., the head H, the efficiency η, and the power P) and the volume flow rate. Therefore, the numerical simulation of the selected turbine is carried out under the working condition of 0.6Qd ∼ 2.2Qd with the interval of 0.2Qd, where Qd is the designed volume flow rate of the pump working condition. The functions of turbine head H, the hydraulic efficiency of turbine η, and the output shaft power P over the flow rate are shown in Figure 2.
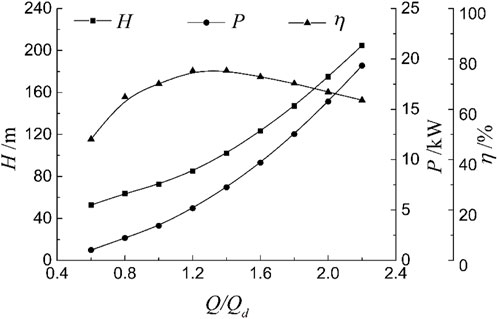
FIGURE 2. External characteristic curve of the hydraulic turbine. The curve stands for numerical results and the symbols stands for experimental results.
It can be seen that the turbine model adopted in this study reaches the highest efficiency η at 1.4 times the design flow rate (the design flow rate of the pump Qd), to the value of 75.3%. At this time, the head H and power P are 102 m and 7.252 kW, respectively. With the gradual increase of the flow rate, the hydraulic efficiency of the turbine first increases and then decreases. Before the optimal operating point (with the highest hydraulic efficiency), the efficiency rises rapidly. After the optimal operating point, the efficiency declines more smoothly. The ratio of the rate of change is about 2, which also meets the requirement of keeping the flow rate above the design conditions during the actual operation of the turbine (Derakhshan and Nourbakhsh, 2008). When the flow rate is between 1.0Qd and 1.8Qd, the hydraulic efficiency of the turbine remains above 70%, which means the high efficiency zone of this model is relatively wide. The head H and the power P present a convex curve rising up monotonously with increasing flow rate, and the slope presents a gradually increasing trend. The slope of the power curve is larger than that of the head curve, indicating that the torque of the turbine impeller increases in the form of a high-order (higher than one) function as the flow rate gradually increases.
3.2 Blade load distribution and performance analysis
In a hydraulic turbine, the load on the impeller blade is the pressure that the fluid medium acts on the surface of the blade during the fluid flow through the channel of the impeller, with the unit of Pa or kPa. Here, firstly, the load data of the monitoring points were captured on the shroud, the hub and the middle streamline of the pressure and suction surface of the turbine impeller blade established by the method of Supplementary Appendix. The reason of selecting the three streamlines is that they are the basic profile lines of the blade. Then, the position of the monitoring point along the streamline was characterized by the radial distance, and normalization is performed to obtain the load distribution curve with the radial ratio under the corresponding working conditions for both the pressure surface and the suction surface. Among them, the monitoring point with the radial ratio of 1 is the monitoring point at the inlet position of the hydraulic turbine impeller, and the monitoring point with the radial ratio of 0 is the monitoring point at the outlet position of the impeller.
3.2.1 Load distribution on the pressure surface
Figure 3 shows the load distribution on the pressure surface under different working conditions. It can be seen that, as a whole, with increasing radial ratio, the load on the shroud, the middle and the hub streamline of the blade pressure surface (denoted as P1, P2, P3, respectively) gradually increases, and the load increases faster in the context of large volume flow rate. When the hydraulic turbine runs at the optimal efficiency operating point 1.4Qd, the loads P1, P2, and P3 on the three streamlines increase linearly, and the load at the blade inlet position. The load of is approximately twice the load at the outlet, as shown in Figure 3D.
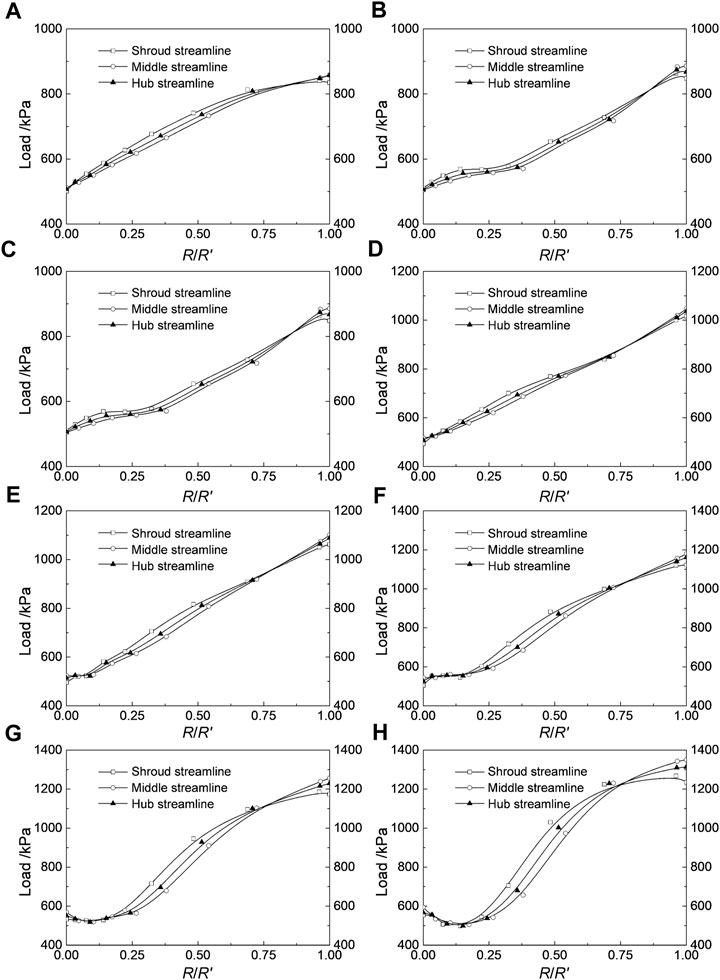
FIGURE 3. Load distribution on the pressure surface. The figures from (A–H) is for the volume flow rate of 0.6Qd, 0.8Qd, 1.0Qd, 1.2Qd, 1.4Qd, 1.6Qd, 1.8Qd, 2.0Qd.
When the volume flow rate is less than 1.4Qd, the load curve gradually changes from concave to convex shape (reverse “S” shape), with the inflection point at 1/4 of the radial ratio. At the outlet of the turbine blade, the three load curves intersect for the first time
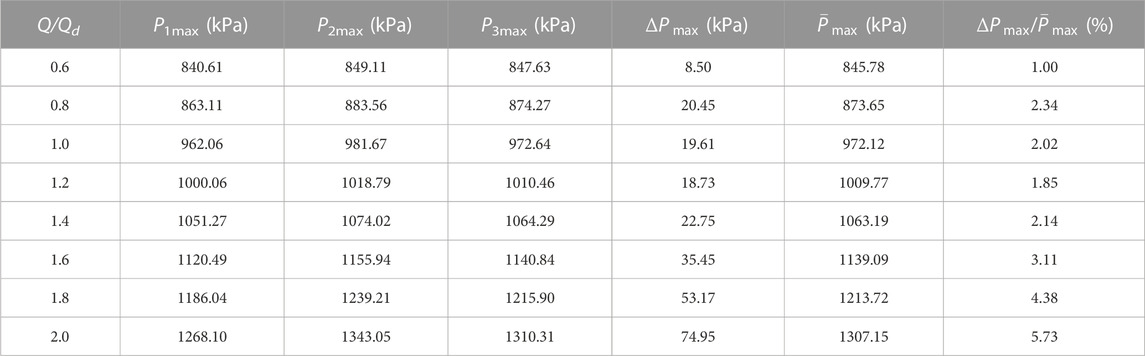
TABLE 2. The maximum load and relative load error on the shroud, hub and middle streamline of the pressure surface.
When the flow rate is greater than 1.4Qd, the load curve gradually changes from convex to concave shape (“S" shape), and the inflection point is also at the 1/4 radial ratio. At the outlet of the turbine blade,
The parts between the two intersections of the three load distribution curves satisfy the relationship of
3.2.2 Load distribution on the suction surface
Figure 4 shows the load distribution on the suction surface of the blade under different working conditions. It can be seen that with increasing radial ratio, the load on the shroud, the middle and the hub streamline of the blade pressure surface (denoted as
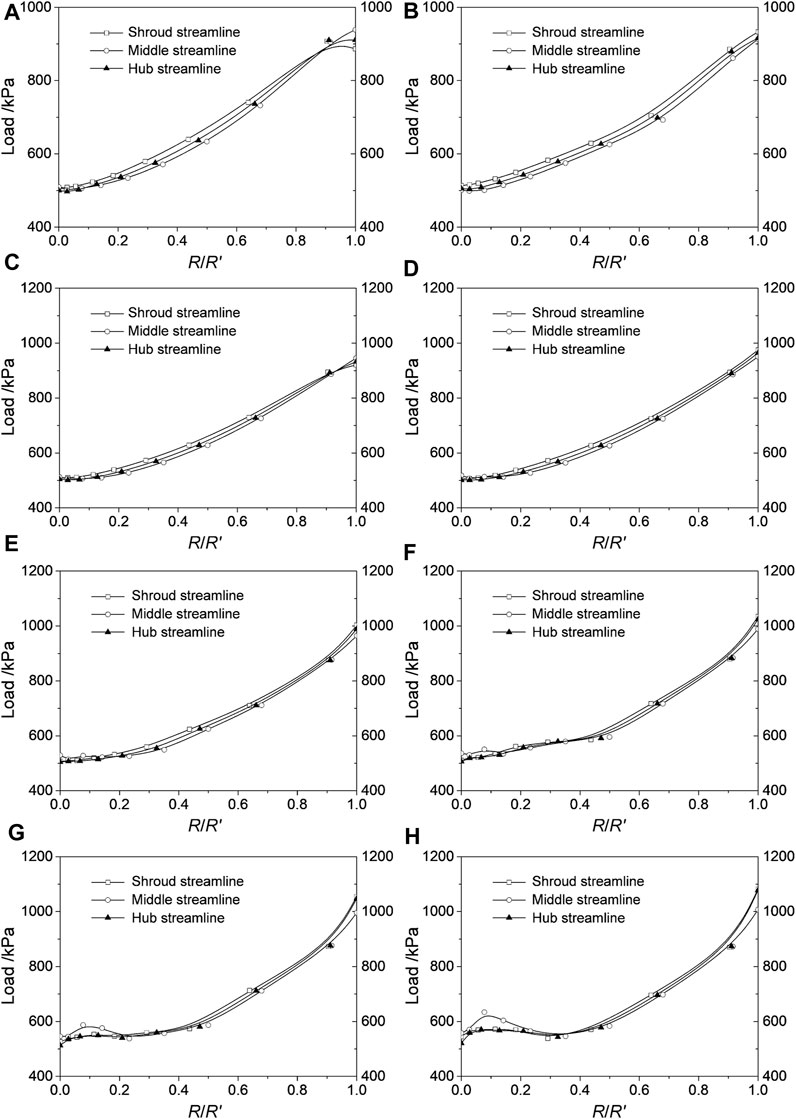
FIGURE 4. Load distribution on the suction surface. The figures from (A–H) is for the volume flow rate of 0.6Qd, 0.8Qd, 1.0Qd, 1.2Qd, 1.4Qd, 1.6Qd, 1.8Qd, 2.0Qd.
When the volume flow rate is less than 1.4Qd, three of the load distribution curves present a smooth upward trend, and the load on the three streamlines at the blade outlet position is obviously more uniform than that at the inlet position. The relative error between
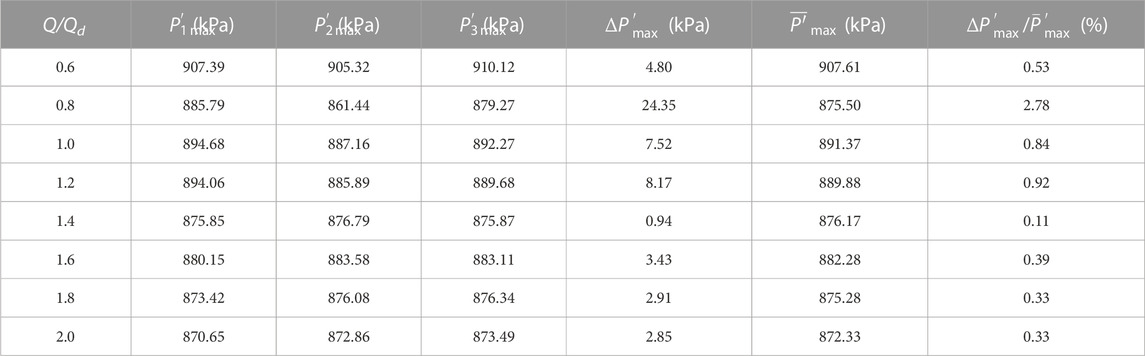
TABLE 3. The maximum load and relative load error on the shroud, hub and middle streamline of the suction surface.
When the volume flow rate is greater than 1.4Qd, three of the load distribution curves appear to oscillate slightly at the blade outlet, especially for the load distribution on middle streamline at the radial ratio of 0.1, as shown in Figures 4G, H. After the radial ratio of 0.2, the three load distribution curves return to a consistent trend. The value of
3.2.3 Net load distribution on the blade streamline
In order to investigate the power of the fluid medium on the hydraulic turbine blade, the net load distribution was calculated by the difference between the load on the pressure surface and the suction surface for the shroud, hub and middle streamline. Five typical operating conditions with the volume flow rate of 0.8Qd, 1.0Qd, 1.4Qd, 1.6Qd, and 2.0Qd were selected, and the net load distribution on the blade are shown in Figure 5.
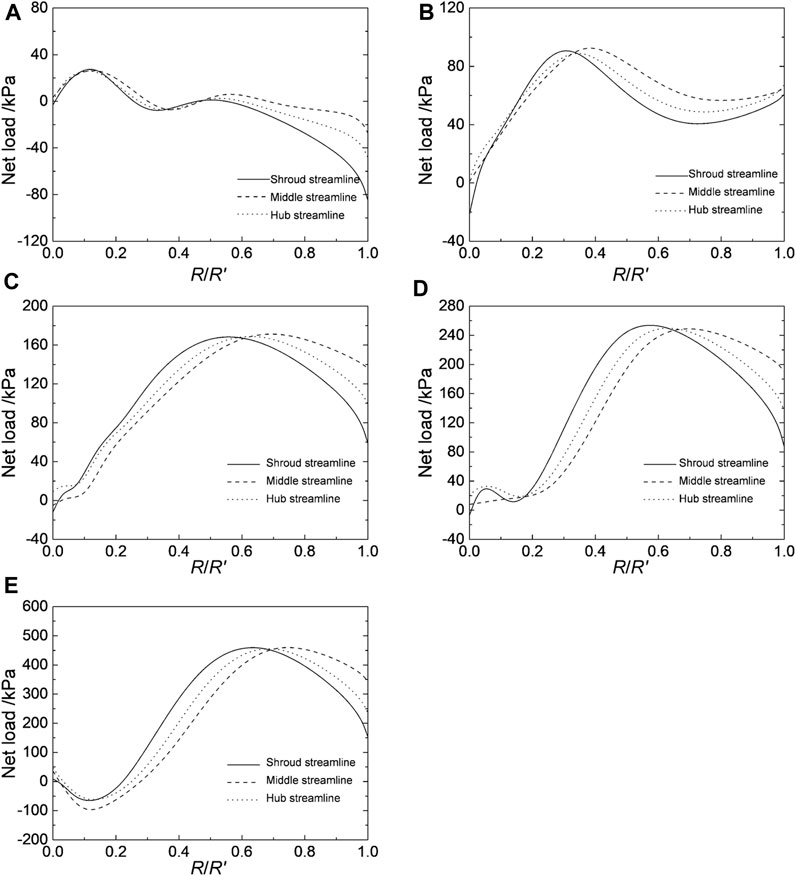
FIGURE 5. Net load distribution on the blade. The figures from (A–E) is for the volume flow rate of 0.8Qd, 1.0Qd, 1.4Qd, 1.6Qd, 2.0Qd.
It can be seen from Figure 5A that the net load on the blade gradually decreases from the outlet to the inlet of the impeller. In the 0 ∼ 0.5 times radial ratio section, the net load on the shroud, the middle and the hub streamline of the blade (denoted as Pn1, Pn2, and Pn3 respectively) are almost greater than zero. The trend of the three net load distribution curves are consistent. When the radial ration is 0.1, the net load reaches its maximum value. In the range of 0.5 ∼ 1 times the radial ratio, Pn1, Pn2, and Pn3 begin to decline with increasing radial ratio, in which Pn1 declines the fastest, Pn2 declines the slowest. The three net load distribution curves are all below zero, which indicates that negative pressure is formed on this part of blade.
When the flow rate increases to 1.0Qd, Pn1, Pn2, and Pn3 are all positive values in the entire blade flow path (see Figure 5B), indicating that the net load on the blade changes to positive pressure from the pressure surface to the suction surface. As the radial ratio increases, Pn1, Pn2, and Pn3 depicts concave increasing trends until reaching their maximum values at 0.3 ∼ 0.5 times the radial ratio position, and presents convex decreasing trend until reaching their minimum values at 0.7 ∼ 0.8 times the radial ratio.
As the volume flow rate continues to increase, the net load on the blade develops into a standard parabolic distribution, as shown in Figures 5C–E. The position of the maximum net load on the blade shifted from 0.5 to 0.7 times the radial ratio at 1.4Qd to 0.6 ∼ 0.8 times the radial ratio at 2.0Qd. When the flow rate is greater than the flow rate of 1.4Qd, namely, the optimal efficiency operating point, there is a small fluctuation at the 0 ∼ 0.2 times radial ratio (i.e., near the blade outlet). This small fluctuation increases with increasing volume flow rate. However, the number of extreme points decrease with increasing volume flow rate, and the fluctuations finally develop into small upward convex curves at 2.0Qd, with negative minimum load obtained at the position of 0.1 times the radial ratio. In the increasing part of the net load, Pn1>Pn2>Pn3, and in the decreasing part, Pn2>Pn3>Pn1.
Overall, the net load on the blade increases with increasing volume flow rate, which is consistent with the trend of the power changing with the volume flow rate in the external characteristic curve, as shown in Figure 2.
3.3 Discussion
The flow channel of the turbine impeller is a tapered and twisted three-dimensional flow channel. When the fluid medium flows from the inlet of the impeller through the flow channel of the impeller, it is accompanied by the mutual conversion between kinetic and potential energy and heat transfer (ignored here). The energy conversion satisfies the Bernoulli’s equation (Eq. 1). Since the fluid medium in the present study is clean water,
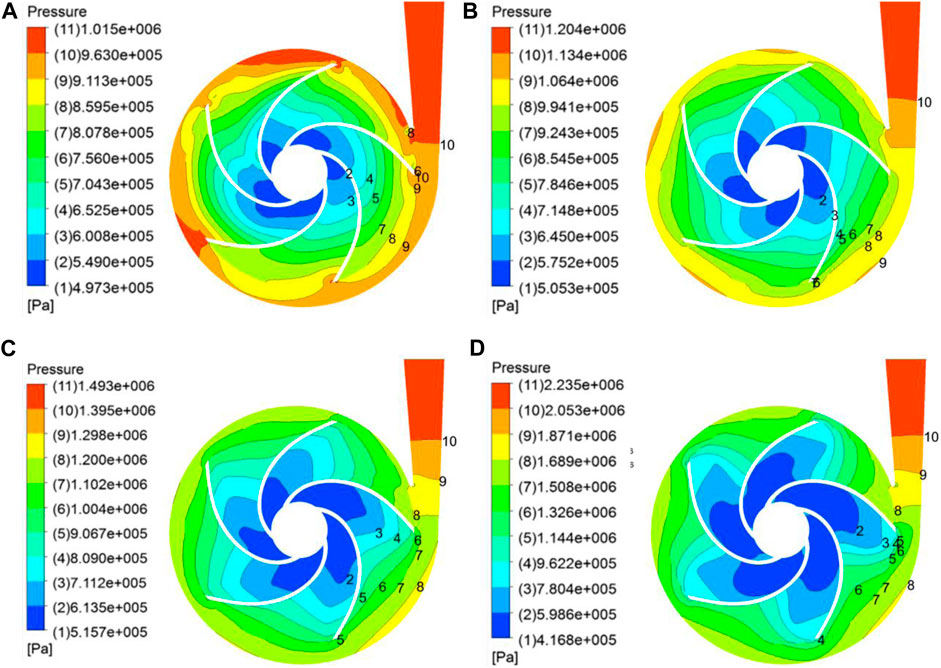
FIGURE 6. Pressure distribution at the middle section of the turbine. (A) 0.6Qd, (B) 1.0Qd, (C) 1.4Qd, (D) 2.0Qd.
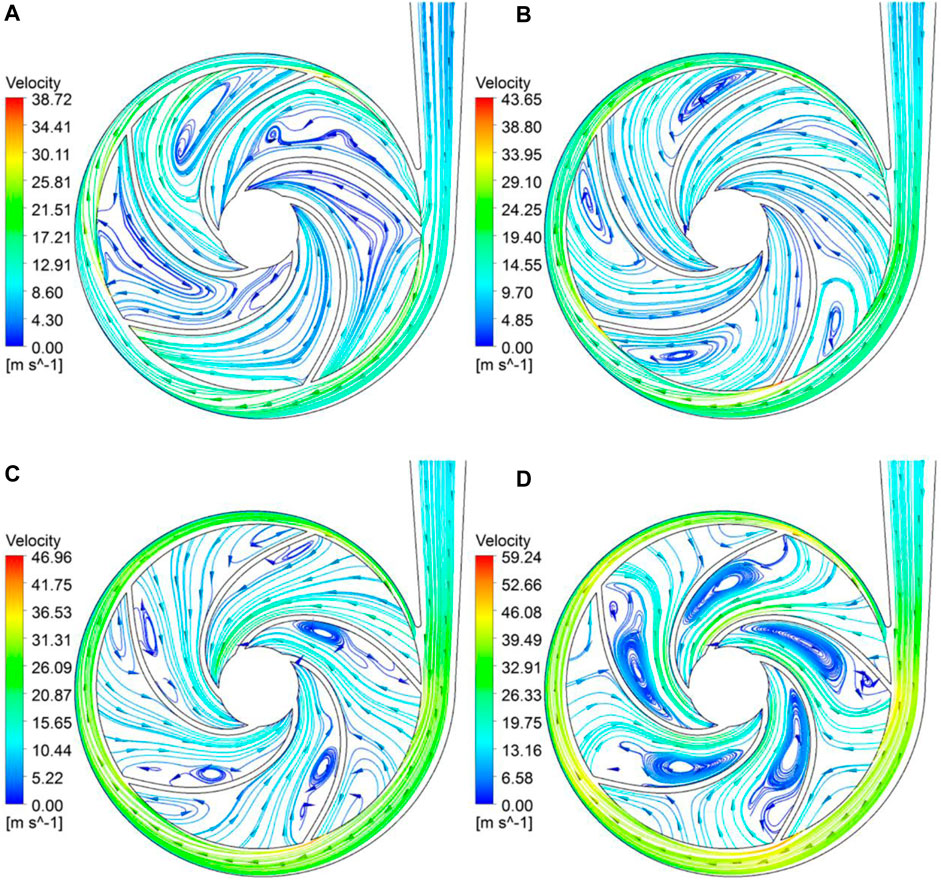
FIGURE 7. Streamline distribution at the middle section of the turbine. (A) 0.6Qd, (B) 1.0 Qd, (C) 1.4Qd, (D) 2.0Qd.
The load distributions on the shroud, the middle streamline and the hub streamline of the pressure and suction surface are generally in the relationship of
The net load distribution curves are the result of superposition of the load between the pressure surface and the suction surface. Among them, the net load for the small volume flow rate (shown in Figure 5A) is negative, which is corresponding its relatively small power (see Figure 3), since the negative load prevents the fluid from working on the impeller. Although the power is increased for the large volume flow rate cases, the efficiency is decreased. As it can be seen in Figure 5, the design point 1.0Qd has wider and flatter positive net load distribution then the lager flow rate cases. This is why the efficiency of 1.0Qd is higher than other off-design operation points. Besides, the negative pressure in the small section of the outlet position also have small influence on the efficiency of the turbine. The physical mechanism of the differences of net loads and efficiencies is due to the increase of turbulence and dissipation in the flow field for larger flow rate cases. Thus, it is recommended to increase the net positive load distribution range to improve the efficiency of turbine.
This study mainly concentrates on the load distribution along the blade of turbine and analyzes the flow fields and physical mechanism. However, the energy conversion characteristics inside the turbine still need further investigation. Besides, some meaningful results maybe obtain by using large-eddy simulation (LES) considering the turbulent flows inside the turbine.
4 Conclusion
In the present study, the three-dimensional flow field of the pump as hydraulic turbine was numerically investigate in the steady-state mode. By extracting the typical parameter reflecting the capability of working at the monitoring points established in the fluid domain, the load distribution on both the pressure and the suction surface is observed, and the relationship between the load distribution and the working capability is systematically analyzed. The results show that the main work area of the fluid medium on the hydraulic turbine impeller is in the middle section of the blade. The inlet section does less work, while the outlet section almost does not work. As the flow rate increases, the load distribution on the pressure surface of the hydraulic turbine blade gradually transitions from the reverse “S” shape to the “S” shape in the process of increasing flow rate, while the load distribution on the suction surface keeps increasing with a concave trend. The loads on the shroud, the middle and the hub streamline depict linear decreasing trend from the inlet to the outlet of the blade. The net load acting on the blade is distributed in a concave parabola profile along the radial position of the blade. Therefore, it is more important to take the inlet and middle section of the blade profile into consideration when design or optimize a hydraulic turbine impeller. It is also recommended to increase the net positive load distribution range to enhance the efficiency of turbine in the optimal design process.
Data availability statement
The original contributions presented in the study are included in the article/Supplementary Material, further inquiries can be directed to the corresponding author.
Author contributions
XB, JY, and JL contributed to conception and design of the study. XB organized the database and wrote the first draft of the manuscript. JY, XW, and JL contributed to manuscript revision. All authors contributed to the article and approved the submitted version.
Funding
This study is supported by China Postdoctoral Science Foundation (No. 2022M712676) and Gansu Outstanding Youth Fund (No. 20JR10RA203).
Conflict of interest
Author XB was employed by the company Chongqing Pump Industry Co., Ltd. Author JL was employed by the company Naipu Min Machinery Co., Ltd.
The remaining authors declare that the research was conducted in the absence of any commercial or financial relationships that could be construed as a potential conflict of interest.
Publisher’s note
All claims expressed in this article are solely those of the authors and do not necessarily represent those of their affiliated organizations, or those of the publisher, the editors and the reviewers. Any product that may be evaluated in this article, or claim that may be made by its manufacturer, is not guaranteed or endorsed by the publisher.
Supplementary material
The Supplementary Material for this article can be found online at: https://www.frontiersin.org/articles/10.3389/fenrg.2023.1220395/full#supplementary-material
References
Asuaje, M., Bakir, F., Kouidri, S., Kenyery, F., and Rey, R. (2005). Numerical modelization of the flow in centrifugal pump: volute influence in velocity and pressure fields. Int. J. Rotating Mach. 2005 (3), 244–255. doi:10.1155/ijrm.2005.244
Carlos, A. C., Lamont, G. B., and Van Veldhuizen, D. A. (2008). Evolutionary algorithms for solving multi-objective problems. second edition. London, England: Springer.
Chen, S. L., and Wu, D. R. (1989). The drawing of a centrifugal impeller with computer AID. J. Xi’an Jiao Tong Univ. 23 (3), 99–108.
Ciocan, G. D., Avellan, F., and Kueny, J. L. (2000). Optical measurement techniques for experimental analysis of hydraulic turbines rotor-stator interaction. Proc. ASME, 11–15.
Derakhshan, S., Mohammadi, B., and Nourbakhsh, A. (2009). Efficiency improvement of centrifugal reverse pumps. J. fluids Eng. 131 (2), 204–209. doi:10.1115/1.3059700
Derakhshan, S., Mohammadi, B., and Nourbakhsh, A. (2008). Incomplete sensitivities for 3D radial turbomachinery blade optimization. Comput. Fluids 37 (10), 1354–1363. doi:10.1016/j.compfluid.2008.01.002
Derakhshan, S., Mohammadi, B., and Nourbakhsh, A. (2010). The comparison of incomplete sensitivi-ties and Genetic algorithms applications in 3D radial turbomachinery blade optimiza-tion. Comput. Fluids 39 (10), 2022–2029. doi:10.1016/j.compfluid.2010.07.003
Derakhshan, S., and Nourbakhsh, A. (2008). Theoretical, numerical and experimental investigation of centrifugal pumps in reverse operation. Exp. Therm. Fluid Sci. 32 (8), 1620–1627. doi:10.1016/j.expthermflusci.2008.05.004
Fernandez, J., Blanco, E., Parrondo, J., Stickland, M. T., and Scanlon, T. J. (2004). Performance of a centrifugal pump running in inverse mode. Proc. Institution Mech. Eng. Part A J. Power Energy 218 (4), 265–271. doi:10.1243/0957650041200632
Jain, S. V., and Patel, R. N. (2014). Investigations on pump running in turbine mode: A review of the state-of-the-art. Renew. Sustain. Energy Rev. 30, 841–868. doi:10.1016/j.rser.2013.11.030
Kalyanmoy, D. (2009). Multi-objective optimization using evolutionary algorithms. Canada: John Wiley & Sons.
Kariman, H., Hoseinzadeh, S., and Heyns, P. S. (2019). Energetic and exergetic analysis of evaporation desalination system integrated with mechanical vapor recompression circulation. Case Stud. Therm. Eng. 16, 100548. doi:10.1016/j.csite.2019.100548
Kariman, H., Hoseinzadeh, S., Shirkhani, A., Heyns, P. S., and Wannenburg, J. (2020). Energy and economic analysis of evaporative vacuum easy desalination system with brine tank. J. Therm. Analysis Calorim. 140, 1935–1944. doi:10.1007/s10973-019-08945-8
Kim, J. S., and Park, W. G. (2000). Optimized inverse design method for pump impeller. Mechan-ics Res. Commun. 27 (4), 465–473. doi:10.1016/s0093-6413(00)00119-1
Lehnhiuser, T., and Scher, M. (2005). A numerical approach for shape optimization of fluid flow domains. Comput. Methods Appl. Mech. Eng. 194 (50/51/52), 5221–5241. doi:10.1016/j.cma.2005.01.008
Li, W. G. (1993). Design and amplification of industrial centrifugal pumps. Lanzhou, China: Fluid Machinery Lab of Lanzhou University of Technology, 236–240.
Li, W. G. (1999). Flow measurements of water inside a centrifugal pump impeller with large blade discharge angle. Trans. Chin. Soc. Agric. Mach. 30 (2), 54–58.
Lu, W. Z., and Wu, D. R. (1987). The influence of velocity distribution in centrifugal impellers and outlet blade angle on the performance of centrifugal pumps. Trans. Chin. Soc. Agric. Mach. (2), 25–32.
Nautiyal, H., Varun, V., Kumar, A., and Yadav, S. Y. S. (2011). Experimental investigation of centrifugal pump working as turbine for small hydropower systems. Energy Sci. Technol. 1 (1), 79–86. doi:10.3968/j.est.1923847920110101.006
Nazarieh, M., Kariman, H., and Hoseinzadeh, S. (2023). Numerical simulation of fluid dynamic performance of turbulent flow over Hunter turbine with variable angle of blades. Int. J. Numer. Methods Heat Fluid Flow 33 (1), 153–173. doi:10.1108/hff-12-2021-0774
Otte, J. J. (1983). “Function of the aerodynamic blade loading as the criterion to the design of the centrifugal impeller,” in Proceedings of the seventh conference on fluid machinery (Budapest, Hungary: Akadémi Kiadó), 649.
Qu, Y. P., Chen, S. Y., and Zhang, H. F. (2005). Experimental study on steady-state hydraulic performance of a centrifugal pump through changing outlet angle. Fluid Mach. 33 (10), 1–3.
Quan, H., Li, R. N., Su, Q. M., Han, W., Li, Q. F., and Shen, Z. J. (2013). Research on work capacity of screw centrifugal pump impeller based on profile lines. J. Mech. Eng. 49 (10), 156–162. doi:10.3901/jme.2013.10.156
Seo, S. J., and Kim, K. Y. “Design optimization of forward-curved blades centrifugal fan with response surface method,” in Proceedings of the ASME Heat Transfer, Fluids Engi-neering Summer Conference, Charlotte, North Carolina, USA, July 2004, 551–556.
Shahram, D., Bijan, M., and Ahmad, N. (2009). Efficiency improvement of centrifugal reverse pumps. J. Fluids Eng. 131 (2), 204–209. doi:10.1115/1.3059700
Sharma, D., and Ahmad, N. (2008). Experimental study of characteristic curves of centrifugal pumps working as turbines in different specific speeds. Exp. Therm. Fluid Sci. 32 (4), 800–807. doi:10.1016/j.expthermflusci.2007.10.004
Shen, T. Y. (1980). A flow model and design method of the impeller of forward-swept blades. J. Tsinghua Univ. 20 (2), 37–50.
Shen, T. Y. (1987). Fundamentals of centrifugal impeller internal flow theory. Hangzhou, China: Zhejiang University Press.
Shi, G. T., Yang, J. H., Miao, S. C., and Wang, X. H. (2016). Unsteady calculation of pressure pulsations within hydraulic turbine under different entrance sections. J. Aerosp. Power 31 (3), 659–668. doi:10.13224/j.cnki.jasp.2016.03.017
Sohani, A., Pedram, M. Z., Berenjkar, K., Sayyaadi, H., Hoseinzadeh, S., Kariman, H., et al. (2021). Techno-energy-enviro-economic multi-objective optimization to determine the best operating conditions for preparing toluene in an industrial setup. J. Clean. Prod. 313, 127887. doi:10.1016/j.jclepro.2021.127887
Van Antwerpen, H. J., and Greyvenstein, G. P. (2005). Use of turbines for simultaneous pressure regulation and recovery in secondary cooling water systems in deep mines. Energy Convers. Manag. 46 (4), 563–575. doi:10.1016/j.enconman.2004.04.006
Veselov, V. I. (1982). Effect of the outlet angle β2 on the characteristics of low specific-speed centrifugal pumps. Power Technol. Eng. 16 (5), 267–273. doi:10.1007/bf01427809
Williams, A. A. (1996a). Pumps as turbines for low cost micro hydropower. Renew. Energy An Int. J. 9 (1-4), 1227–1234. doi:10.1016/0960-1481(96)88498-9
Williams, A. A. (1996b). Pumps as turbines for low cost micro hydropower. Renew. Energy An Int. J. 9 (1-4), 1227–1234. doi:10.1016/0960-1481(96)88498-9
Wu, D. R., and Bi, Z. Y. (1988). Effect of load and relative velocity distribution on cavitation in centrifugal pump. Fluid Eng. (12), 5–10.
Wu, D. R., and Chen, S. L. (1988). The relation between loading distribution and characteristics in impeller of centrifugal pump. Trans. Chin. Soc. Agric. Mach. (2), 58–65.
Xiao, R. F., and Wang, Z. W. (2006). Centrifugal pump blade optimization based on a combined optimization strategy. J. Tsinghua Univ. Sci. Technol. 46 (5), 700–703. doi:10.3321/j.issn:1000-0054.2006.05.025
Yan, J. (1994). Influence of impeller geometry parameters on the centrifugal pump capacity of different specific speeds. Pump. Technol. (4), 17–19.
Yang, J. H., and Wang, X. H. (2011). Effect of vane profile on hydraulic energy recovery turbines performance. J. Drainage Irrigation Mach. Eng. 29 (4), 287–291. doi:10.3969/j.issn.1674-8530.2011.04.003
Yang, S. S., Kun, F. Y., and Chen, B. (2011). Numerical research of blade wrap angle on the performance of reversible pump. Fluid Mach. 39 (6), 17–21. doi:10.3969/j.issn.1005-0329.2011.06.005
Yang, S. S., Kun, F. Y., Chen, H., and Su, X. H. (2013). Effects of blade inlet angle on performance of pump as turbine. J. Central South Univ. Sci. Technol. 44 (1), 108–113.
Yargholi, R., Kariman, H., Hoseinzadeh, S., Bidi, M., and Naseri, A. (2020). Modeling and advanced exergy analysis of integrated reverse osmosis desalination with geothermal energy. Water supply 20 (3), 984–996. doi:10.2166/ws.2020.021
Zangeneh, M., Goto, A., and Harada, H. (1999). On the role of three-dimensional inverse design methods in turbomachinery shape optimization. J. Mech. Eng. 213 (1), 27–42. doi:10.1243/0954406991522167
Zangeneh, M., Goto, A., and Takemura, T. (1996). Suppression of secondary flows in a mixed-flow pump impeller by application of three dimensional inverse design method Part 1: de-sign and numerical validation. J. Turbomach. 118 (7), 536–543. doi:10.1115/1.2836700
Zhang, R. H., Guo, M., Yang, J. H., and Liu, Y. (2014). Blade shape optimization of centrifugal pump impeller with adjoint method. J. Drainage Irrigation Mach. Eng. 32 (11), 943–947. doi:10.3969/j.issn.1674-8530.14.0033
Zhou, G. J., Yan, Z. Y., and Xu, S. X. (2011). Fluid mechanics. Beijing, China: High Education Press.
Zhou, Y. F., Yan, J. C., and Fang, Y. (2010). Optimum design of the impellers of centrifugal pumps based on ANSYS. Chem. Eng. Mach. 37 (2), 165–169. doi:10.3969/j.issn.0254-6094.2010.02.009
Zhu, Y. C., Wu, Y. L., Pan, A. X., Li, L., Qu, Y. G., Yu, J. N., et al. (2004). Influence of vane curve of solid liquid two-phase flow centrifugal pump on dynamic properties of fluid. J. Mech. Eng. 40 (8), 67–71. doi:10.3901/jme.2004.08.067
Keywords: pump as turbine, computational fluid dynamics (CFD), load, optimization, hydraulic, centrifugal pump
Citation: Bai X, Yang J, Wang X and Li J (2023) Numerical investigation on the blade load distribution in a pump as turbine. Front. Energy Res. 11:1220395. doi: 10.3389/fenrg.2023.1220395
Received: 10 May 2023; Accepted: 07 August 2023;
Published: 25 August 2023.
Edited by:
Siamak Hoseinzadeh, Sapienza University of Rome, ItalyReviewed by:
Amir Hassanzadeh, Urmia University, IranHamed Kariman, Edith Cowan University, Australia
Copyright © 2023 Bai, Yang, Wang and Li. This is an open-access article distributed under the terms of the Creative Commons Attribution License (CC BY). The use, distribution or reproduction in other forums is permitted, provided the original author(s) and the copyright owner(s) are credited and that the original publication in this journal is cited, in accordance with accepted academic practice. No use, distribution or reproduction is permitted which does not comply with these terms.
*Correspondence: Junhu Yang, bHp5YW5namhAbHV0LmNu