- State Key Laboratory of Rail Transit Vehicle System, Southwest Jiaotong University, Chengdu, China
An evacuated tube transport (ETT) system is proposed by combining evacuated tube technology and high temperature superconducting (HTS) maglev technology in this paper. It can be predicted that this future transport mode can own the advantages of less emission, low noise, high efficiency, and suitable for high-speed or super-high-speed application. The train running at a high speed will inevitably cause complex aerodynamic load behaviors in an enclosed low-pressure tube. It further affects the real energy consumption and the fatigue life of the components. In order to explore how the aerodynamic load behaves in an ETT-HTS Maglev system, we established a three-dimension numerical calculation model based on ANSYS FLUENT software. The steady aerodynamic loads on the train’s surface and the tube’s inner surface are investigated under different pressures and different operation speeds. It is found that the aerodynamic load on the surface of the train and tube is significantly affected by the pressure inside the tube and the running speed of the train. The aerodynamic load fluctuations at the rear of the train are relatively more violent than those at the head. We also found that the impact of compression wave and expansion wave on aerodynamic loads at different positions of the tube is related to the size of the flow field space between the tube and the train. These results can provide some reference for the less-emission train body design and the whole ETT-HTS Maglev system structural strength in the near future.
1 Introduction
Due to the development of society and the acceleration of urbanization, it is a worldwide issue to improve transportation efficiency. As a novel combination of evacuated tube transport (ETT) and high temperature superconducting Maglev (HTS Maglev), the ETT-HTS Maglev provides a potential new solution to realize the proposition of higher ground speed transportation. However, several issues were gradually exposed with the increasing running speed of trains (Tian, 2007). The aerodynamic load on the surface of the train is one of the major factors that leads to the increased energy consumption and fatigue aerodynamic loading problems for the train body, which can pose a significant threat to the train operation safety in severe cases (Glockle and Pfretzschner, 1989; Wang et al., 2008; Mei et al., 2019). When a maglev train runs in an evacuated tube, the air flow between the train and the tube wall is rapidly compressed, resulting in sudden pressure change and generating severe air pressure waves within the tube. These waves acts on the tube and the train, leading to the aerodynamic load. Additionally, the ETT system operating at ultra-high speeds in an enclosed space is bound to cause complex aerodynamic loads due to the difficult realization of absolute vacuum (Li and Yuan, 2014). All the aerodynamic characteristics are very close to analysis the real energy consumption and further evaluate which energy level the ETT-HTS maglev transportation belong to.
The HTS maglev train is the main operating body of the ETT-HTS Maglev system. Due to the self-stable characteristics of levitation and guidance, HTS maglev train with less emission is safer and more reliable than traditional normal maglevs (Deng et al., 2008). In addition, the low-pressure tube provides a natural barrier for onboard suspended dewars and permanent magnet guideway, which extends their service time and avoids the safety threat caused by the external ferromagnetic materials adsorbed on the guideway. Theoretically, reducing the air pressure will reduce the aerodynamic load. However, due to the enclosed space in the tube, the aerodynamic load may be intensified. Therefore, it is necessary to further explore the aerodynamic load characteristics of the ETT-HTS Maglev system for promoting the relative applications.
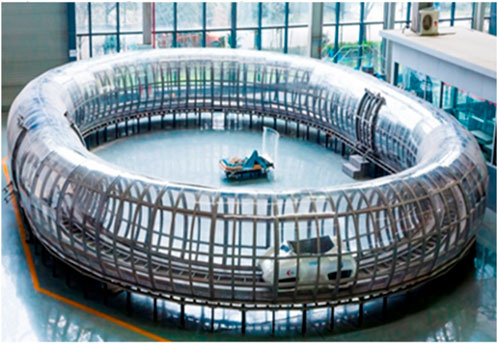
In 1904, Robert Goddard (Goddard, 1945; Goddard, 1950) first put forward the concept of ETT. In 1934, Herman, (1934) claimed that the combination of maglev and evacuated tube could achieve the target speed of 1,000 km/h. In 1974, Rodolphe Nieth (Zhang et al., 2004) proposed a construction plan for the Swiss super-high-speed subway and conducted some research and numerical simulations on the economic feasibility and safety of ETT transport in low-pressure environments. In addition, in the 1970s and the 1980s, United States researchers developed and refined the concepts of the ETT-Maglev transport like “Planetran”, “StarTram”, and “ET3” (Mossi and Sibilla, 2002; Jufer et al., 2006). Limited by the development of maglev technology at that time, the ETT-Maglev researches were mainly in the stage of theoretical research, and there were no substantial test lines in the world (Oster et al., 2011; Zhang et al., 2011; Jiang et al., 2012). In June 2014, the HTS Maglev research team in Southwest Jiaotong University successfully developed an evacuated tube HTS Maglev test platform “Super-Maglev” (Deng et al., 2017), as shown in Figure 1, which strongly demonstrates the feasibility and potential merits of the ETT-HTS Maglev transportation concept. It is a new choice to combine the less-emission HTS Maglev with ETT system, which can reduce energy consumption by reducing the aerodynamic load.
However, the relative experiment data is still limited and expensive. Thus, experts and scholars prefer using the numerical simulation technology. This method employs commercial software such as FLUENT as the primary research tool, as a cost-saving measure and to overcome experimental limitations. Considering the compressibility of gas, Oh et al. (2019) employed a viscous and compressible steady-state flow model to investigate the aerodynamic characteristics of the Hyperloop system, such as choked flow and shock waves. Kim et al. (2011) conducted the computational analysis based on unsteady compressible Navier-Stokes equations, and analysed various driving aerodynamic drag data and the drag coefficient law under different blockage ratios, internal tube pressures and operating speeds. By using the aerodynamic shape of the CRH2 high-speed train, Liu et al. (2013) established a more suitable aerodynamics model in a low-pressure environment. This study examined how pressure, blockage ratio, and speed affected the aerodynamic drag of trains. Then Liu determined the approximate relationships between the optimal tube pressure, blockage ratio and train speed in the ETT system combined with traditional rail trains. Kang (Kang et al., 2017) studied the aerodynamic drag of transonic vehicle in the evacuated tube under various operating speeds and vacuum degrees, and concluded that the drag coefficient reached the maximum value before decreasing when the Mach number approached the Kantrowitz limit, which indicated a typical transonic flow pattern. Bi and Lei, (2009) studied the ETT aerodynamic characteristics under different vacuum degrees and operating speeds based on a moving grid method. Sui et al. (2021) firstly studied the impact of the vaccum degree on the aerodynamic performances of the train capsule. As the vacuum degree increases, many advantages features, such as the aerodynamic performance and the heating due compressibility are all significantly attenuated. These features improve the stability of the train capsule in an evacuated tube. Le et al. (2020) studied the aerodynamic drag and pressure waves in Hyperloop systems.
Recent researches mainly focused on the aerodynamic drag of HTS maglev trains under low-pressure tube conditions, but there were few analyses on the aerodynamic load on the tube’s internal wall and the train body’s surface. This load directly affects the energy consumption and endangers the running safety of the trains. For the ETT-HTS Maglev system, the aerodynamic load on the surface of the train and the inner surface of the tube mainly depends on the running speed of the train and the air pressure of the tube. In this study, we established a three-dimension numerical computational model in ANSYS FLUENT software. The distribution and variation of the aerodynamic load on both the outer surface of the train and the inner surface of the tube under steady conditions are systematically examined. The results can provide the reference for the structural strength design of the train body and tube of the ETT-HTS Maglev system in the future.
2 Simulation model
Generally, the calculation of the aerodynamic characteristics considering the compressible flow brings better accuracy, especially in high-speed situations. Hence, in this paper, the compressibility of gas is considered in setting boundary conditions and selecting material parameters of the simulation model.
2.1 Mathematical model
With the decreasing air pressure, the gas probably appears a rarefied effect. When the air density is reduced to the point where the mean free path of the gas molecules is not small relative to the characteristic scale of the train, the usual aerodynamic methods are no longer applicable. Knudsen number is usually used to judge if the gas is consistent with the continuous hypothesis.
For the flow around a train in the low-pressure tube, the characteristic length L can be taken as the maximum height of the typical train body 3.7 m. The Boltzmann constant kB is 1.38 × 10⁻²³. The molecular diameter d is approximately 3.50 × 10⁻¹⁰ m. In this paper, the simulated pressure ranging from 0.1 to 0.001 atm and the corresponding temperature of 300 K (27°C) are substituted into Eq. 1 to get the maximum value of Knudsen number 2.04 × 10⁻⁵, which is far less than the maximum limit (0.001) for continuous media (Huang et al., 2018). It is concluded that the flow state is continuous flow at the simulated pressure.
The low-pressure air in the tube belongs to a continuous flow and still satisfies the Mass Conservation Equation, the Momentum Conservation Equation, the Energy Conservation Equation, and the Equation of state (Jia et al., 2018). For compressible Newtonian fluids, they are represented as Eqs 2–5, respectively.
where ui represents components of velocity in x, y and z directions; p represents air pressure in the tube; k is the thermal conductivity of the fluid; cp is the specific heat capacity at constant pressure; ST is the viscous dissipation term, and Fi represents volumetric force source terms of micro element body in x, y and z directions.
When the air pressure in the tube is 0.001 atm and the speed of train is 0.8 Mach, according to the definition equation of Reynolds number, the Reynolds number is calculated to be greater than 4,000,
where ρ is the density of gas in a tube, 1.22 × 10⁻³ kg/m3 when the air pressure is 0.001 atm; D is the characteristic length, which usually represents the height of the train body, so its value is 3.7 m; μ represents the coefficient of kinetic viscosity of gas.
Hence, it can be concluded that turbulent flow exists inside the tube. In this paper, the Realizable k-epsilon turbulence model commonly used in engineering is selected (Schlichting and Kestin, 1961; Shih et al., 1995; Asress and Svorcan, 2014) and the finite volume method is used to discretize the computational domain.
2.2 Computational model
At present, the aerodynamic shape of the HTS maglev train running in the low-pressure tube is not well-defined. Due to its characteristics of non-derived stability and simple structure, the CRH2 without complex structures such as bogie and pantograph is adopted as the basic shape of the HTS maglev train in this paper. In order to ensure that the simplified model is similar to the characteristics of the middle flow field of all vehicles, three cars in formation, including a head car, a middle car and a tail car is adopted, which can save computing resources.
The aerodynamic simulation model is shown in Figure 2. The longitudinal length of the computational domain is 400 m, and the simplified model is 76.4 m in length, 3.4 m in width and 3.6 m in height. The entrance boundary is set 100 m away from the front of the train and the exit boundary is 300 m away from the front of the vehicle inside the computational domain. The bottom of the train is 20 mm away from the bottom of the calculation domain, which reflects the typical levitation height of the HTS maglev train. In this paper, the calculation model is first meshed on STARCCM+ software, and later imported into FLUENT software for the simulation of different working conditions. And all the simulation calculations of aerodynamic load are carried out under the condition that the radius of the tube is 4 m and the blockage ratio is 0.32.
2.3 Boundary conditions and assumptions
In this paper, the ideal gas inside the tube is assumed and the low-pressure operating environment in the tube is simulated by setting the density. The inlet velocity is set to simulate the uniform movement of the train in the tube. The boundary conditions of the entrance and exit are set to “pressure far field”, which is a non-reflective boundary condition. The surface of the train is treated as a stationary wall, and the no-slip condition is applied. The bottom and wall of the tube are set as the moving walls and their moving speeds are the same as the inflow velocity. Finally, the parameters of ideal gas and inlet and outlet boundaries are adjusted to simulate different working conditions.
2.4 Computational grid
The computational model utilizes around 16 million grid cells, and the profile view of the encrypted grid area is showed in Figure 3A. Due to the complicated shape of streamlined head, the numerical calculation grid is divided by unstructured hybrid grid, as shown in Figure 3B Triangular grids are employed for the surface of the car body, with a maximum size of 50 mm. The flow field ahead and behind the train changes dramatically, so separate refinement is required. Two refined blocks are set along the x-axis to capture the turbulence in detail at the rear of the train, as shown in Figure 3C The aerodynamic loads are mainly concentrated on the body surface, where the boundary layer grids should be added, as shown in Figure 3D The thickness of the first boundary layer on the body surface is set as 0.9 mm, with a total number of 12 boundary layers, growth factor of 1.2, and the boundary layer thickness of 35.6 mm.
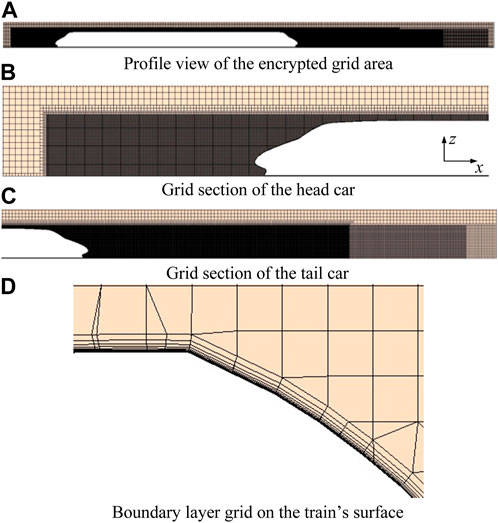
FIGURE 3. Meshing details of the simulation domain. (A) Profile view of the encrypted grid area. (B) Grid section of the head car. (C) Grid section of the tail car. (D) Boundary layer grid on the train’s surface.
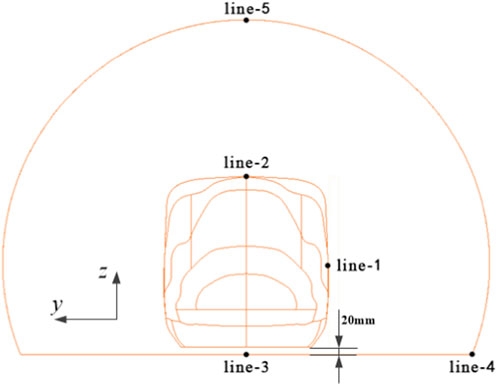
In order to explore the distribution of aerodynamic loads on the train’s outer surface and the tube’s inner surface in detail, five measuring lines are arranged on these surfaces, as shown in Figure 4.
Five measuring lines of line-1, line-2, line-3, line-4, and line-5 are projected onto the y-z plane respectively. Line-1 and line-2 represent the central lines on the left side and the top surface of the train body. Similarly, line-3 and line-4 refer to central line and the right side on the bottom of the tube, while line-5 is located at the top of the tube.
2.5 Verification
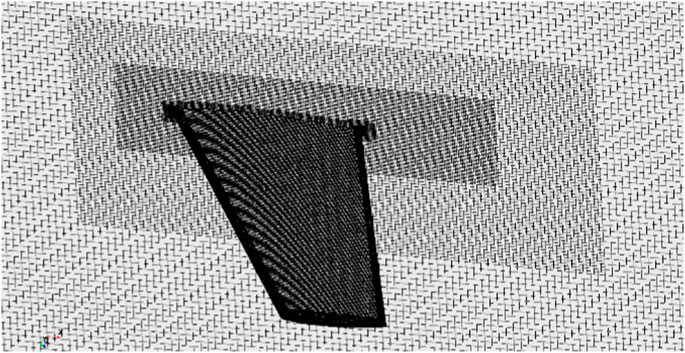
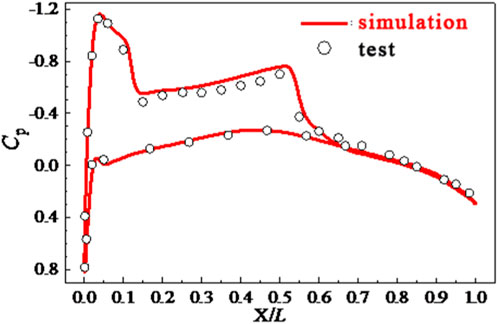
At present, there have been no relevant aerodynamic tests conducted on the train in the low-vacuum tube. Therefore, in order to verify the accuracy and rationality of the numerical model selected in this paper, a numerical calculation of the aerodynamic characteristics of the ONERA-M6 three-dimensional airfoil is performed. The volume mesh near the airfoil is shown in Figure 5, while the pressure coefficients of the section with the airfoil span is 0.44 and compared with the aerodynamic test data (Schmitt, 1979), as shown in Figure 6. The maximum error of the pressure coefficient (Cp) is less than 5%, which is within the acceptable range. Therefore, the numerical model adopted in this paper is suitable for obtaining accurate numerical results.
3 Results
3.1 Velocity effect on aerodynamic load of the train’s surface
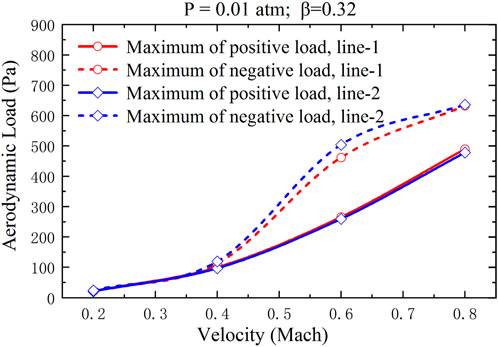
When the blockage ratio is 0.32 and the pressure is 0.01 atm in the tube, the variation of aerodynamic loads on the outer surface of an HTS maglev train with different speeds is studied in this section, as shown in Figure 7. The relationship between the maximum aerodynamic load on the train and the running speed is shown in Figure 8.
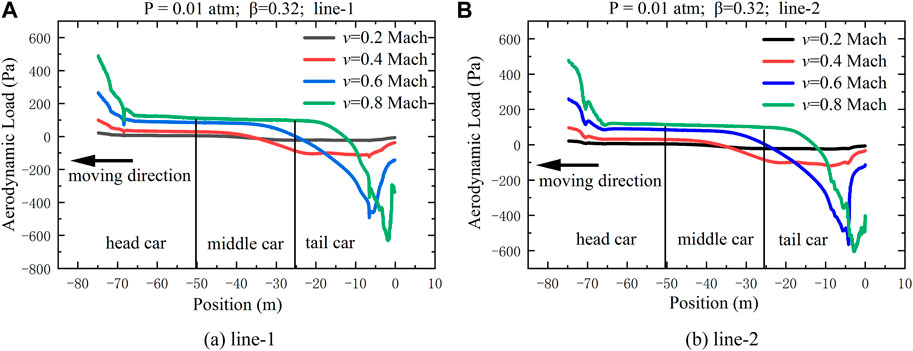
FIGURE 7. Variation of aerodynamic loads on the train with different speeds. (A) line-1, (B) line-2.
As shown in Figure 7, the variation of aerodynamic load on line-1and line-2 with speed is basically consistent. With the increase of the train’s running speed, the variation of aerodynamic load on the head car and the tail car is more obvious. However, when the train’s running speed reaches 0.2 Mach, the variation of aerodynamic load on the outer surface of the train is not obvious. Positive pressure is formed on the head car and negative pressure is formed on the tail car, and the variation of aerodynamic load on the middle car is relatively gentle compared with the head car and the tail car. When the running speed reaches 0.8 Mach, the maximum aerodynamic load on the head car is up to about 0.5 kPa due to the low-pressure environment of the tube and the running speed of the train. The maximum negative aerodynamic load on the tail car is greater than the maximum positive aerodynamic load on the head car. Due to the transition section on the head car, there is a sudden drop near the position of −70 m.
In Figure 8, the maximum value of aerodynamic load increases proportionally with the train’s running speed. Line-1 exhibits a slightly higher maximum positive aerodynamic load than line-2, while line-2 has a greater maximum negative aerodynamic load than line-1.
The air in front of the head car is compressed intensely and forms a compression wave, which causes a sharp rise in air pressure at the stagnation point of the head car. At the same time, the air behind the tail car expands and forms an expansion wave, which generates the turbulent wake and a negative pressure zone. With the increase of the speed, the compression effect on the head car intensifies and the turbulent wake on the tail car becomes more intense. The influence of the turbulent wake on the aerodynamic load of the tail car is obviously greater than that of the compressed air near the head car. As a result, there is a greater aerodynamic load behind the tail car.
3.2 Pressure effect on aerodynamic load of the train’s surface
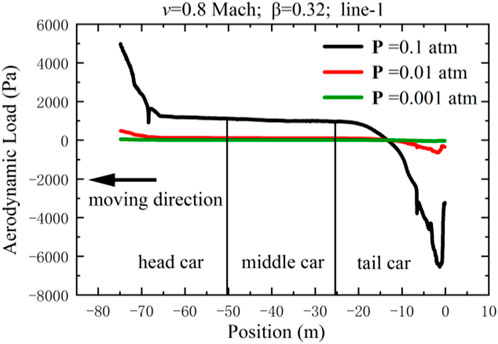
This section investigates the aerodynamic load variation on the surface of an HTS maglev train with different air pressures when the blockage ratio is 0.32 and the running speed is 0.8 Mach, as shown in Figure 9. The distribution characteristics of maximum aerodynamic loads on the train with different pressures are shown in Figure 10.
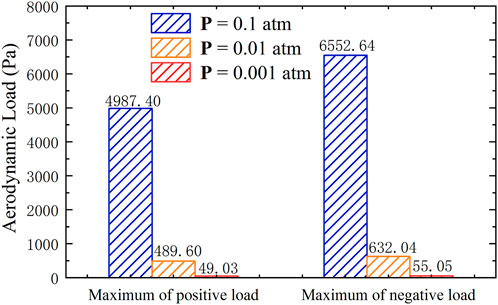
FIGURE 10. Distribution characteristics of maximum aerodynamic loads on the train with different pressures.
As shown in Figure 9, the aerodynamic load on the train’s surface gradually decreases along the longitudinal direction of the train at the pressure of 0.1 atm. When the air pressure in the tube decreases, the aerodynamic load on the train’s surface is significantly reduced compared with 0.1 atm.
Figure 10 demonstrates that the maximum positive and negative aerodynamic loads on the head and the tail car decrease significantly with the decreasing pressure in a tube. When the air pressure in the tube is 0.001 atm, the maximum positive and negative aerodynamic loads are respectively 489.60 Pa and 632.04 Pa, which are 9.82%, 9.65% of those at 0.01 atm and 0.98%, 0.84% of those at 0.1 atm. Those results indicate that reducing the air pressure in the tube can effectively reduce the variation of aerodynamic load on the train’s surface, especially on the tail car.
3.3 Velocity effect on aerodynamic load of the tube’s inner wall
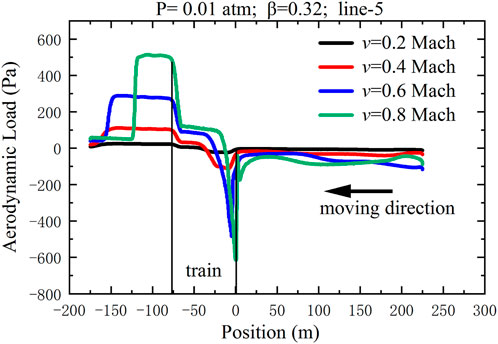
In the ETT-HTS Maglev system, the tube creates a low-pressure environment, making it possible for trains to run at ultra-high speeds. However, a complex turbulent motion is formed in the tube. The disturbed low-pressure airflow can cause aerodynamic load disturbances on the tube’s inner wall, affecting its structural stress, tightness, and ultimately, compromising the safety of the ETT-HTS Maglev system. In this part, the distribution of aerodynamic load on the tube’s inner wall with different speeds is extracted at a pressure of 0.01 atm and a blockage ratio of 0.32, as shown in Figure 11. The train is located at the position from −76.4 m to 0 m on the x-axis and moves to the left.
In Figure 11, the aerodynamic load on the tube’s inner wall is relatively high near the head car and changes relatively smoothly near the middle car, while a sudden pressure mutation manifests near the tail car.
The distribution trend of pressure on the tube’s inner wall also reflects the change of compression and expansion wave in the tube. Compression waves formed by the compressed air near the head car leads to the rise in pressure on the inner wall of the tube. Moreover, the expansion wave formed by the expanded air near the tail car results in the pressure reduced on the inner wall. In addition, at higher speeds, the speed of the compression wave diffusion becomes slower, resulting in the phenomenon that the range of the peak value near the head car when the speed is 0.8 Mach is smaller than that when the speed is 0.6 Mach.
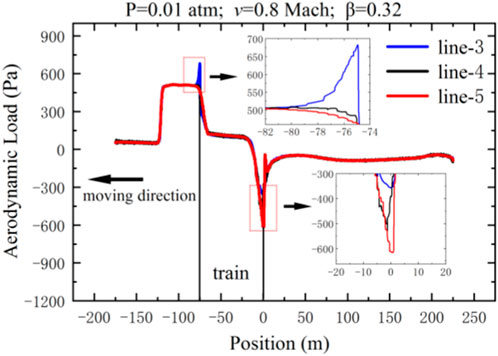
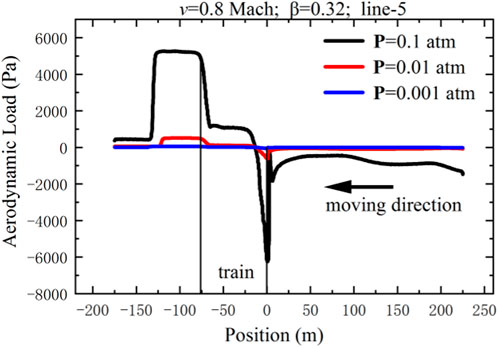
Moreover, through further analysis, it is found that the aerodynamic loads at different positions of the tube’s inner wall are also different, as shown in Figure 12. The longitudinal distribution trend of aerodynamic load on the tube’s inner wall at different measuring lines is consistent. But there are slight differences at specific positions. The maximum positive aerodynamic load, which is up to about 0.66 kPa, is on line-3, significantly greater than that of line-4 and line-5. However, the maximum negative aerodynamic load is on line-5, which is about 0.62 kPa.
The smaller the relative distance between the measured position of the tube and the train, the less intense the pressure mutation near the tail car, while the greater the pressure mutation near the head car. This indicates that the wide runner between the tube and the train can make the impact of the compression wave less intense, but the impact of the expansion wave on the tube becomes more intense.
3.4 Pressure effect on aerodynamic load of the tube’s inner wall
In this part, the influence of the pressure on the aerodynamic load on the inner wall of the tube is examined when the blockage ratio is 0.32 and the running speed is 0.8 Mach, as shown in Figure 13. The distribution characteristics of the maximum aerodynamic load on the tube with different pressures are shown in Figure 14.
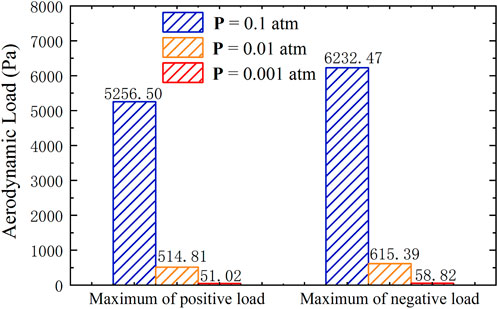
FIGURE 14. Distribution characteristics of the maximum aerodynamic load on the tube under different pressures.
As is shown in Figure 13, the variation of aerodynamic load on the tube with different pressures is consistent. The aerodynamic load on the tube’s inner wall decreases significantly when the air pressure in the tube decreases from 0.1 atm. In Figure 14, when the air pressure in the tube drops from 0.1 atm to 0.001 atm, the maximum positive and negative aerodynamic loads decrease significantly. When the air pressure in the tube is 0.001 atm, the maximum positive and negative aerodynamic loads are respectively 51.02 Pa, 58.82 Pa, which are 9.91%, 9.42% of those at 0.01 atm in the tube and 0.97%, 0.94% of those at 0.1 atm in the tube.
4 Conclusion
As a ductility research in the field of the less-emission HTS maglev train in the ETT system, this paper discusses the characteristics of a feasible HTS maglev train in the actual ETT application. A few preliminary conclusions are as follows:
1. Compared with the head car and the tail car, the variation of aerodynamic load on the middle car is relatively gentle. The aerodynamic load fluctuation on the tail car is more violent.
2. With the increasing running speed of the HTS maglev train, the air pressure in an enclosed tube fluctuates more violently, resulting in simultaneous increases in the pressures on the train’s surface and the tube’s inner wall.
3. The relative distance between the tube and the train influences the effect of different kinds of waves on the tube. The wide runner between the tube and the train can weaken the impact of the compression wave on the tube and the train, while the impact of the expansion wave on the tube and the train becomes stronger.
4. When the air pressure in a tube drops from 0.1 atm to 0.001 atm, the maximum positive and negative aerodynamic loads on the train’s surface and the tube’s inner wall are also respectively reduced to about 1%.
These conclusion can provide reference value for the design of ETT-HTS maglev system and promote the reduction of the energy consumption for the whole transportation system.
Data availability statement
The raw data supporting the conclusion of this article will be made available by the authors, without undue reservation.
Author contributions
Author XW: conceptualization, methodology, writing—original draft. JZ: supervision, validation, funding acquisition, writing—review and editing. YR: investigation, formal analysis, writing—original draft. YZ: investigation and formal analysis. ZD: funding acquisition. XH: software and formal analysis. All authors contributed to the article and approved the submitted version.
Funding
This work was partially supported by the Sichuan Science and Technology Program (2022JDTD0011 and 2022JDRC0017).
Conflict of interest
The authors declare that the research was conducted in the absence of any commercial or financial relationships that could be construed as a potential conflict of interest.
Publisher’s note
All claims expressed in this article are solely those of the authors and do not necessarily represent those of their affiliated organizations, or those of the publisher, the editors and the reviewers. Any product that may be evaluated in this article, or claim that may be made by its manufacturer, is not guaranteed or endorsed by the publisher.
References
Asress, M. B., and Svorcan, J. (2014). Numerical investigation on the aerodynamic characteristics of high-speed train under turbulent crosswind. J. Mod. Transp. 22, 225–234. doi:10.1007/s40534-014-0058-7
Bi, H., and Lei, B. (2009). Aerodynamic characteristics of evacuated tube high-speed train. Int. Conf. Transp. Eng. 2009, 3736–3741. doi:10.1061/41039(345)616
Deng, Z. G., Wang, J. S., Zheng, J., Jing, H., Lu, Y., Ma, G., et al. (2008). High-efficiency and low-cost permanent magnet guideway consideration for high-Tc superconducting Maglev vehicle practical application. Supercond. Sci. Technol. 21 (11), 115018. doi:10.1088/0953-2048/21/11/115018
Deng, Z., Zhang, W., Zheng, J., Wang, B., Ren, Y., Zheng, X., et al. (2017). A high-temperature superconducting maglev-evacuated tube transport (HTS Maglev-ETT) test system. IEEE Trans. Appl. Supercond. 27 (6), 1–8. doi:10.1109/tasc.2017.2716842
Glockle, H., and Pfretzschner, P. (September 1989). “High speed tests with ICE v passing through tunnels, and the effect of sealed coaches on passenger comfort,” in Proceedings of the International symposium on the aerodynamics and Brighton, United Kingdom.
Goddard, R. H. (1945). Apparatus for vacuum tube transportation. Arlington: United States Patent Office.
Herman, K. (1934). The invention of a hovertrack with wheelless vehicles which hover along iron rails using magnetic fields. Munich: Deutschen Patent-und Markenamts.
Huang, Z., Liang, X., and Chang, N. (2018). Analysis on simulation algorithm for train outflow field of vacuum pipeline traffic. J. Eng. Thermophys. 39 (06), 1244–1250.
Jia, W., Wang, K., Cheng, A., Kong, X., Cao, X., and Li, Q. (2018). Air flow and differential pressure characteristics in the vacuum tube transportation system based on pressure recycle ducts. Vacuum 150, 58–68. doi:10.1016/j.vacuum.2017.12.023
Jiang, J., Bai, X., Wu, L., and Zhang, Y. (2012). Design consideration of a super-high speed high temperature superconductor maglev evacuated tube transport (I). J. Mod. Transp. 20, 108–114. doi:10.1007/bf03325787
Jufer, M., Bourquin, V., and Sawley, M. (2006). Global modelisation of the swissmetro maglev using a numerical platform. Proc. MAGLEV 2006.
Kang, H., Jin, Y., Kwon, H., and Kim, K. (2017). A study on the aerodynamic drag of transonic vehicle in evacuated tube using computational fluid dynamics. Int. J. Aeronautical Space Sci. 18 (4), 614–622. doi:10.5139/ijass.2017.18.4.614
Kim, T. K., Kim, K. H., and Kwon, H. B. (2011). Aerodynamic characteristics of a tube train. J. wind Eng. industrial aerodynamics 99 (12), 1187–1196. doi:10.1016/j.jweia.2011.09.001
Le, T. T. G., Jang, K. S., Lee, K. S., and Ryu, J. (2020). Numerical investigation of aerodynamic drag and pressure waves in hyperloop systems. Mathematics 8 (11), 1973. doi:10.3390/math8111973
Li, R., and Yuan, L. (2014). Pressure waves in tunnels when high-speed train passing through. J. Mech. Eng. 50 (24), 115–121. doi:10.3901/jme.2014.24.115
Liu, J., Zhang, J., and Zhang, W. (2013). Analysis of aerodynamic characteristics of high-speed trains in the evacuated tube. J. Mech. Eng. 49 (22), 877–882. doi:10.3901/JME.2013.22.137
Mei, Y. G., Li, M. H., and Guo, R. (2019). Aerodynamic load distribution characteristics of pressure wave when trains passing each other in high-speed railway tunnel. China Railw. Sci. 40 (6), 60–67. doi:10.3969/j.issn.1001-4632.2019.06.08
Mossi, M., and Sibilla, S. (September 2002). “Swissmetro: Aerodynamic drag and wave effects in tunnels under partial vacuum,” in Proceedings of the 17th international conference on magnetically levitated systems and linear drives (Lausanne, Switzerland, 156–163.
Oh, J. S., Kang, T., Ham, S., Lee, K. S., Jang, Y. J., Ryou, H. S., et al. (2019). Numerical analysis of aerodynamic characteristics of hyperloop system. Energies 12 (3), 518. doi:10.3390/en12030518
Oster, D., Kumada, M., and Zhang, Y. (2011). Evacuated tube transport technologies (ET3) tm: A maximum value global transportation network for passengers and cargo. J. Mod. Transp. 19, 42–50. doi:10.1007/bf03325739
Schmitt, V. (1979). Pressure distributions on the ONERA M6-wing at transonic mach numbers, experimental data base for computer program assessment. AGARD Ar. 138.
Shih, T. H., Liou, W. W., Shabbir, A., Yang, Z., and Zhu, J. (1995). A new k-ϵ eddy viscosity model for high Reynolds number turbulent flows. Comput. fluids 24 (3), 227–238. doi:10.1016/0045-7930(94)00032-t
Sui, Y., Niu, J., Ricco, P., Yuan, Y., Yu, Q., Cao, X., et al. (2021). Impact of vacuum degree on the aerodynamics of a high-speed train capsule running in a tube. Int. J. Heat Fluid Flow 88, 108752. doi:10.1016/j.ijheatfluidflow.2020.108752
Wang, J., Wan, J., and Wu, J. (2008). Air pressure transient in high speed railway tunnels and passenger comfort criteria. Mod. Tunn. Techenology 45 (2), 1–5.
Zhang, R., Yan, L., Xu, S., and Wu, Y. (2004). A new high-speed maglev train——Scheme of high-speed maglev train for vacuum tunnel in Switzerland. Convert. Technol. Electr. Tract. 1, 44–46.
Zhang, Y., Yu, J., Shen, M., Oster, D., and Chen, C. (August 2011). Affecting factors and numerical value calculation relating to vacuumizing time in evacuated tube transportation, Proceedings of the 2011 6th Int. Forum Strategic Technol, 1. IEEE, 246–249. Harbin, China doi:10.1109/IFOST.2011.6021014
Keywords: high temperature superconducting maglev, high-speed train, aerodynamic load, tube maglev transport, low-pressure
Citation: Wang X, Zheng J, Rao Y, Zhang Y, Deng Z and Hu X (2023) Aerodynamic load analyses of less-emission HTS maglev train in evacuated tube transport system. Front. Energy Res. 11:1218137. doi: 10.3389/fenrg.2023.1218137
Received: 06 May 2023; Accepted: 30 May 2023;
Published: 07 June 2023.
Edited by:
Xiaoyuan Chen, Sichuan Normal University, ChinaReviewed by:
Xun Xu, University of Wollongong, AustraliaDonghui Jiang, Chinese Academy of Sciences (CAS), China
Lei Chen, Wuhan University, China
Copyright © 2023 Wang, Zheng, Rao, Zhang, Deng and Hu. This is an open-access article distributed under the terms of the Creative Commons Attribution License (CC BY). The use, distribution or reproduction in other forums is permitted, provided the original author(s) and the copyright owner(s) are credited and that the original publication in this journal is cited, in accordance with accepted academic practice. No use, distribution or reproduction is permitted which does not comply with these terms.
*Correspondence: Jun Zheng, anpoZW5nQHN3anR1LmVkdS5jbg==
 Xuanbo Wang
 Jun Zheng
 Zigang Deng
 Xiao Hu